| Param | Original file | Final file |
|---|---|---|
| Filename | modeM0/AS1T04_084T01_9000005198_36391cztM0_level2.evt | modeM0/AS1T04_084T01_9000005198_36391cztM0_level2_quad_clean.evt |
| Size (bytes) | 533,145,600 | 75,075,840 |
| Size | 508.4 MB | 71.6 MB |
| Events in quadrant A | 3,393,671 | 475,730 |
| Events in quadrant B | 4,368,830 | 460,455 |
| Events in quadrant C | 3,535,622 | 463,477 |
| Events in quadrant D | 4,422,458 | 434,781 |
| Mode M0 | |||
|---|---|---|---|
| Quadrant | BADHDUFLAG | Total packets | Discarded packets |
| A | 0 | 13759 | 3 |
| B | 0 | 16972 | 2 |
| C | 0 | 13821 | 2 |
| D | 0 | 17150 | 2 |
| Mode SS | |||
|---|---|---|---|
| Quadrant | BADHDUFLAG | Total packets | Discarded packets |
| A | 0 | 130 | 0 |
| B | 0 | 130 | 0 |
| C | 0 | 130 | 0 |
| D | 0 | 130 | 0 |
| Mode M9 | |||
|---|---|---|---|
| Quadrant | BADHDUFLAG | Total packets | Discarded packets |
| A | 0 | 41 | 0 |
| B | 0 | 41 | 0 |
| C | 0 | 41 | 0 |
| D | 0 | 41 | 0 |
| Quadrant | Total seconds | Saturated seconds | Saturation percentage |
|---|---|---|---|
| A | 6283 | 16 | 0.254655% |
| B | 6283 | 284 | 4.520134% |
| C | 6283 | 59 | 0.939042% |
| D | 6283 | 241 | 3.835747% |
Noise dominated data is calculated using 1-second bins in cleaned event files. If a bin has >2000 counts, and if more than 50% of those come from <1% of pixels, then it is considered to be noise-dominated and hence unusable.
| Quadrant | # 1 sec bins | Bins with >0 counts | Bins with >2000 counts | High rate bins dominated by noise | Noise dominated (total time) | Noise dominated (detector-on time) | Marked lightcurve |
|---|---|---|---|---|---|---|---|
| A | 10349 | 6285 | 5 | 5 | 0.05% | 0.08% | 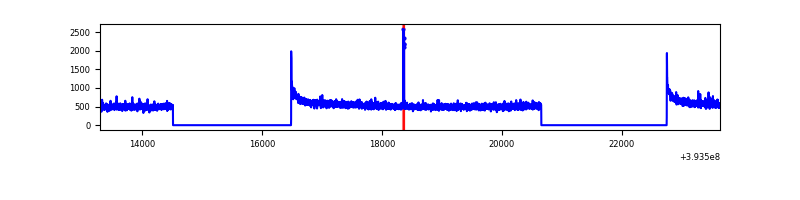 |
| B | 10349 | 6285 | 188 | 188 | 1.82% | 2.99% | 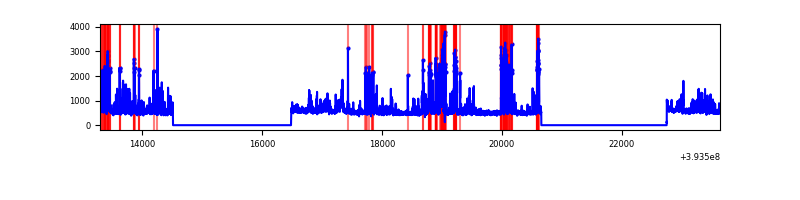 |
| C | 10349 | 6285 | 42 | 42 | 0.41% | 0.67% | 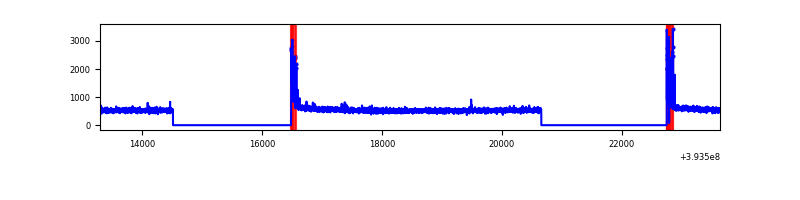 |
| D | 10349 | 6285 | 239 | 239 | 2.31% | 3.80% | 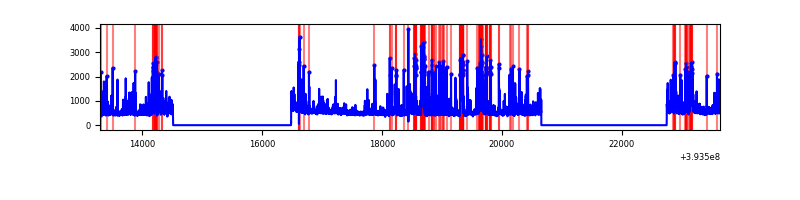 |
Top three noisy pixels from each quadrant. If the there are fewer than three noisy pixels in the level2.evt file, extra rows are filled as -1
| Pixel properties | Quadrant properties | ||||||
|---|---|---|---|---|---|---|---|
| Quadrant | DetID | PixID | Counts | Sigma | Mean | Median | Sigma |
| A | 10 | 83 | 205066 | 1267.76 | 815 | 800 | 161.1 |
| A | 9 | 143 | 21432 | 128.05 | 815 | 800 | 161.1 |
| A | 13 | 254 | 11208 | 64.59 | 815 | 800 | 161.1 |
| B | 5 | 172 | 861607 | 5736.67 | 798 | 779 | 150.1 |
| B | 0 | 189 | 129430 | 857.35 | 798 | 779 | 150.1 |
| B | 4 | 232 | 93831 | 620.11 | 798 | 779 | 150.1 |
| C | 15 | 214 | 268379 | 1473.84 | 788 | 795 | 181.6 |
| C | 0 | 10 | 189946 | 1041.84 | 788 | 795 | 181.6 |
| C | 13 | 61 | 5482 | 25.82 | 788 | 795 | 181.6 |
| D | 12 | 6 | 579360 | 3039.71 | 783 | 763 | 190.3 |
| D | 13 | 249 | 208230 | 1089.95 | 783 | 763 | 190.3 |
| D | 10 | 118 | 157362 | 822.71 | 783 | 763 | 190.3 |
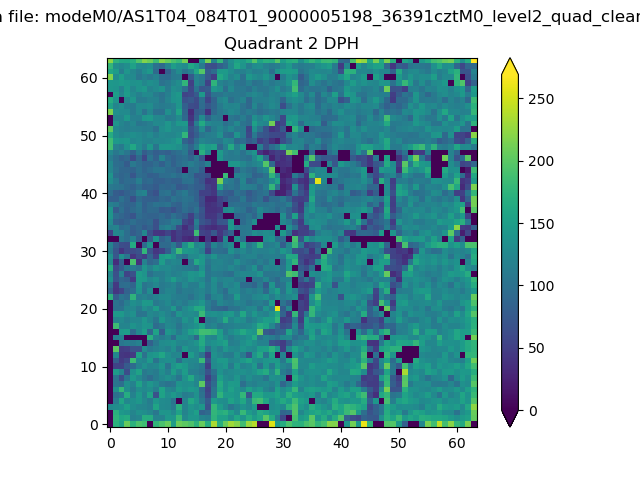
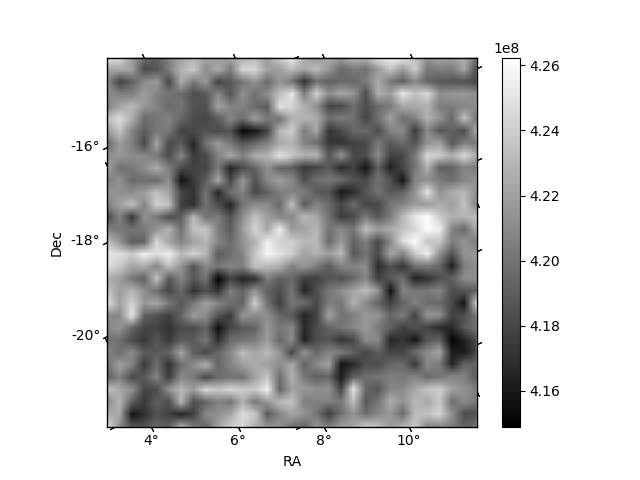
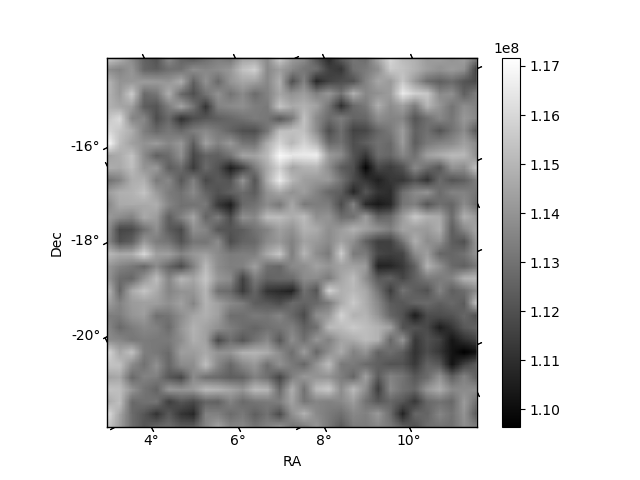
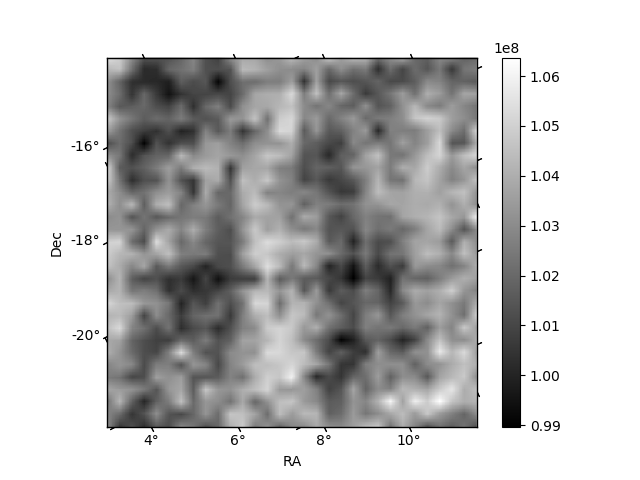
Histogram calculated using DETX and DETY for each event in the final _common_clean file
| Quadrant A | 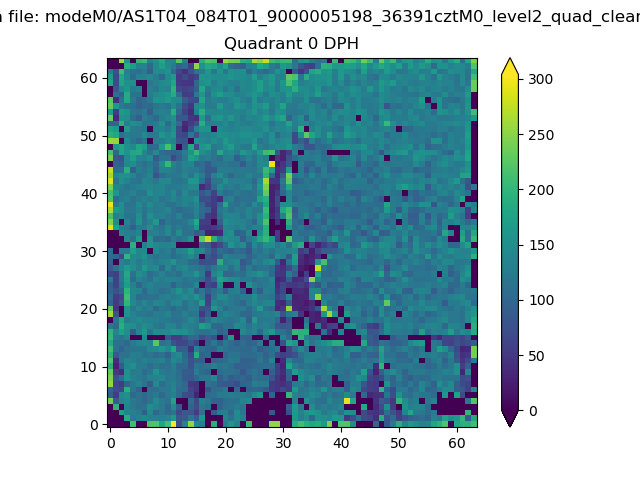 |
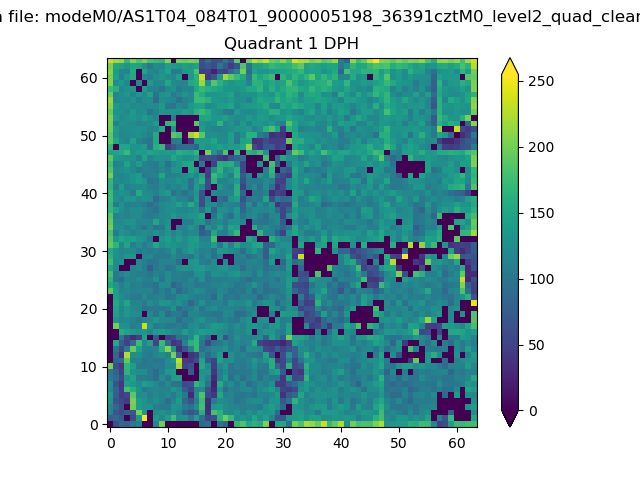 |
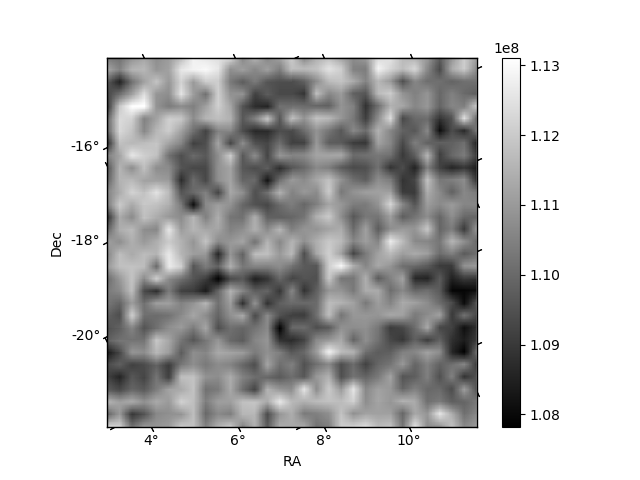
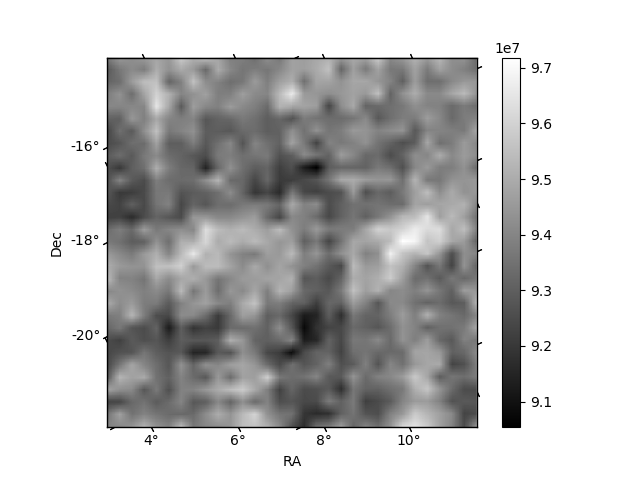
Quadrant B |
|---|---|---|---|
| Quadrant D | 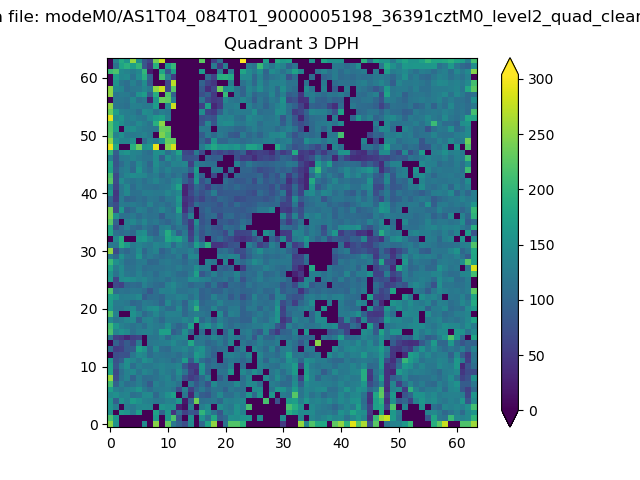 |
 |
Quadrant C |
| Plot type | Count rate plots | Images |
|---|---|---|
| Comparison with Poisson distribution Blue bars denote a histogram of data divided into 1 sec bins. Red curve is a Poisson curve with rate = median count rate of data. |
 |
 |
| Quadrant-wise count rates Data is divided into 100 sec bins |
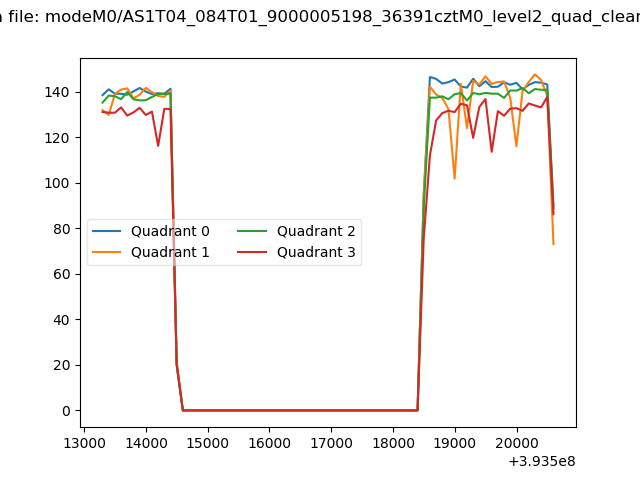 |
|
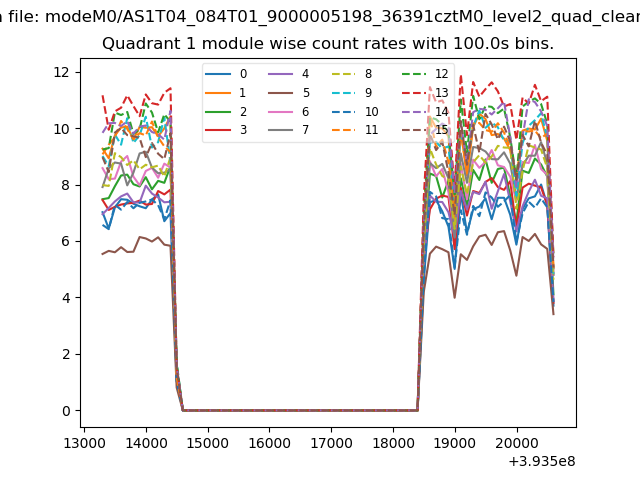
| Module-wise count rates for Quadrant A Data is divided into 100 sec bins |
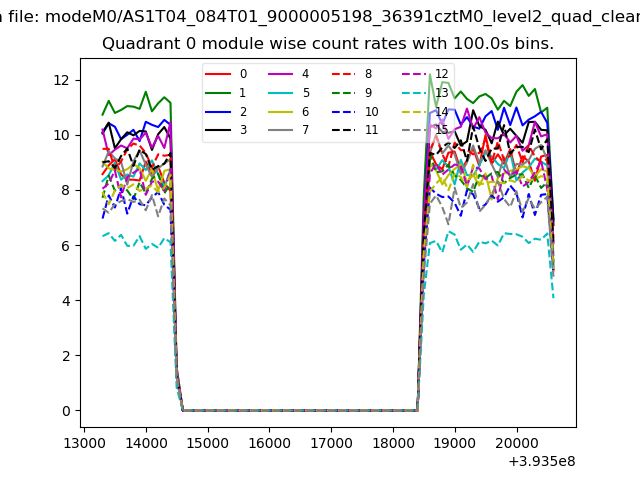 |
 |
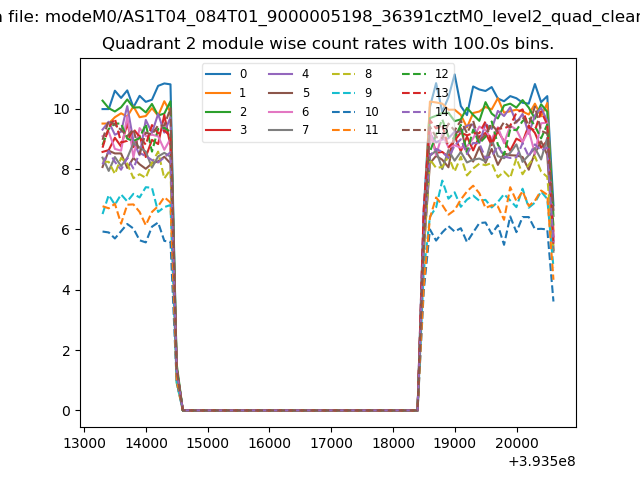
| Module-wise count rates for Quadrant B Data is divided into 100 sec bins |
 |
 |
| Module-wise count rates for Quadrant C Data is divided into 100 sec bins |
 |
 |
| Module-wise count rates for Quadrant D Data is divided into 100 sec bins |
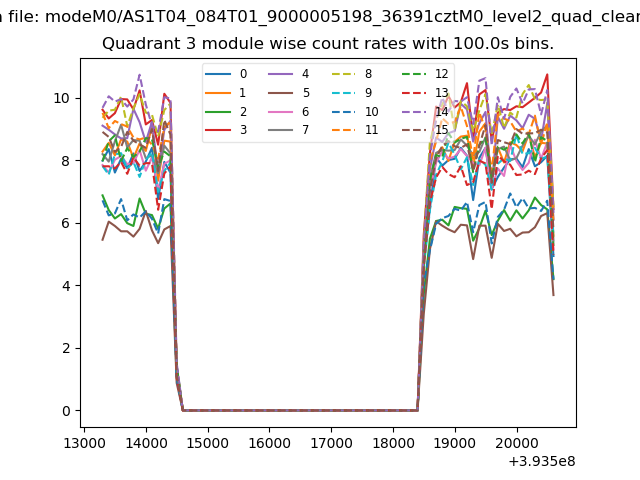 |
 |
| Parameter | Plot |
|---|---|
| CZT HV Monitor | 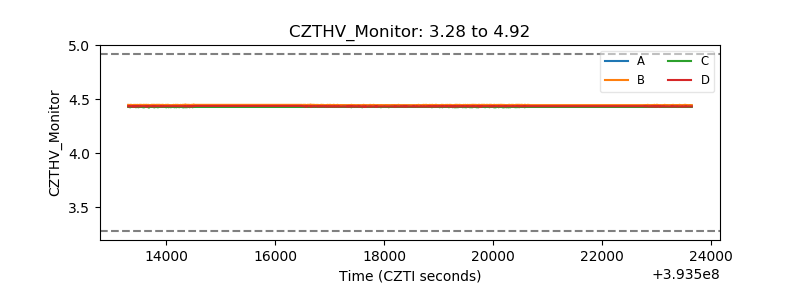 |
| D_VDD | 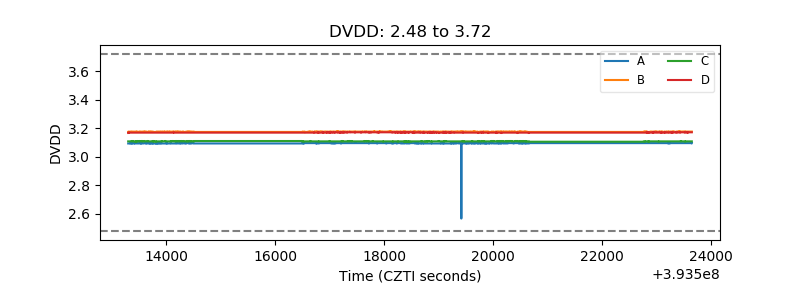 |
| Temperature 1 | 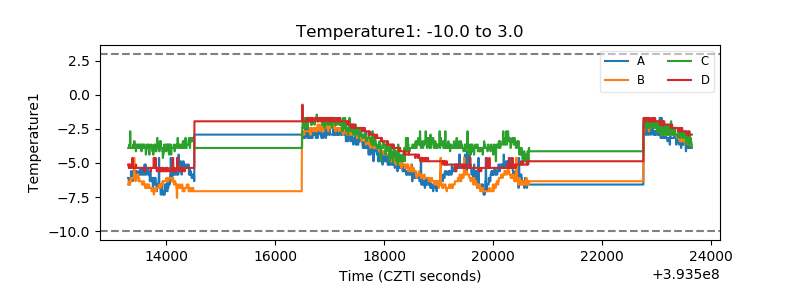 |
| Veto HV Monitor | 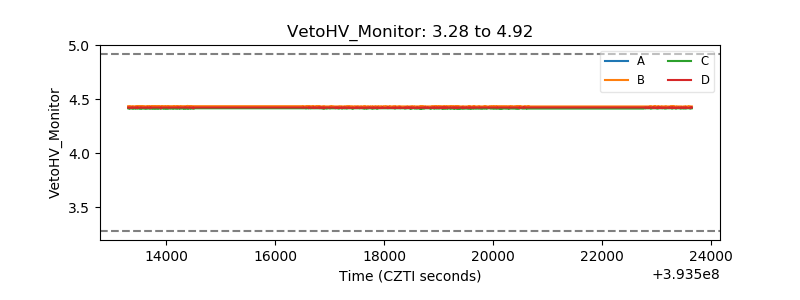 |
| Veto LLD | 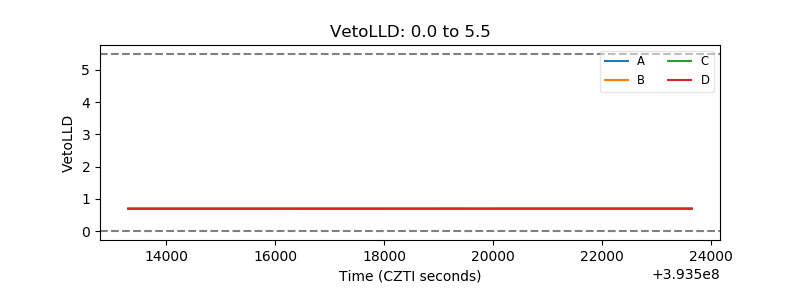 |
| Alpha Counter | 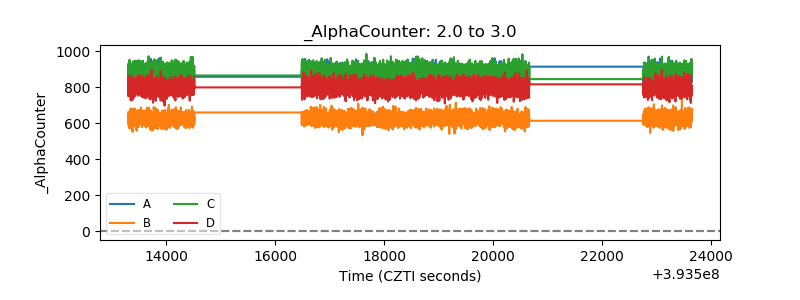 |
| _CPM_Rate | 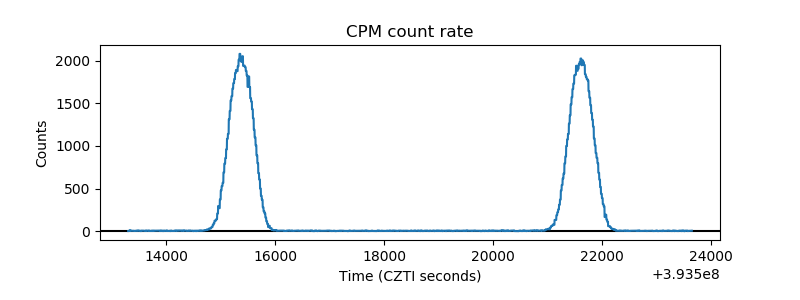 |
| CZT Counter | 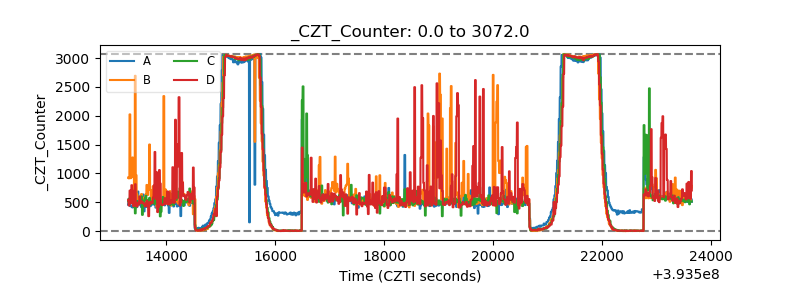 |
| +2.5 Volts monitor |  |
| +5 Volts monitor |  |
| _ROLL_ROT |  |
| _Roll_DEC | 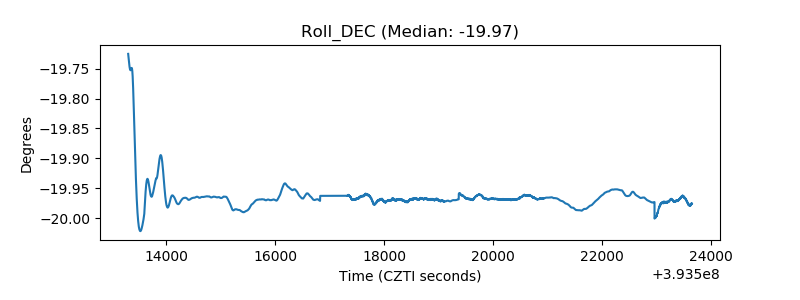 |
| _Roll_RA | 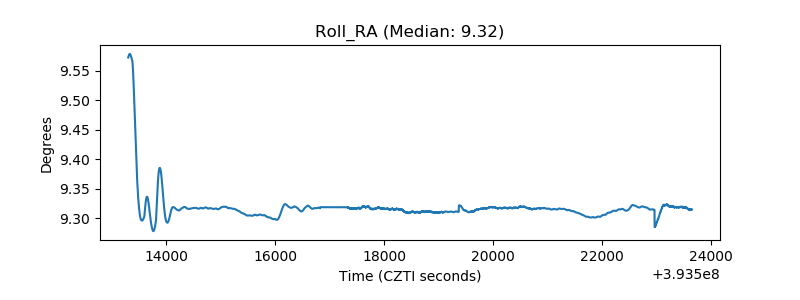 |
| Veto Counter |  |