| Param | Original file | Final file |
|---|---|---|
| Filename | modeM0/AS1T04_084T01_9000005198_36396cztM0_level2.evt | modeM0/AS1T04_084T01_9000005198_36396cztM0_level2_quad_clean.evt |
| Size (bytes) | 470,306,880 | 81,964,800 |
| Size | 448.5 MB | 78.2 MB |
| Events in quadrant A | 2,878,284 | 530,159 |
| Events in quadrant B | 4,022,179 | 522,681 |
| Events in quadrant C | 2,943,808 | 524,418 |
| Events in quadrant D | 4,006,986 | 501,269 |
| Mode M0 | |||
|---|---|---|---|
| Quadrant | BADHDUFLAG | Total packets | Discarded packets |
| A | 0 | 12255 | 3 |
| B | 0 | 15839 | 2 |
| C | 0 | 12160 | 2 |
| D | 0 | 15898 | 2 |
| Mode SS | |||
|---|---|---|---|
| Quadrant | BADHDUFLAG | Total packets | Discarded packets |
| A | 0 | 118 | 0 |
| B | 0 | 118 | 0 |
| C | 0 | 118 | 0 |
| D | 0 | 118 | 0 |
| Mode M9 | |||
|---|---|---|---|
| Quadrant | BADHDUFLAG | Total packets | Discarded packets |
| A | 0 | 23 | 0 |
| B | 0 | 23 | 0 |
| C | 0 | 23 | 0 |
| D | 0 | 24 | 0 |
| Quadrant | Total seconds | Saturated seconds | Saturation percentage |
|---|---|---|---|
| A | 5770 | 18 | 0.311958% |
| B | 5770 | 270 | 4.679376% |
| C | 5770 | 29 | 0.502600% |
| D | 5770 | 385 | 6.672444% |
Noise dominated data is calculated using 1-second bins in cleaned event files. If a bin has >2000 counts, and if more than 50% of those come from <1% of pixels, then it is considered to be noise-dominated and hence unusable.
| Quadrant | # 1 sec bins | Bins with >0 counts | Bins with >2000 counts | High rate bins dominated by noise | Noise dominated (total time) | Noise dominated (detector-on time) | Marked lightcurve |
|---|---|---|---|---|---|---|---|
| A | 7112 | 5771 | 0 | 0 | 0.00% | 0.00% | 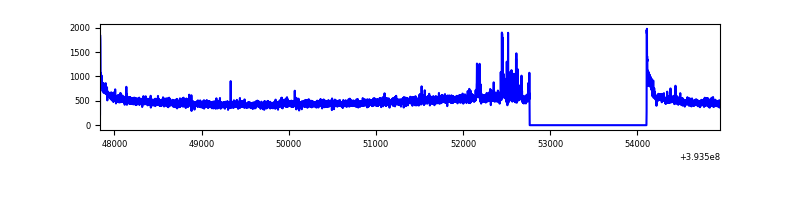 |
| B | 7112 | 5771 | 175 | 175 | 2.46% | 3.03% | 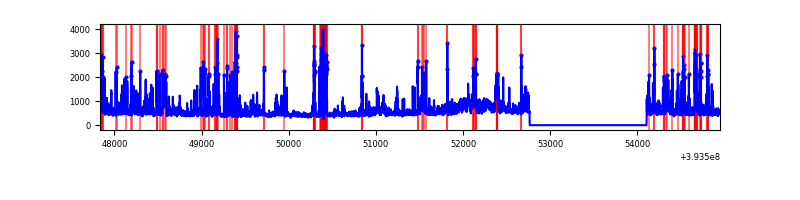 |
| C | 7112 | 5771 | 16 | 16 | 0.22% | 0.28% | 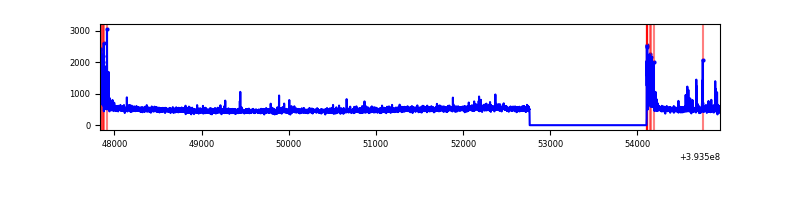 |
| D | 7112 | 5771 | 360 | 360 | 5.06% | 6.24% | 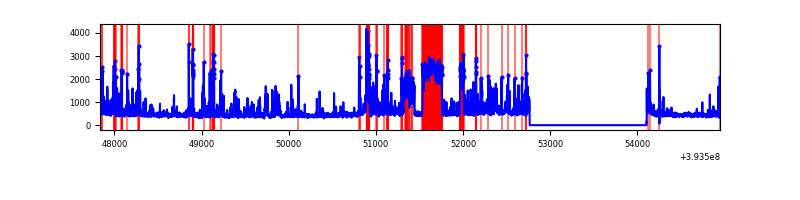 |
Top three noisy pixels from each quadrant. If the there are fewer than three noisy pixels in the level2.evt file, extra rows are filled as -1
| Pixel properties | Quadrant properties | ||||||
|---|---|---|---|---|---|---|---|
| Quadrant | DetID | PixID | Counts | Sigma | Mean | Median | Sigma |
| A | 10 | 83 | 192417 | 1429.89 | 663 | 650 | 134.1 |
| A | 15 | 223 | 93958 | 695.74 | 663 | 650 | 134.1 |
| A | 2 | 79 | 11237 | 78.94 | 663 | 650 | 134.1 |
| B | 5 | 255 | 560785 | 4428.75 | 648 | 630 | 126.5 |
| B | 5 | 172 | 486230 | 3839.3 | 648 | 630 | 126.5 |
| B | 0 | 189 | 200292 | 1578.59 | 648 | 630 | 126.5 |
| C | 15 | 214 | 244962 | 1603.68 | 648 | 653 | 152.3 |
| C | 0 | 10 | 167262 | 1093.64 | 648 | 653 | 152.3 |
| C | 13 | 61 | 4257 | 23.66 | 648 | 653 | 152.3 |
| D | 12 | 227 | 802522 | 5110.43 | 632 | 615 | 156.9 |
| D | 12 | 6 | 275397 | 1751.14 | 632 | 615 | 156.9 |
| D | 10 | 118 | 142998 | 907.38 | 632 | 615 | 156.9 |
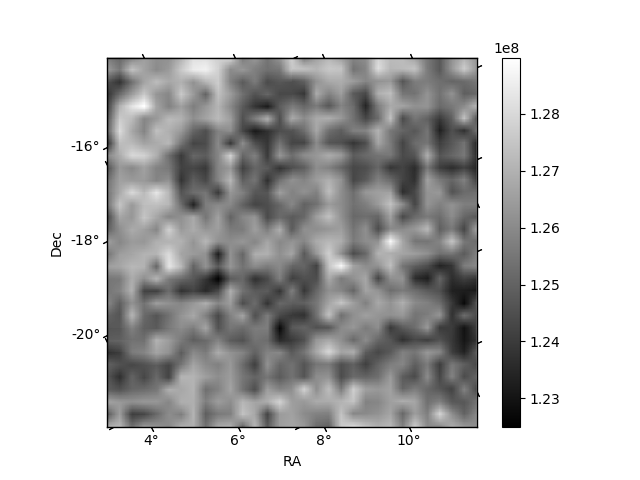
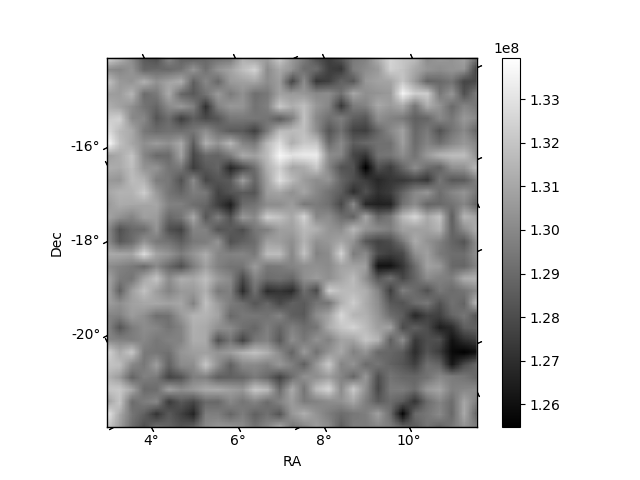
Histogram calculated using DETX and DETY for each event in the final _common_clean file
| Quadrant A | 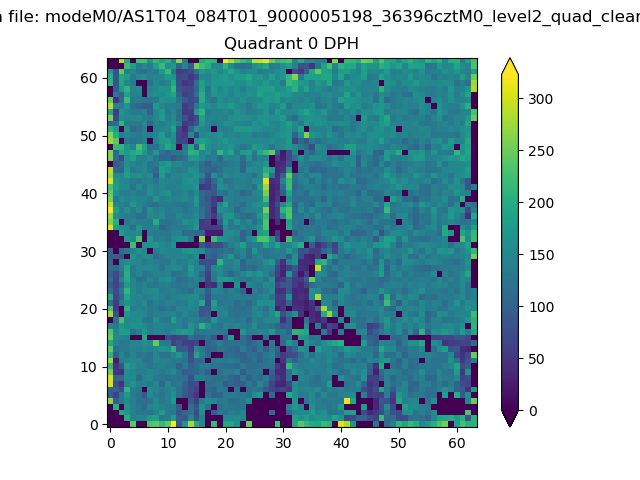 |
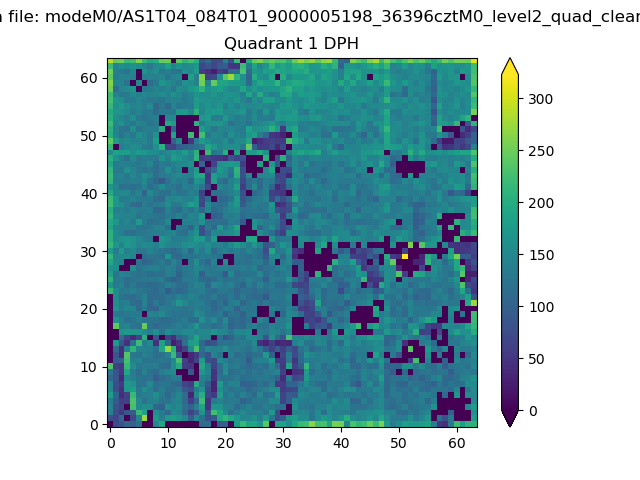 |
Quadrant B |
|---|---|---|---|
| Quadrant D | 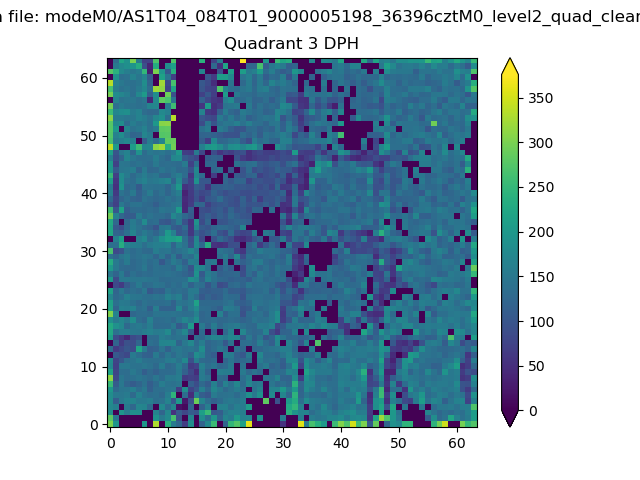 |
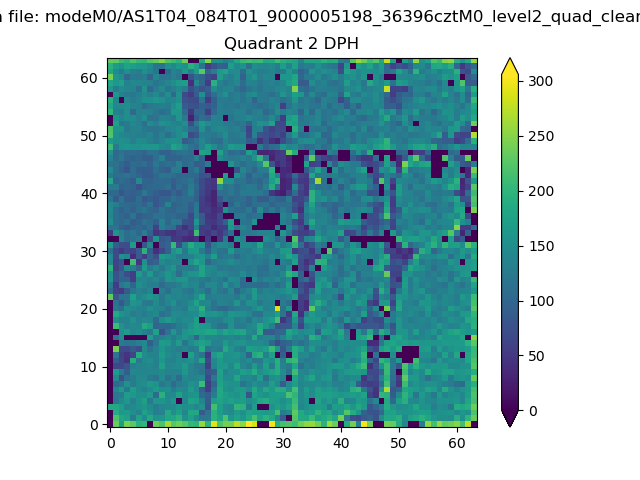 |
Quadrant C |
| Plot type | Count rate plots | Images |
|---|---|---|
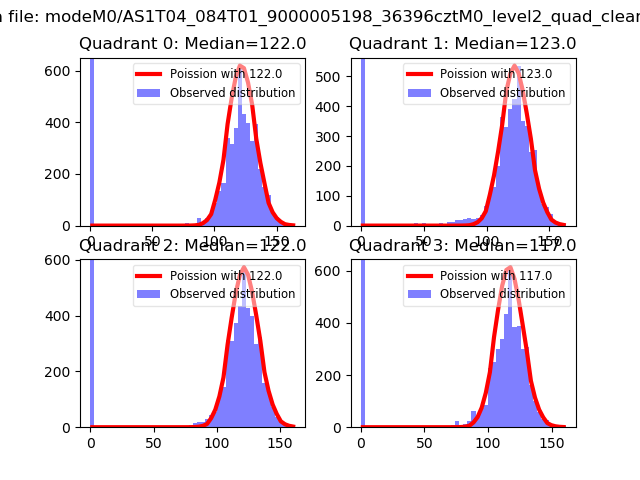
| Comparison with Poisson distribution Blue bars denote a histogram of data divided into 1 sec bins. Red curve is a Poisson curve with rate = median count rate of data. |
 |
 |
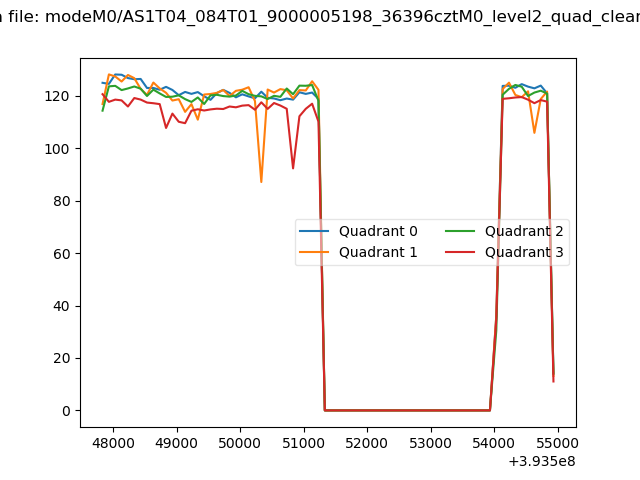
| Quadrant-wise count rates Data is divided into 100 sec bins |
 |
|
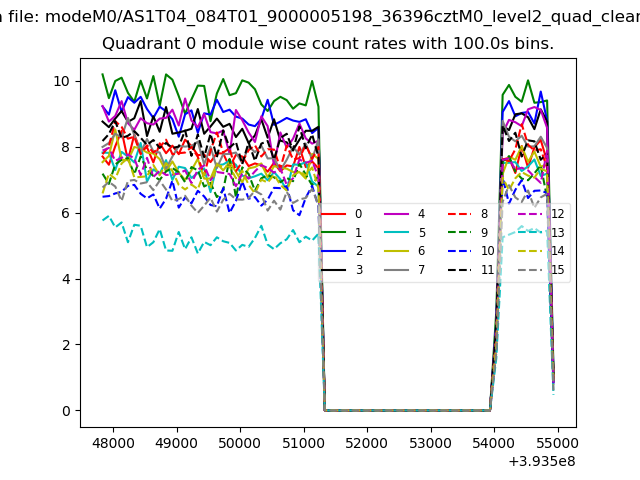
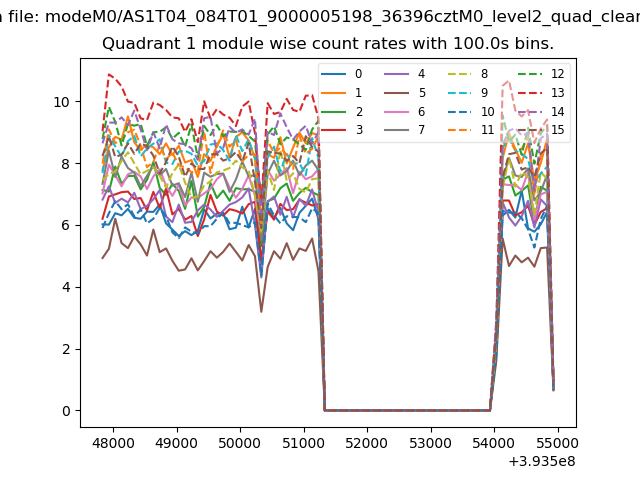
| Module-wise count rates for Quadrant A Data is divided into 100 sec bins |
 |
 |
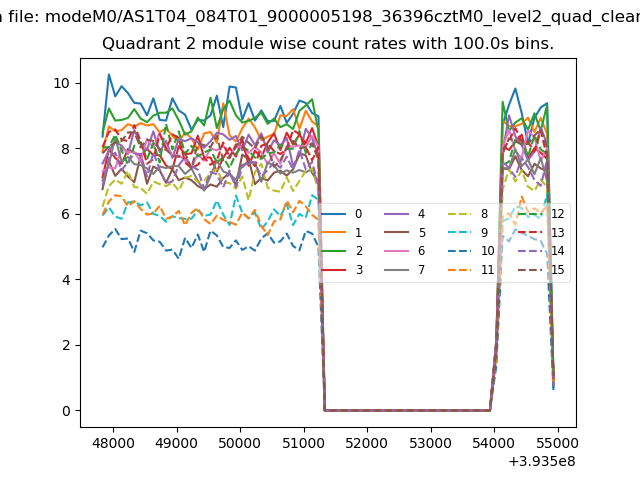
| Module-wise count rates for Quadrant B Data is divided into 100 sec bins |
 |
 |
| Module-wise count rates for Quadrant C Data is divided into 100 sec bins |
 |
 |
| Module-wise count rates for Quadrant D Data is divided into 100 sec bins |
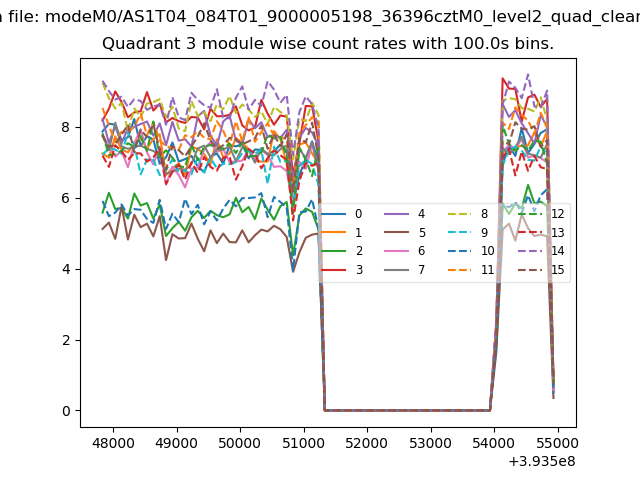 |
 |
| Parameter | Plot |
|---|---|
| CZT HV Monitor | 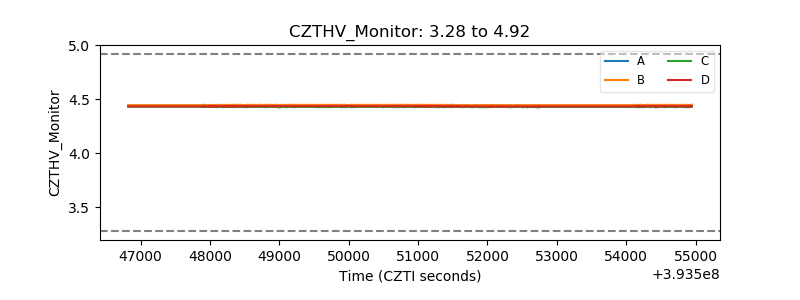 |
| D_VDD | 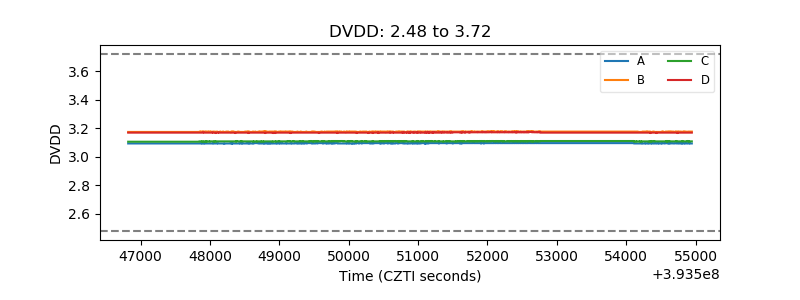 |
| Temperature 1 | 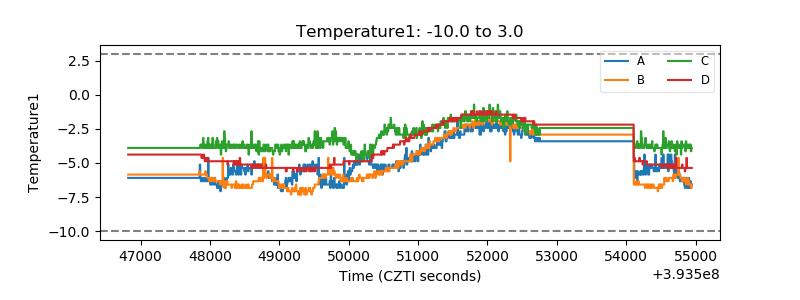 |
| Veto HV Monitor | 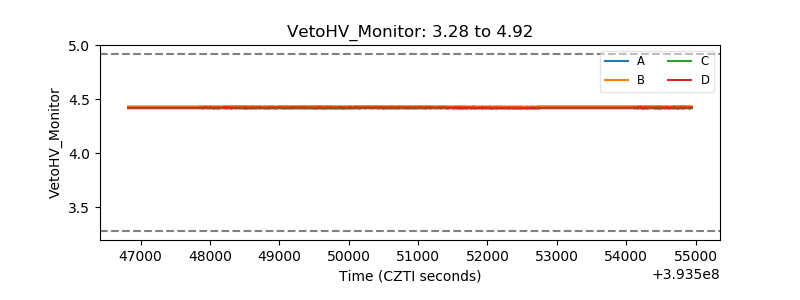 |
| Veto LLD | 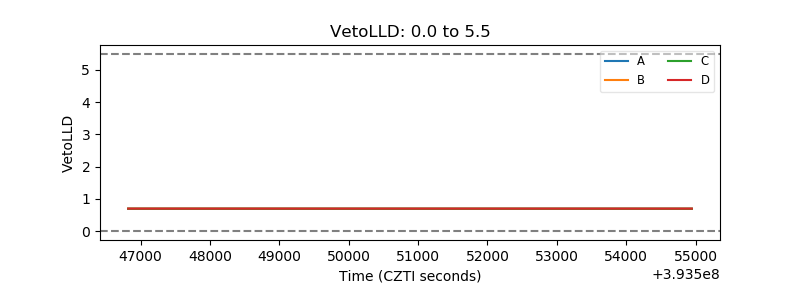 |
| Alpha Counter | 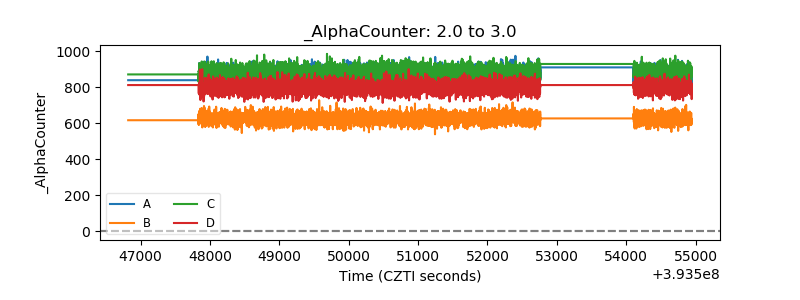 |
| _CPM_Rate | 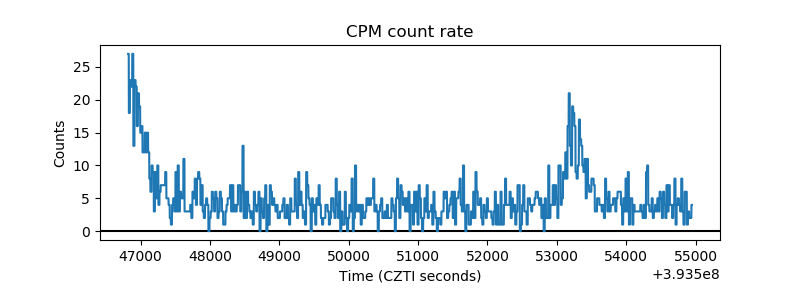 |
| CZT Counter | 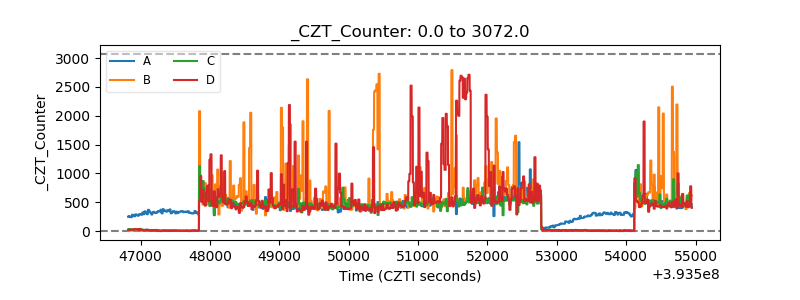 |
| +2.5 Volts monitor | 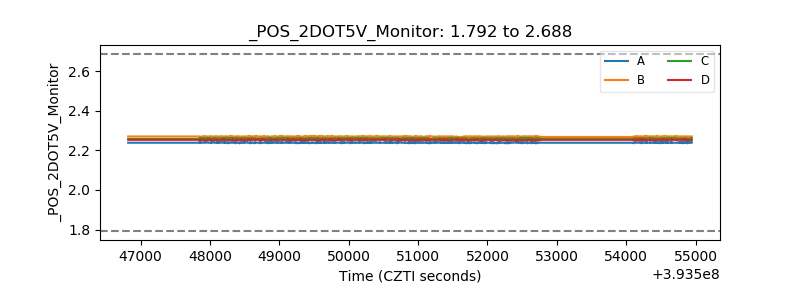 |
| +5 Volts monitor |  |
| _ROLL_ROT | 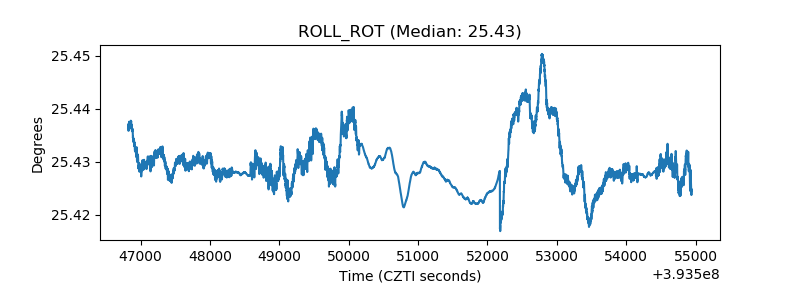 |
| _Roll_DEC | 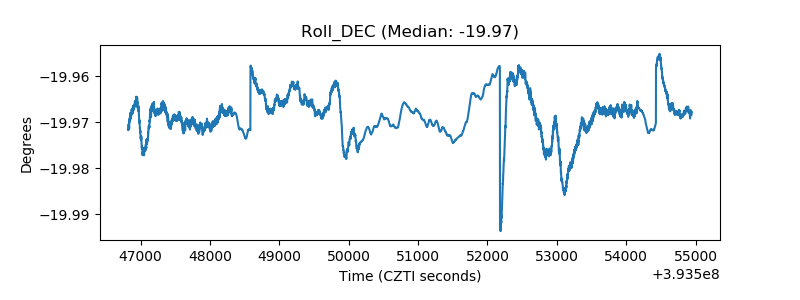 |
| _Roll_RA | 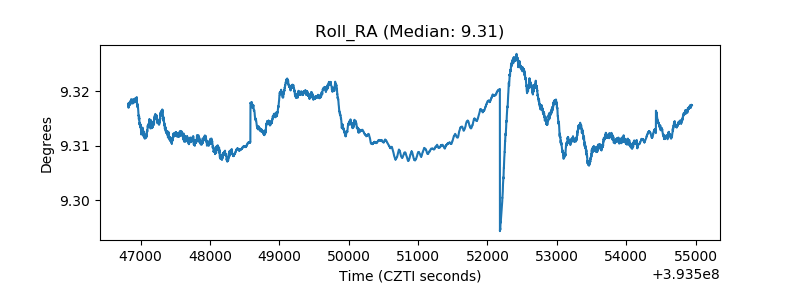 |
| Veto Counter | 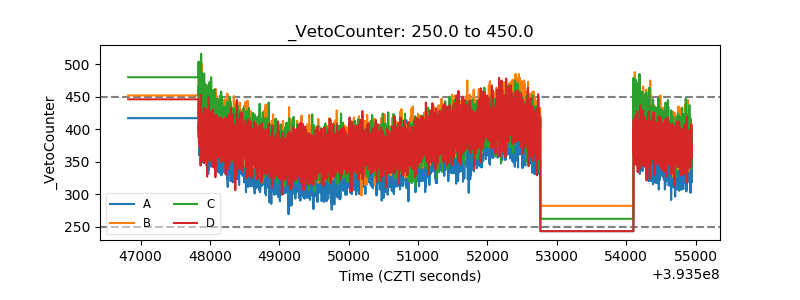 |