| Param | Original file | Final file |
|---|---|---|
| Filename | modeM0/AS1T04_084T01_9000005198_36418cztM0_level2.evt | modeM0/AS1T04_084T01_9000005198_36418cztM0_level2_quad_clean.evt |
| Size (bytes) | 469,771,200 | 58,129,920 |
| Size | 448.0 MB | 55.4 MB |
| Events in quadrant A | 3,007,040 | 354,829 |
| Events in quadrant B | 4,464,966 | 348,122 |
| Events in quadrant C | 3,095,546 | 340,501 |
| Events in quadrant D | 3,288,390 | 333,720 |
| Mode M0 | |||
|---|---|---|---|
| Quadrant | BADHDUFLAG | Total packets | Discarded packets |
| A | 0 | 12304 | 3 |
| B | 0 | 16730 | 2 |
| C | 0 | 12220 | 2 |
| D | 0 | 13300 | 2 |
| Mode SS | |||
|---|---|---|---|
| Quadrant | BADHDUFLAG | Total packets | Discarded packets |
| A | 0 | 112 | 0 |
| B | 0 | 112 | 0 |
| C | 0 | 112 | 0 |
| D | 0 | 112 | 0 |
| Mode M9 | |||
|---|---|---|---|
| Quadrant | BADHDUFLAG | Total packets | Discarded packets |
| A | 0 | 21 | 0 |
| B | 0 | 21 | 0 |
| C | 0 | 21 | 0 |
| D | 0 | 22 | 0 |
| Quadrant | Total seconds | Saturated seconds | Saturation percentage |
|---|---|---|---|
| A | 5465 | 9 | 0.164684% |
| B | 5465 | 509 | 9.313815% |
| C | 5465 | 102 | 1.866423% |
| D | 5465 | 90 | 1.646844% |
Noise dominated data is calculated using 1-second bins in cleaned event files. If a bin has >2000 counts, and if more than 50% of those come from <1% of pixels, then it is considered to be noise-dominated and hence unusable.
| Quadrant | # 1 sec bins | Bins with >0 counts | Bins with >2000 counts | High rate bins dominated by noise | Noise dominated (total time) | Noise dominated (detector-on time) | Marked lightcurve |
|---|---|---|---|---|---|---|---|
| A | 7348 | 5466 | 1 | 1 | 0.01% | 0.02% | 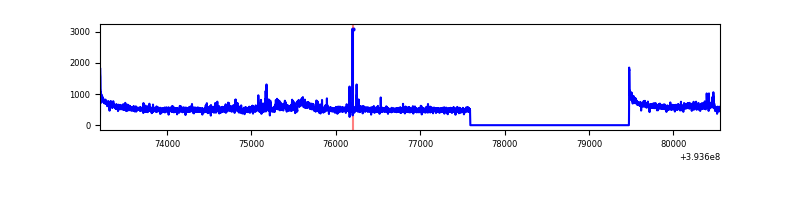 |
| B | 7348 | 5466 | 375 | 375 | 5.10% | 6.86% | 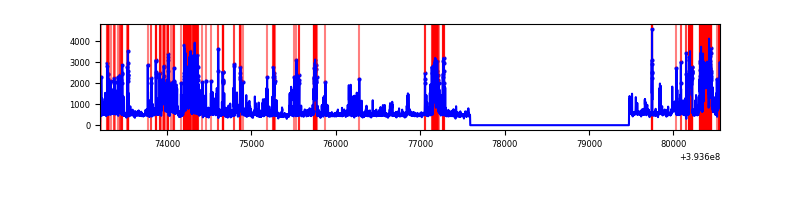 |
| C | 7348 | 5466 | 78 | 78 | 1.06% | 1.43% | 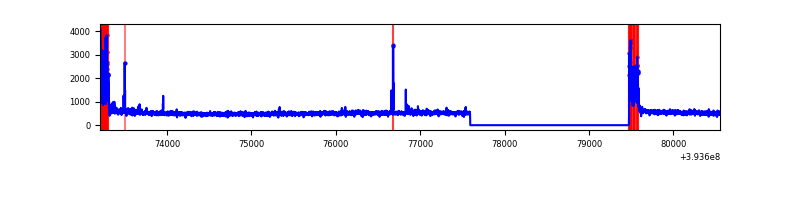 |
| D | 7348 | 5466 | 71 | 71 | 0.97% | 1.30% | 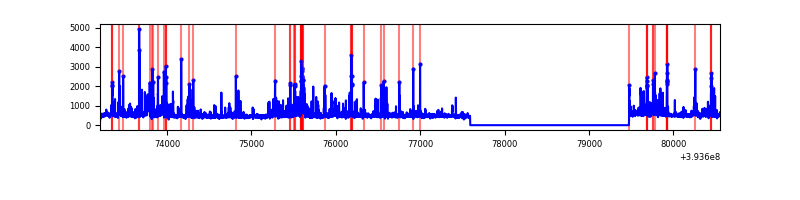 |
Top three noisy pixels from each quadrant. If the there are fewer than three noisy pixels in the level2.evt file, extra rows are filled as -1
| Pixel properties | Quadrant properties | ||||||
|---|---|---|---|---|---|---|---|
| Quadrant | DetID | PixID | Counts | Sigma | Mean | Median | Sigma |
| A | 15 | 223 | 194538 | 1423.76 | 676 | 664 | 136.2 |
| A | 10 | 83 | 187015 | 1368.52 | 676 | 664 | 136.2 |
| A | 13 | 254 | 9243 | 63.0 | 676 | 664 | 136.2 |
| B | 5 | 172 | 1386903 | 11253.18 | 636 | 619 | 123.2 |
| B | 5 | 236 | 158529 | 1281.84 | 636 | 619 | 123.2 |
| B | 0 | 189 | 152869 | 1235.89 | 636 | 619 | 123.2 |
| C | 0 | 10 | 347225 | 2321.39 | 640 | 644 | 149.3 |
| C | 15 | 214 | 235670 | 1574.2 | 640 | 644 | 149.3 |
| C | 1 | 241 | 16206 | 104.23 | 640 | 644 | 149.3 |
| D | 2 | 249 | 227092 | 1430.58 | 653 | 634 | 158.3 |
| D | 10 | 199 | 103681 | 650.97 | 653 | 634 | 158.3 |
| D | 12 | 6 | 101989 | 640.28 | 653 | 634 | 158.3 |
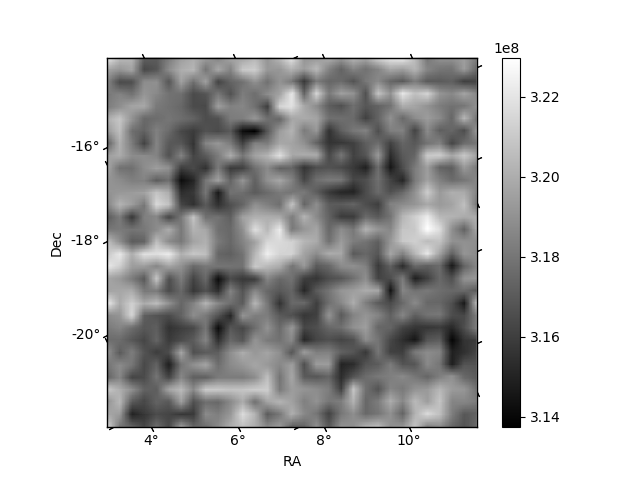
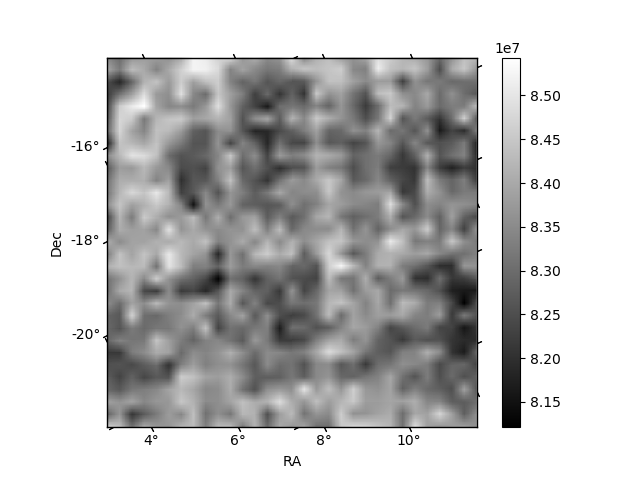
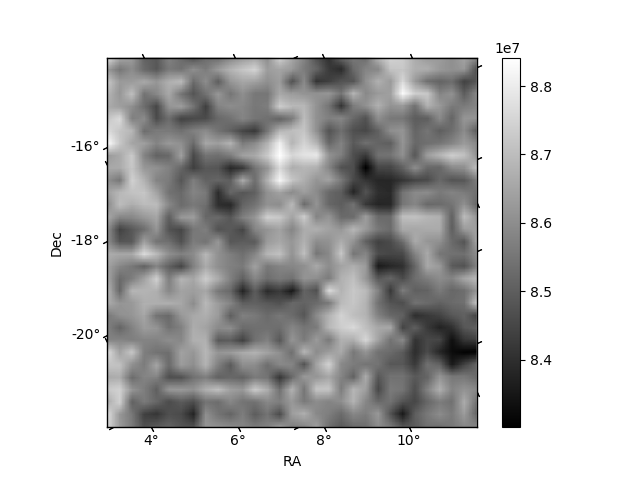
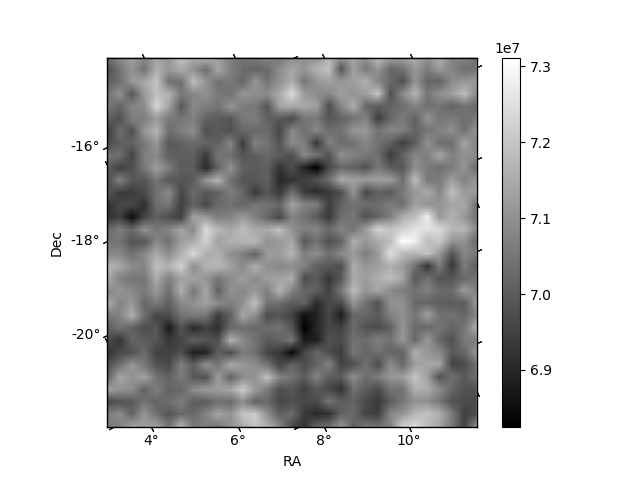
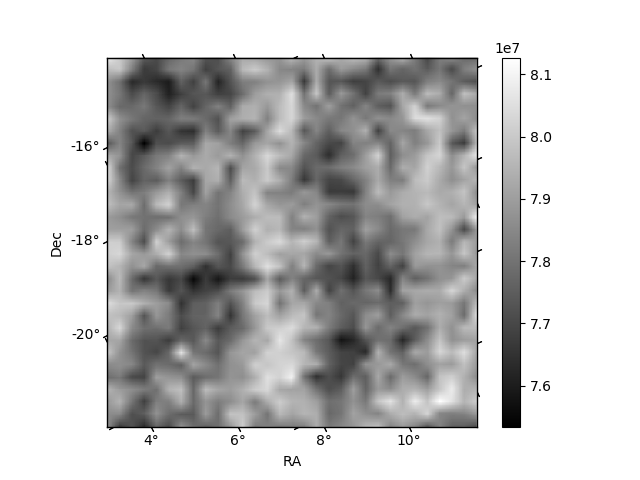
Histogram calculated using DETX and DETY for each event in the final _common_clean file
| Quadrant A | 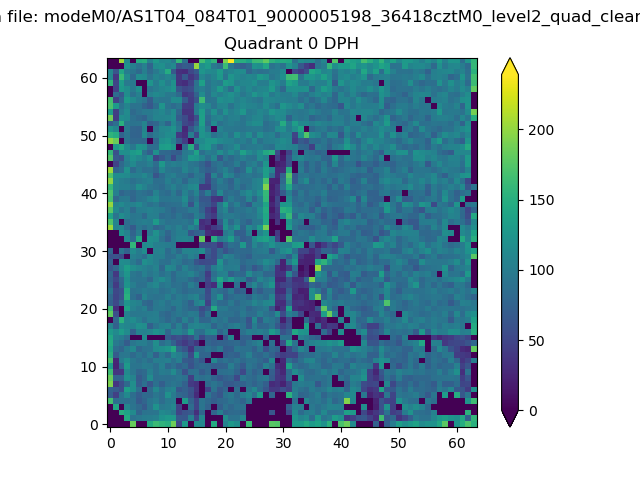 |
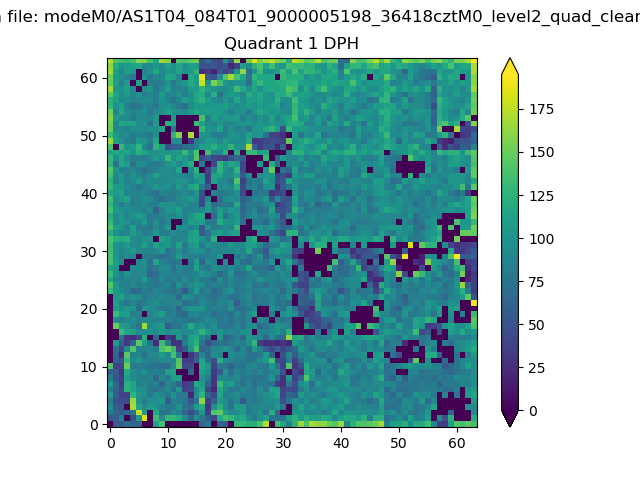 |
Quadrant B |
|---|---|---|---|
| Quadrant D | 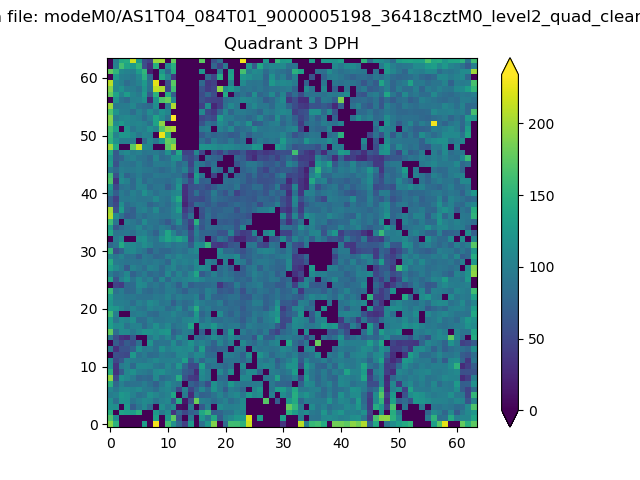 |
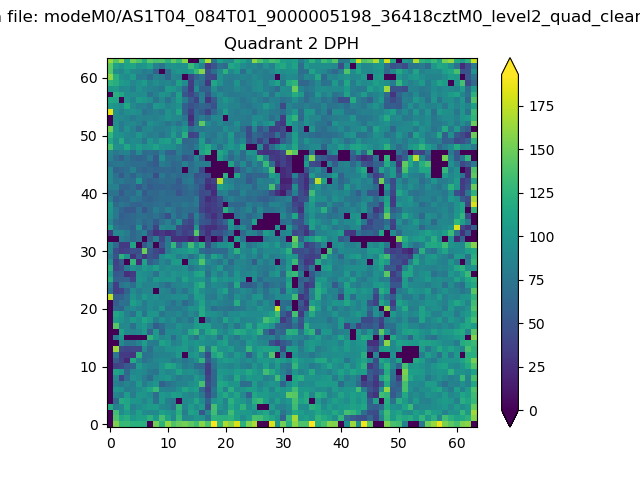 |
Quadrant C |
| Plot type | Count rate plots | Images |
|---|---|---|
| Comparison with Poisson distribution Blue bars denote a histogram of data divided into 1 sec bins. Red curve is a Poisson curve with rate = median count rate of data. |
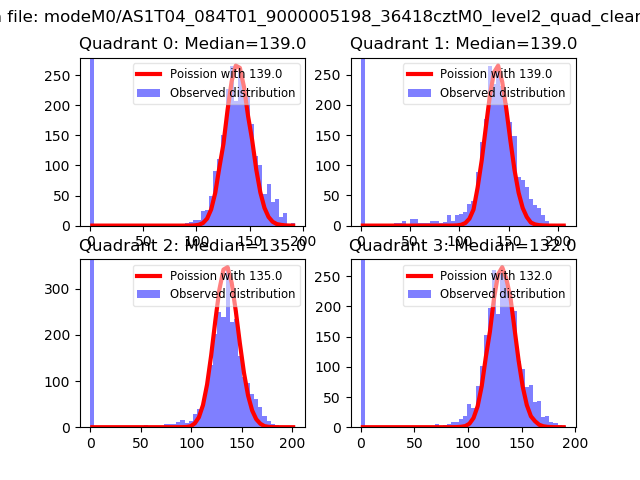 |
 |
| Quadrant-wise count rates Data is divided into 100 sec bins |
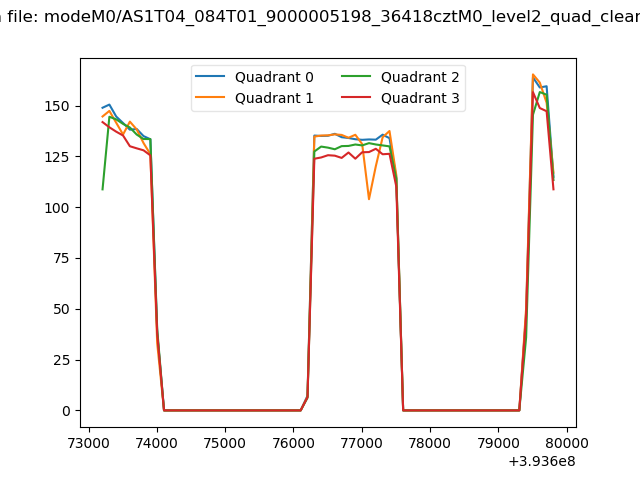 |
|
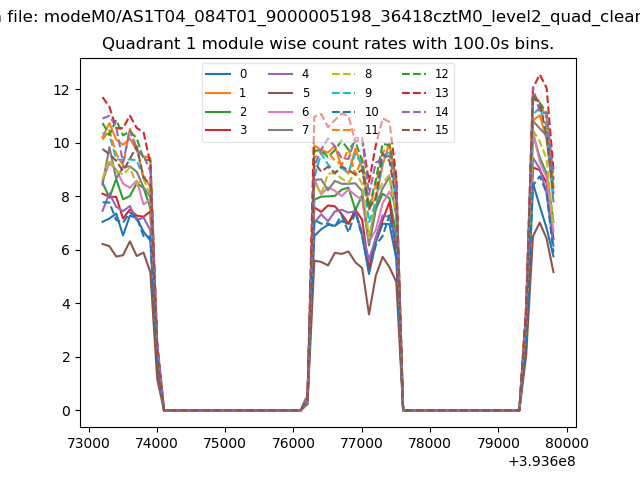
| Module-wise count rates for Quadrant A Data is divided into 100 sec bins |
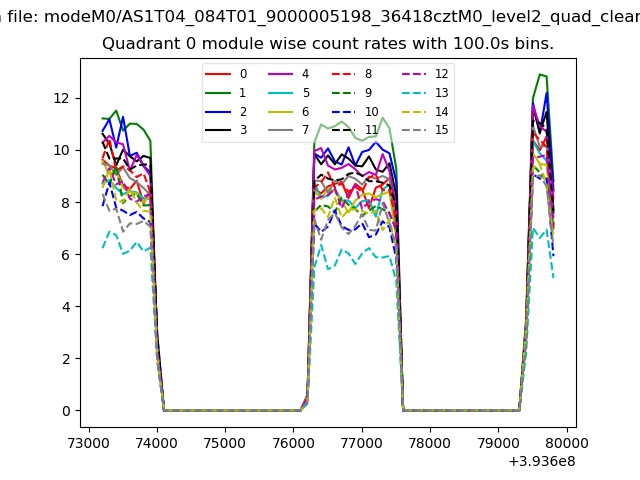 |
 |
| Module-wise count rates for Quadrant B Data is divided into 100 sec bins |
 |
 |
| Module-wise count rates for Quadrant C Data is divided into 100 sec bins |
 |
 |
| Module-wise count rates for Quadrant D Data is divided into 100 sec bins |
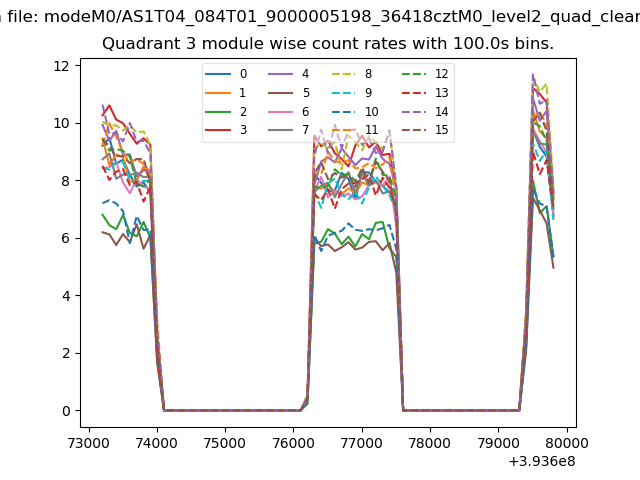 |
 |
| Parameter | Plot |
|---|---|
| CZT HV Monitor | 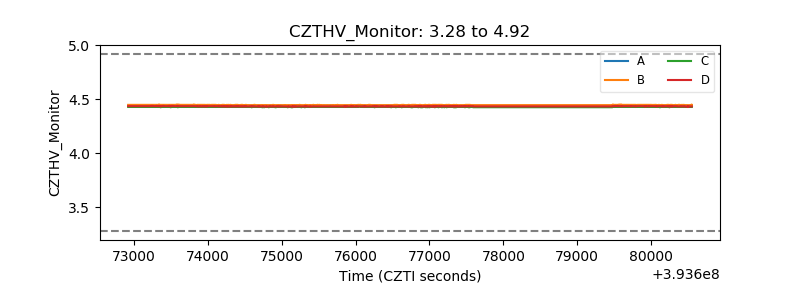 |
| D_VDD | 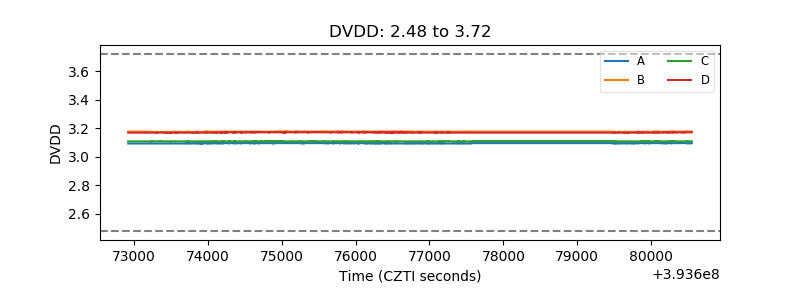 |
| Temperature 1 | 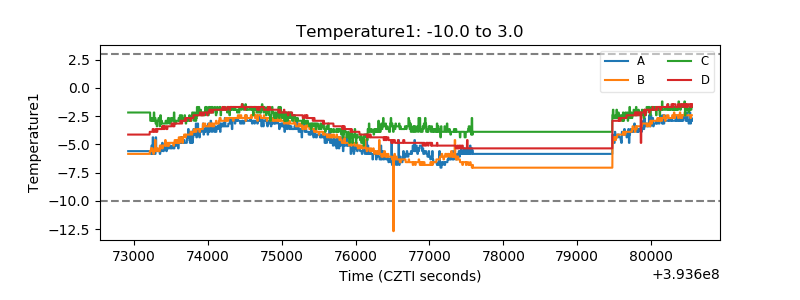 |
| Veto HV Monitor | 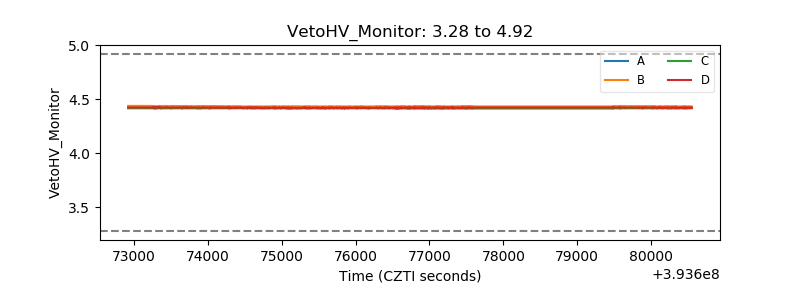 |
| Veto LLD | 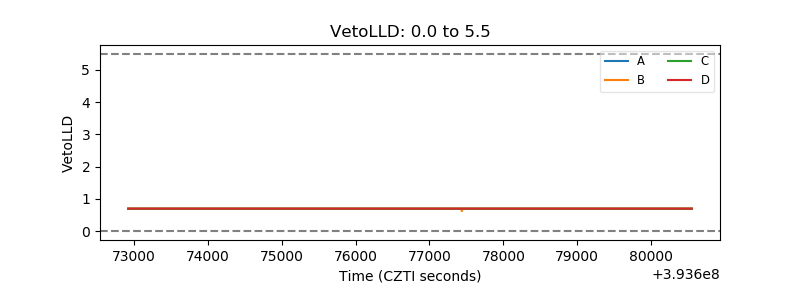 |
| Alpha Counter | 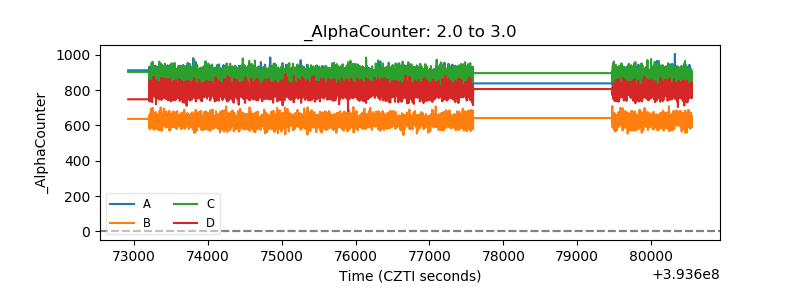 |
| _CPM_Rate | 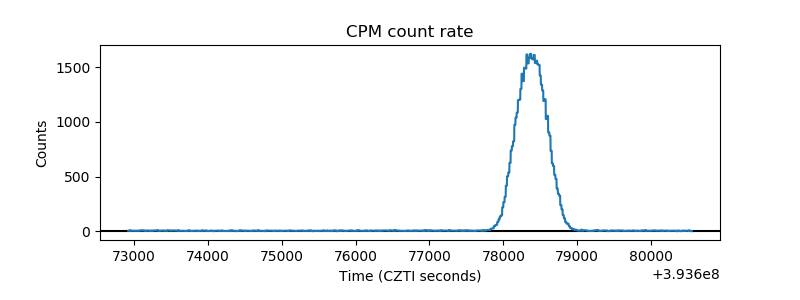 |
| CZT Counter | 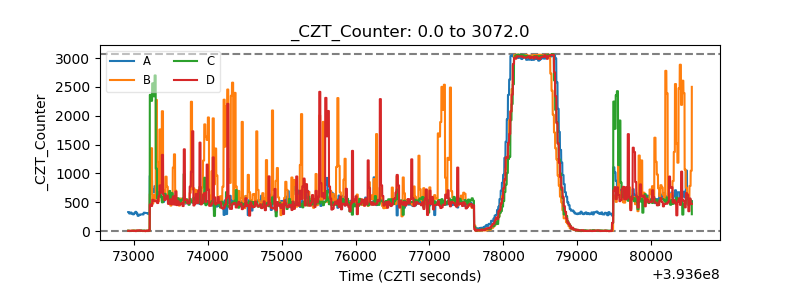 |
| +2.5 Volts monitor |  |
| +5 Volts monitor |  |
| _ROLL_ROT | 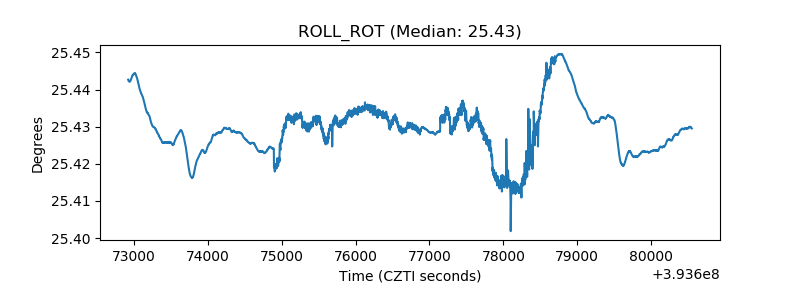 |
| _Roll_DEC | 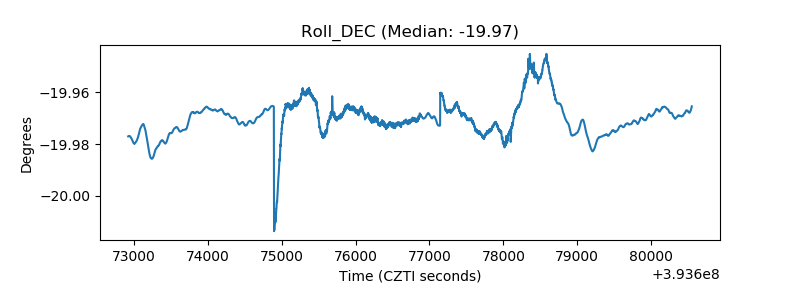 |
| _Roll_RA | 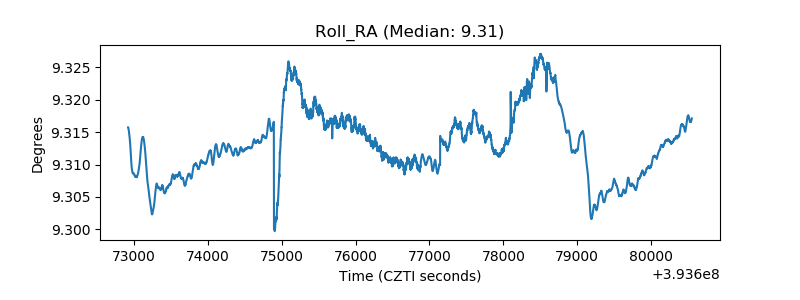 |
| Veto Counter | 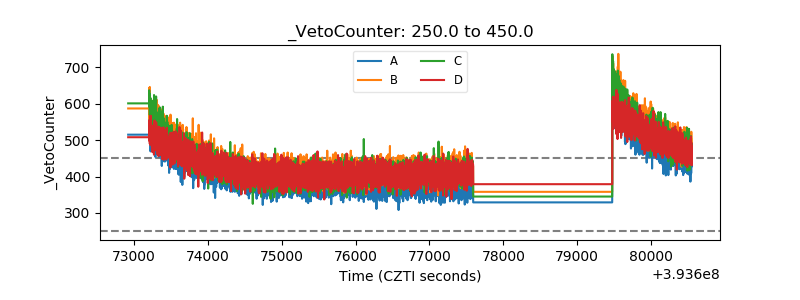 |