| Param | Original file | Final file |
|---|---|---|
| Filename | modeM0/AS1C07_009T01_9000005200cztM0_level2.fits | modeM0/AS1C07_009T01_9000005200cztM0_level2_quad_clean.evt |
| Size (bytes) | 1,307,047,680 | 1,564,617,600 |
| Size | 1.2 GB | 1.5 GB |
| Events in quadrant A | 8,056,930 | 10,046,475 |
| Events in quadrant B | 7,470,390 | 9,711,114 |
| Events in quadrant C | 7,721,668 | 9,394,610 |
| Events in quadrant D | 6,757,102 | 8,661,831 |
| Mode M0 | |||
|---|---|---|---|
| Quadrant | BADHDUFLAG | Total packets | Discarded packets |
| A | 0 | 289170 | 0 |
| B | 0 | 365364 | 0 |
| C | 0 | 303654 | 0 |
| D | 0 | 333384 | 0 |
| Mode SS | |||
|---|---|---|---|
| Quadrant | BADHDUFLAG | Total packets | Discarded packets |
| A | 0 | 2858 | 0 |
| B | 0 | 2858 | 0 |
| C | 0 | 2858 | 0 |
| D | 0 | 2858 | 0 |
| Mode M9 | |||
|---|---|---|---|
| Quadrant | BADHDUFLAG | Total packets | Discarded packets |
| A | 0 | 532 | 0 |
| B | 0 | 532 | 0 |
| C | 0 | 532 | 0 |
| D | 0 | 532 | 0 |
| Quadrant | Total seconds | Saturated seconds | Saturation percentage |
|---|---|---|---|
| A | 139759 | 256 | 0.183172% |
| B | 139759 | 5859 | 4.192217% |
| C | 139759 | 1728 | 1.236414% |
| D | 139759 | 2558 | 1.830294% |
Noise dominated data is calculated using 1-second bins in cleaned event files. If a bin has >2000 counts, and if more than 50% of those come from <1% of pixels, then it is considered to be noise-dominated and hence unusable.
| Quadrant | # 1 sec bins | Bins with >0 counts | Bins with >2000 counts | High rate bins dominated by noise | Noise dominated (total time) | Noise dominated (detector-on time) | Marked lightcurve |
|---|---|---|---|---|---|---|---|
| A | 192990 | 139760 | 0 | 0 | 0.00% | 0.00% | 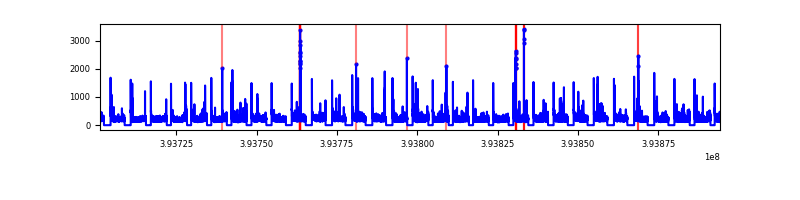 |
| B | 192990 | 139668 | 0 | 0 | 0.00% | 0.00% | 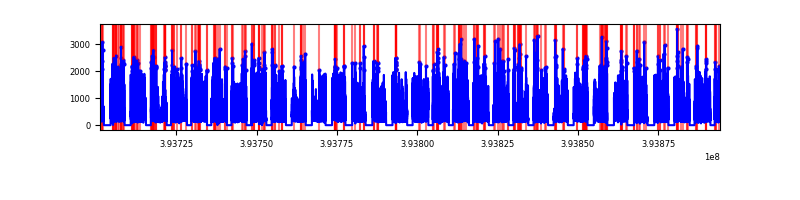 |
| C | 192990 | 139753 | 0 | 0 | 0.00% | 0.00% |  |
| D | 192990 | 139742 | 0 | 0 | 0.00% | 0.00% | 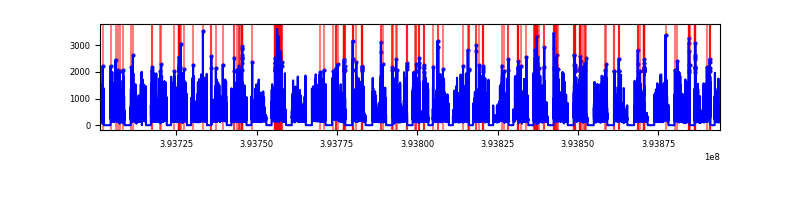 |
Top three noisy pixels from each quadrant. If the there are fewer than three noisy pixels in the level2.evt file, extra rows are filled as -1
| Pixel properties | Quadrant properties | ||||||
|---|---|---|---|---|---|---|---|
| Quadrant | DetID | PixID | Counts | Sigma | Mean | Median | Sigma |
| A | 7 | 110 | 6672 | 9.26 | 2103 | 1984 | 506.2 |
| A | 9 | 19 | 6556 | 9.03 | 2103 | 1984 | 506.2 |
| A | 0 | 29 | 6555 | 9.03 | 2103 | 1984 | 506.2 |
| B | 2 | 9 | 6535 | 12.16 | 1981 | 1902 | 380.9 |
| B | 3 | 80 | 5671 | 9.9 | 1981 | 1902 | 380.9 |
| B | 2 | 8 | 5192 | 8.64 | 1981 | 1902 | 380.9 |
| C | 1 | 81 | 6664 | 9.13 | 2042 | 1923 | 519.1 |
| C | 1 | 80 | 6432 | 8.69 | 2042 | 1923 | 519.1 |
| C | 3 | 202 | 6153 | 8.15 | 2042 | 1923 | 519.1 |
| D | 10 | 189 | 5040 | 6.35 | 1939 | 1771 | 514.7 |
| D | 10 | 113 | 5003 | 6.28 | 1939 | 1771 | 514.7 |
| D | 4 | 160 | 4930 | 6.14 | 1939 | 1771 | 514.7 |
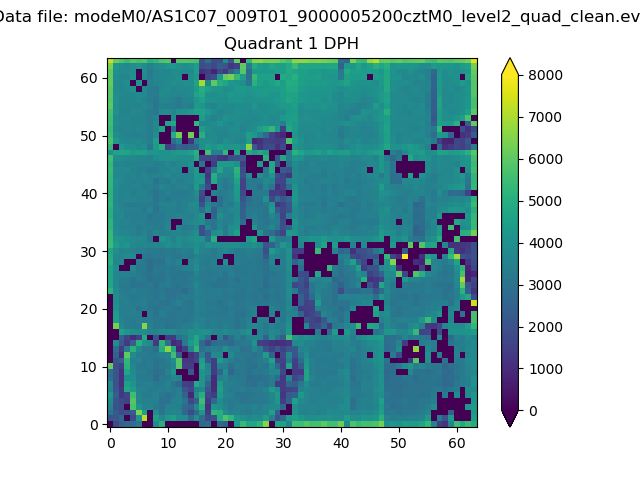
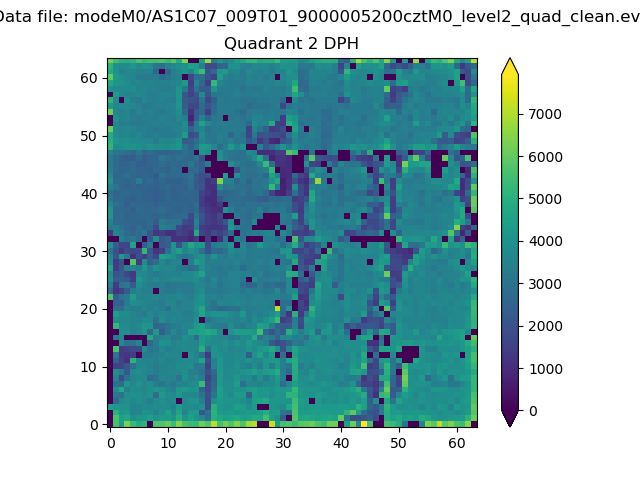
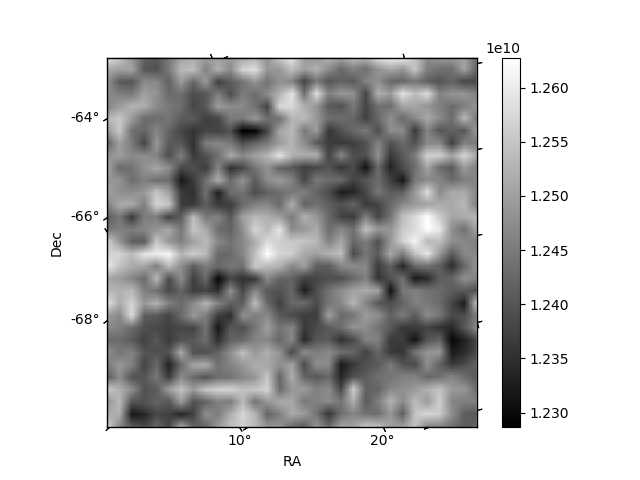
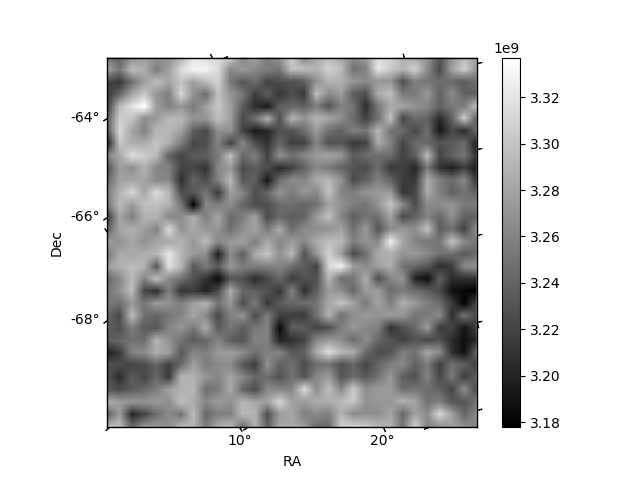
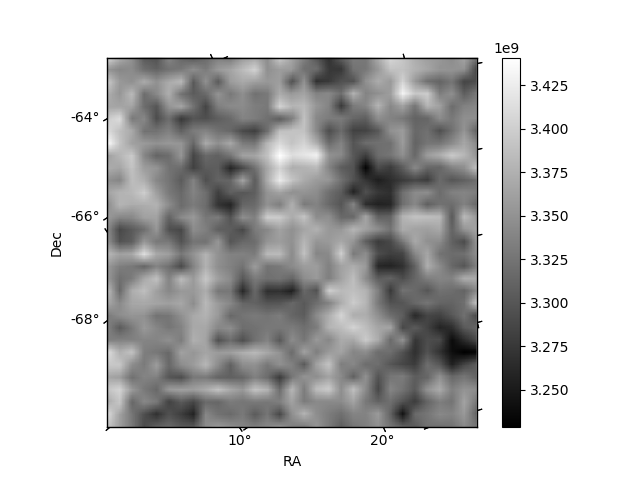
Histogram calculated using DETX and DETY for each event in the final _common_clean file
| Quadrant A | 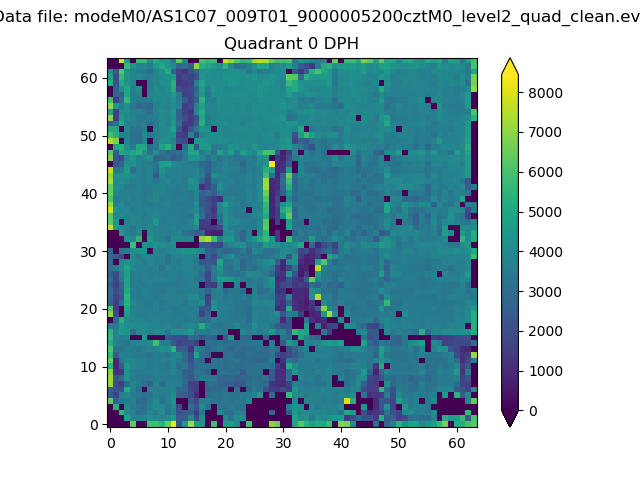 |
 |
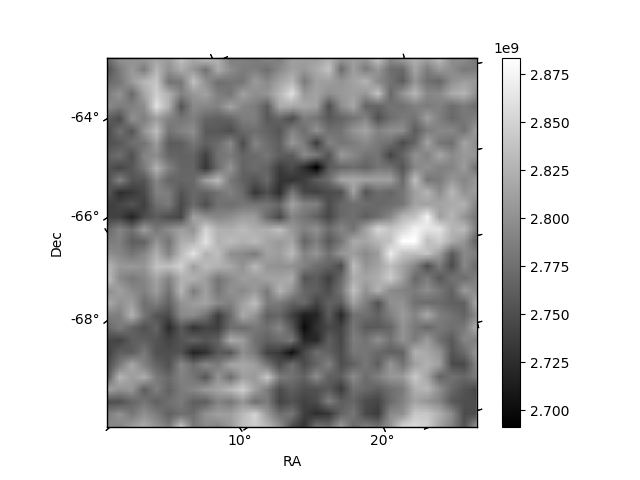
Quadrant B |
|---|---|---|---|
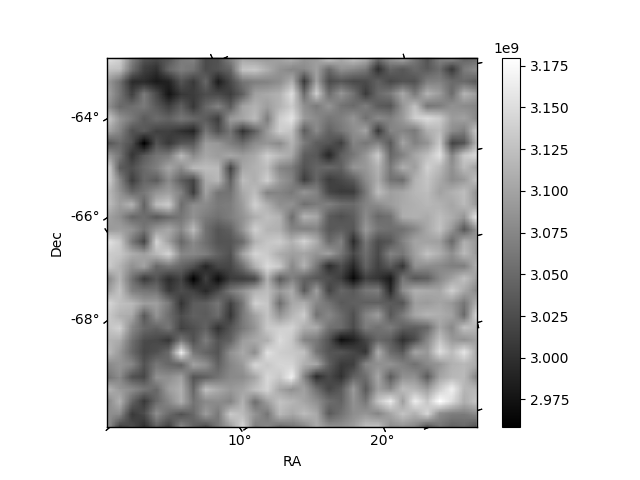
| Quadrant D | 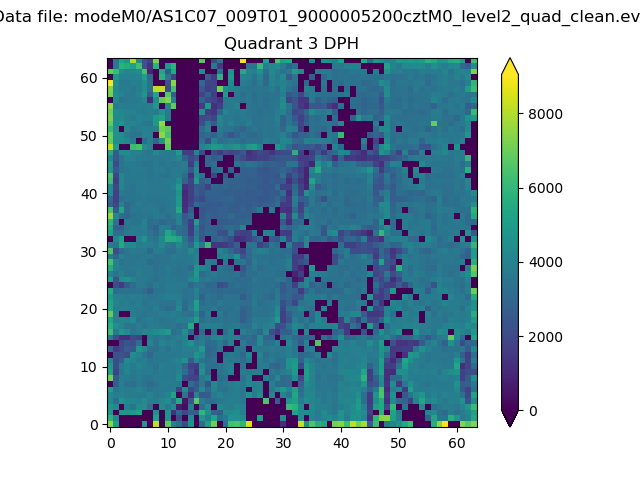 |
 |
Quadrant C |
| Plot type | Count rate plots | Images |
|---|---|---|
| Comparison with Poisson distribution Blue bars denote a histogram of data divided into 1 sec bins. Red curve is a Poisson curve with rate = median count rate of data. |
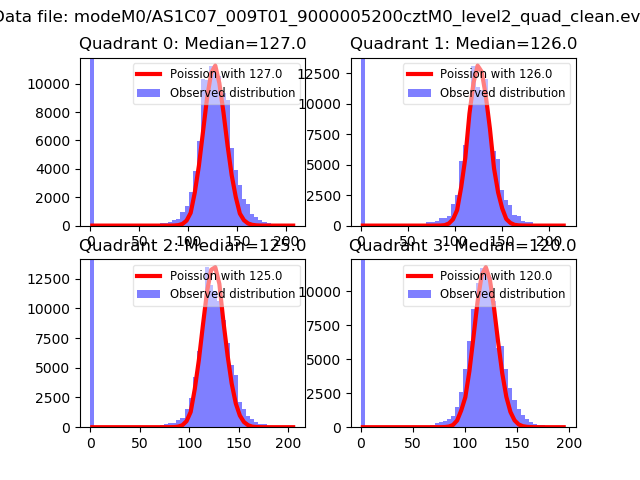 |
 |
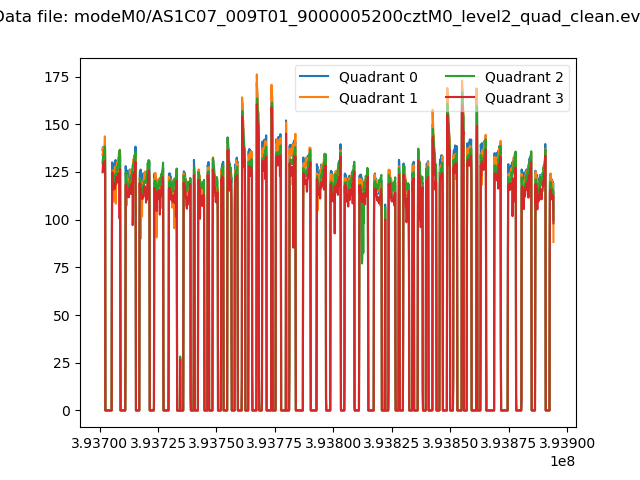
| Quadrant-wise count rates Data is divided into 100 sec bins |
 |
|
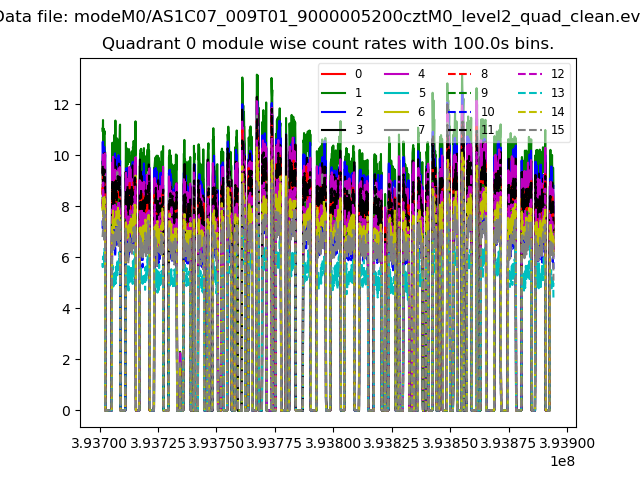
| Module-wise count rates for Quadrant A Data is divided into 100 sec bins |
 |
 |
| Module-wise count rates for Quadrant B Data is divided into 100 sec bins |
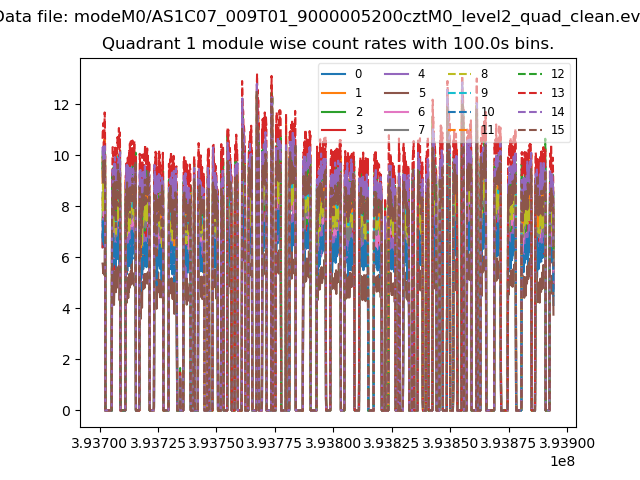 |
 |
| Module-wise count rates for Quadrant C Data is divided into 100 sec bins |
 |
 |
| Module-wise count rates for Quadrant D Data is divided into 100 sec bins |
 |
 |
| Parameter | Plot |
|---|---|
| CZT HV Monitor |  |
| D_VDD | 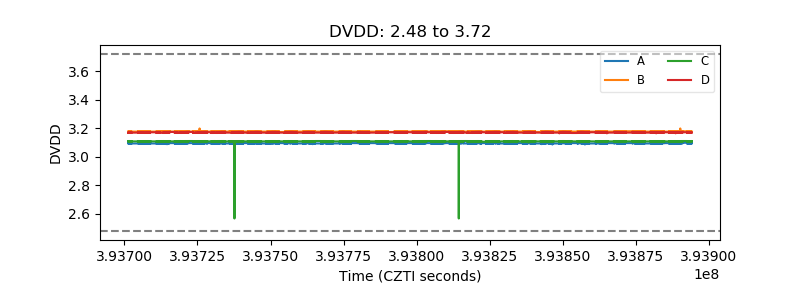 |
| Temperature 1 | 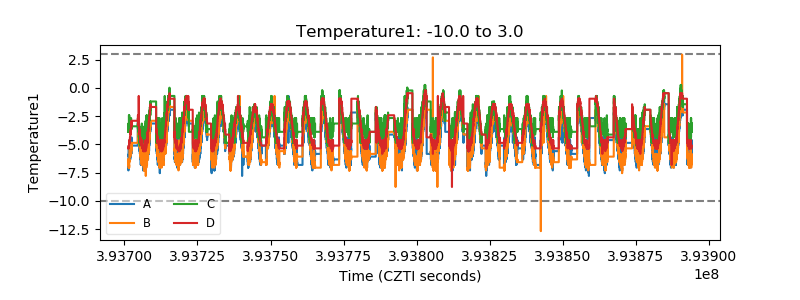 |
| Veto HV Monitor |  |
| Veto LLD |  |
| Alpha Counter |  |
| _CPM_Rate | 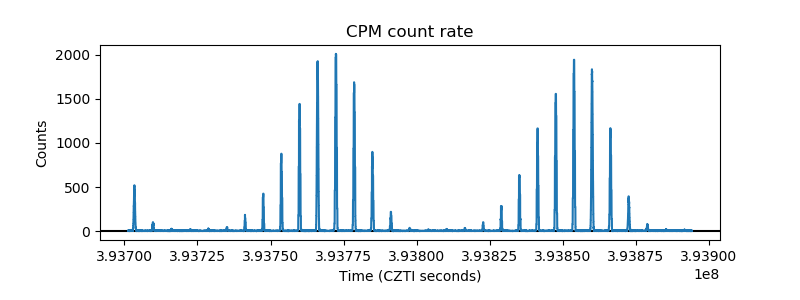 |
| CZT Counter | 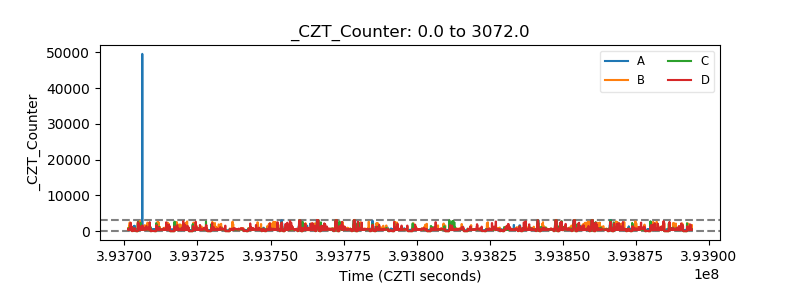 |
| +2.5 Volts monitor | 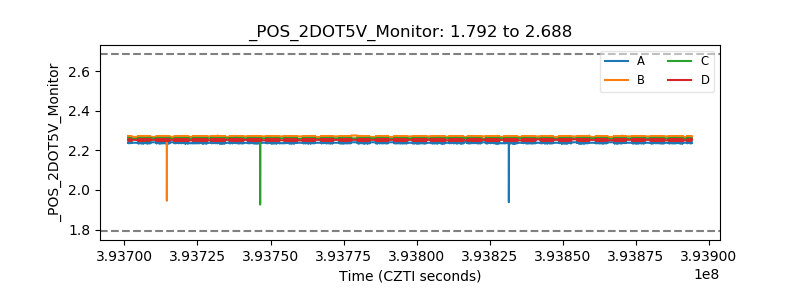 |
| +5 Volts monitor |  |
| _ROLL_ROT | 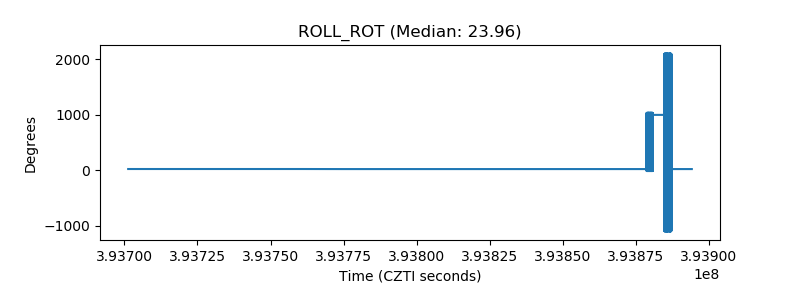 |
| _Roll_DEC | 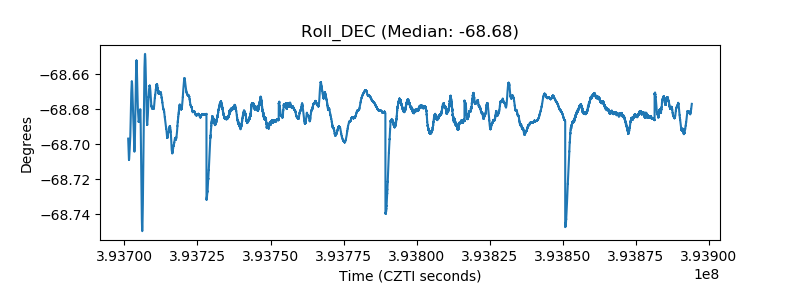 |
| _Roll_RA | 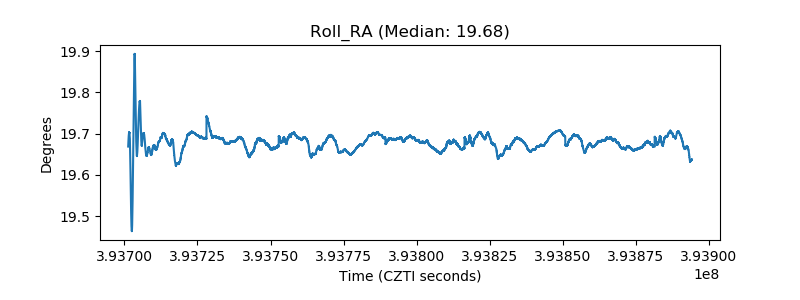 |
| Veto Counter | 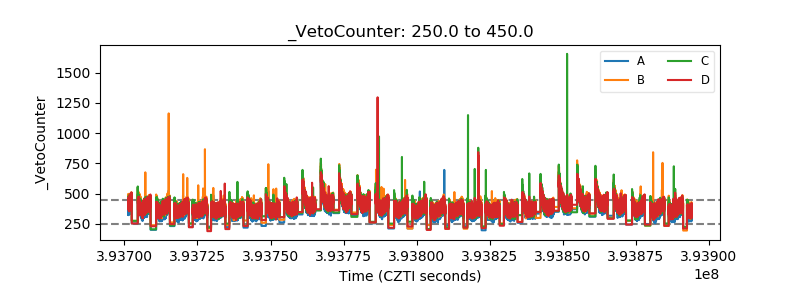 |