| Param | Original file | Final file |
|---|---|---|
| Filename | modeM0/AS1C07_009T01_9000005200_36447cztM0_level2.evt | modeM0/AS1C07_009T01_9000005200_36447cztM0_level2_quad_clean.evt |
| Size (bytes) | 407,373,120 | 79,087,680 |
| Size | 388.5 MB | 75.4 MB |
| Events in quadrant A | 2,567,468 | 519,995 |
| Events in quadrant B | 3,305,043 | 515,435 |
| Events in quadrant C | 2,968,168 | 510,605 |
| Events in quadrant D | 3,145,824 | 487,089 |
| Mode M0 | |||
|---|---|---|---|
| Quadrant | BADHDUFLAG | Total packets | Discarded packets |
| A | 0 | 10811 | 2 |
| B | 0 | 13211 | 1 |
| C | 0 | 11945 | 1 |
| D | 0 | 12785 | 1 |
| Mode SS | |||
|---|---|---|---|
| Quadrant | BADHDUFLAG | Total packets | Discarded packets |
| A | 0 | 106 | 0 |
| B | 0 | 106 | 0 |
| C | 0 | 106 | 0 |
| D | 0 | 106 | 0 |
| Mode M9 | |||
|---|---|---|---|
| Quadrant | BADHDUFLAG | Total packets | Discarded packets |
| A | 0 | 18 | 0 |
| B | 0 | 18 | 0 |
| C | 0 | 18 | 0 |
| D | 0 | 18 | 0 |
| Quadrant | Total seconds | Saturated seconds | Saturation percentage |
|---|---|---|---|
| A | 5160 | 4 | 0.077519% |
| B | 5160 | 90 | 1.744186% |
| C | 5160 | 55 | 1.065891% |
| D | 5160 | 136 | 2.635659% |
Noise dominated data is calculated using 1-second bins in cleaned event files. If a bin has >2000 counts, and if more than 50% of those come from <1% of pixels, then it is considered to be noise-dominated and hence unusable.
| Quadrant | # 1 sec bins | Bins with >0 counts | Bins with >2000 counts | High rate bins dominated by noise | Noise dominated (total time) | Noise dominated (detector-on time) | Marked lightcurve |
|---|---|---|---|---|---|---|---|
| A | 7012 | 5161 | 0 | 0 | 0.00% | 0.00% | 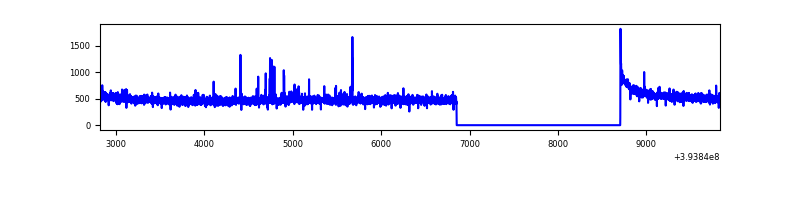 |
| B | 7012 | 5161 | 53 | 53 | 0.76% | 1.03% | 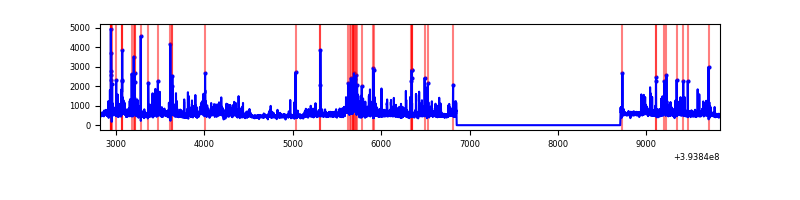 |
| C | 7012 | 5161 | 39 | 39 | 0.56% | 0.76% | 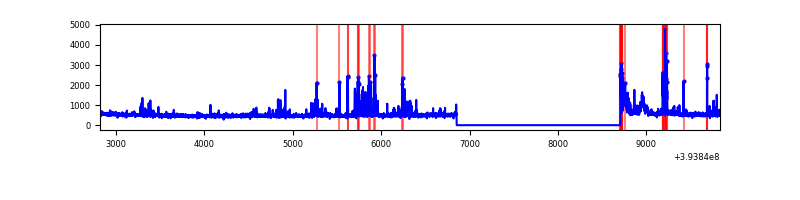 |
| D | 7012 | 5161 | 100 | 100 | 1.43% | 1.94% | 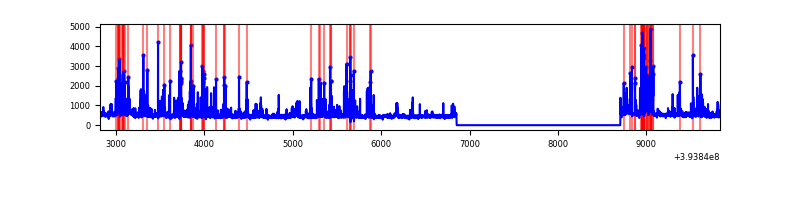 |
Top three noisy pixels from each quadrant. If the there are fewer than three noisy pixels in the level2.evt file, extra rows are filled as -1
| Pixel properties | Quadrant properties | ||||||
|---|---|---|---|---|---|---|---|
| Quadrant | DetID | PixID | Counts | Sigma | Mean | Median | Sigma |
| A | 10 | 83 | 143204 | 1149.73 | 616 | 605 | 124.0 |
| A | 9 | 143 | 31548 | 249.48 | 616 | 605 | 124.0 |
| A | 13 | 254 | 8690 | 65.19 | 616 | 605 | 124.0 |
| B | 5 | 255 | 346445 | 3058.42 | 598 | 583 | 113.1 |
| B | 5 | 172 | 217192 | 1915.45 | 598 | 583 | 113.1 |
| B | 0 | 189 | 106732 | 938.67 | 598 | 583 | 113.1 |
| C | 0 | 207 | 330893 | 2454.74 | 587 | 591 | 134.6 |
| C | 15 | 214 | 220050 | 1630.97 | 587 | 591 | 134.6 |
| C | 0 | 10 | 117634 | 869.84 | 587 | 591 | 134.6 |
| D | 12 | 6 | 274950 | 1936.4 | 593 | 578 | 141.7 |
| D | 13 | 171 | 181133 | 1274.28 | 593 | 578 | 141.7 |
| D | 2 | 250 | 112045 | 786.69 | 593 | 578 | 141.7 |
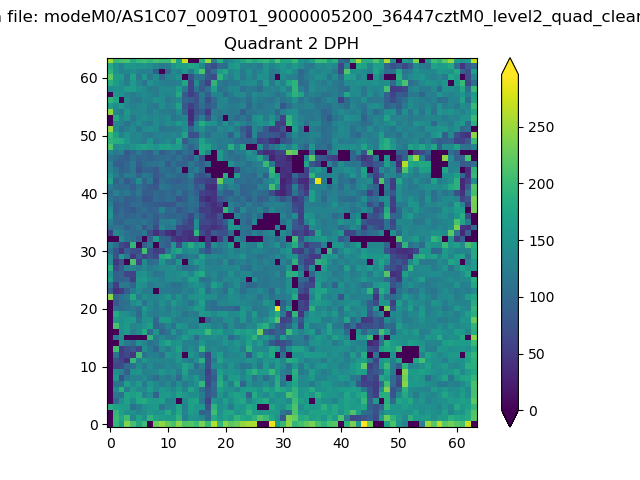
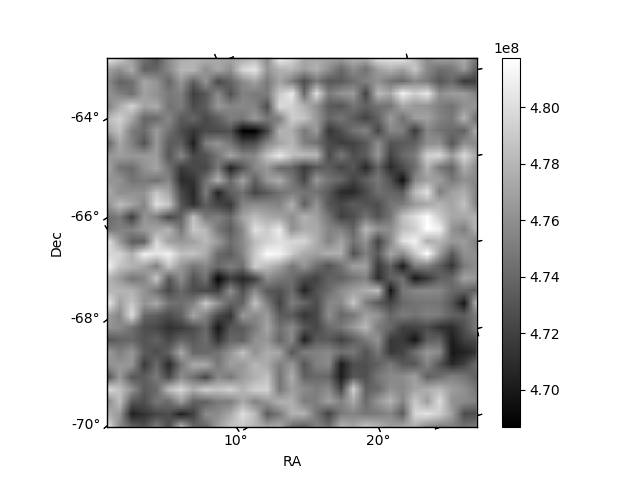
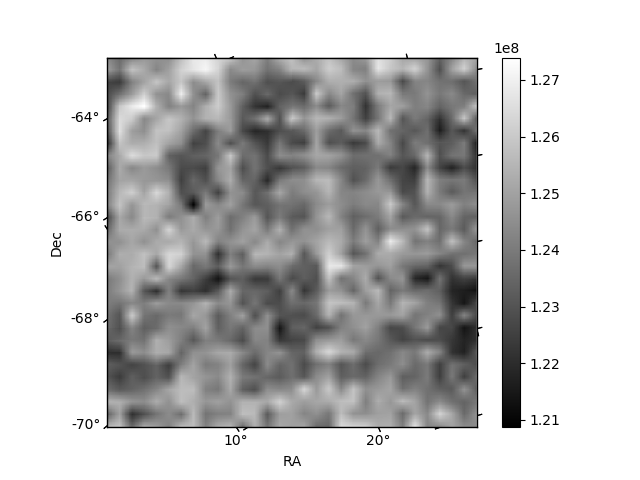
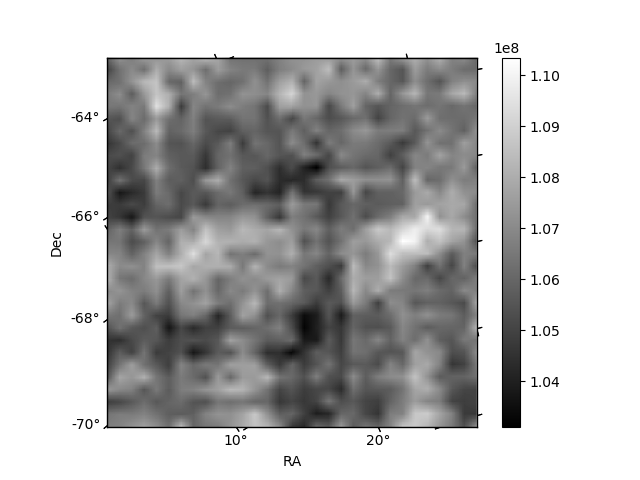
Histogram calculated using DETX and DETY for each event in the final _common_clean file
| Quadrant A | 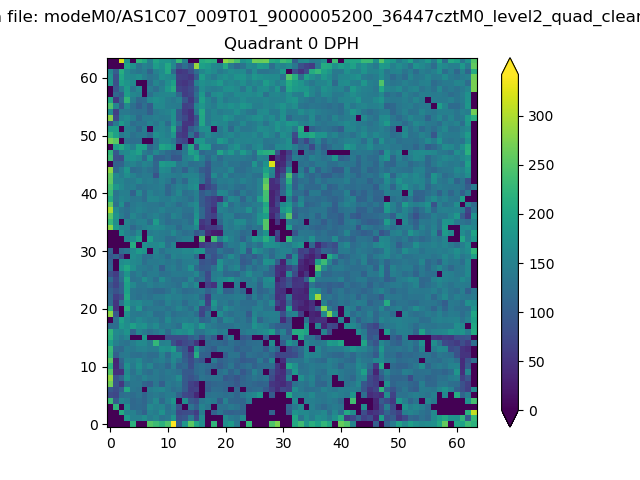 |
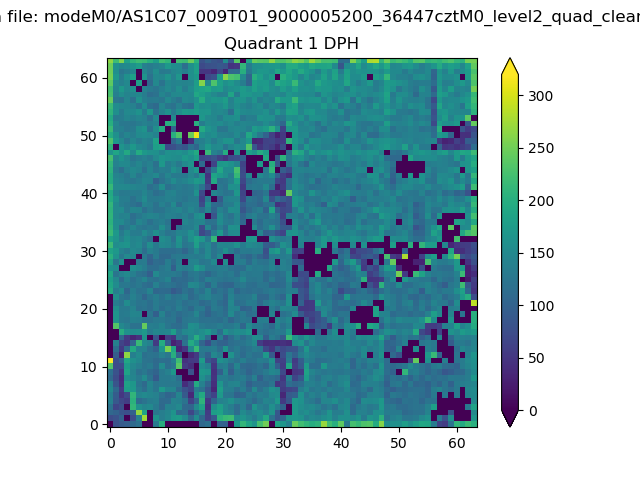 |
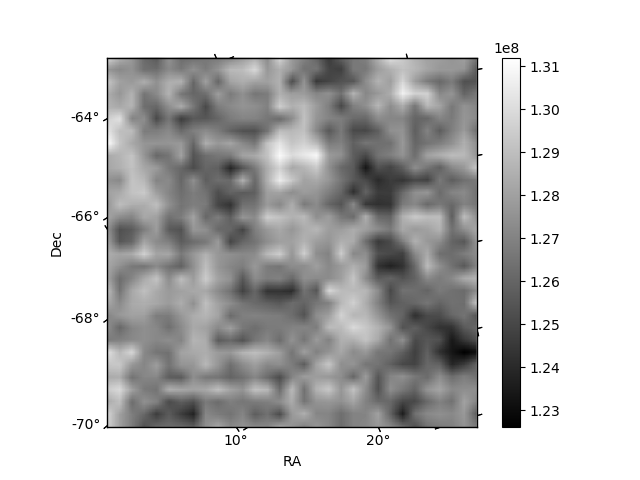
Quadrant B |
|---|---|---|---|
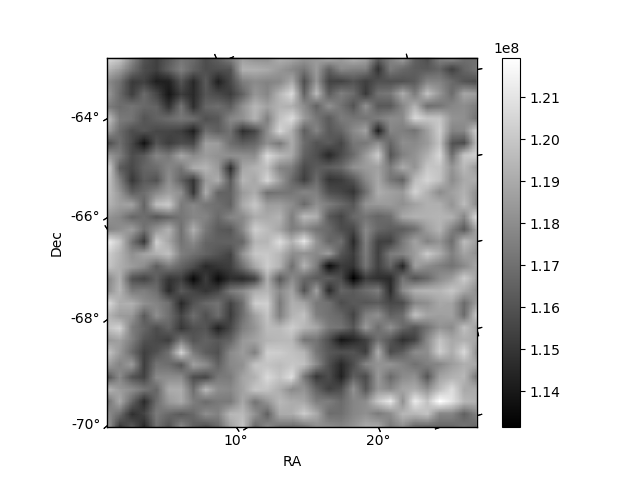
| Quadrant D | 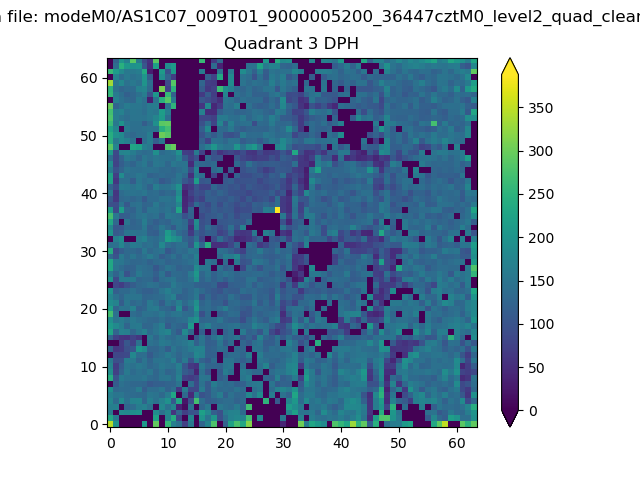 |
 |
Quadrant C |
| Plot type | Count rate plots | Images |
|---|---|---|
| Comparison with Poisson distribution Blue bars denote a histogram of data divided into 1 sec bins. Red curve is a Poisson curve with rate = median count rate of data. |
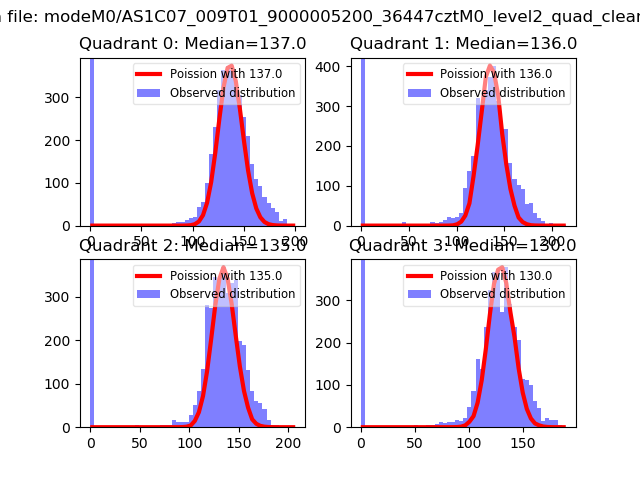 |
 |
| Quadrant-wise count rates Data is divided into 100 sec bins |
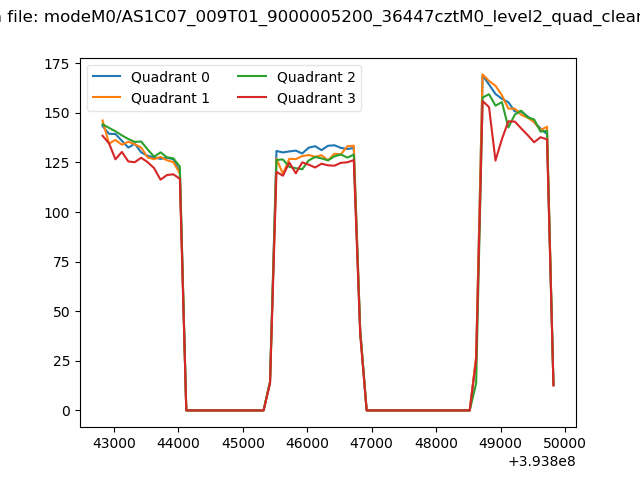 |
|
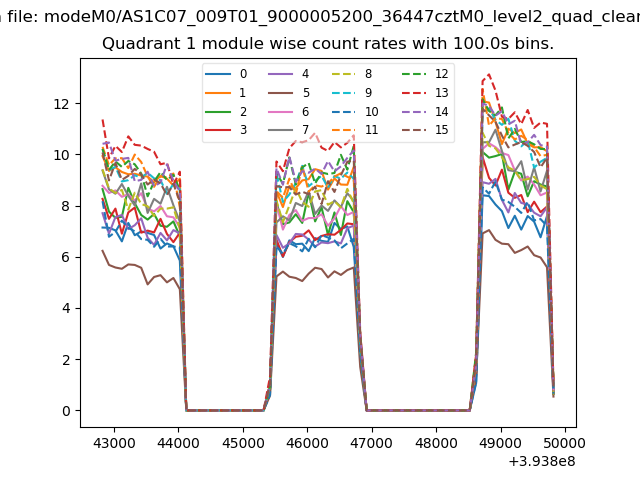
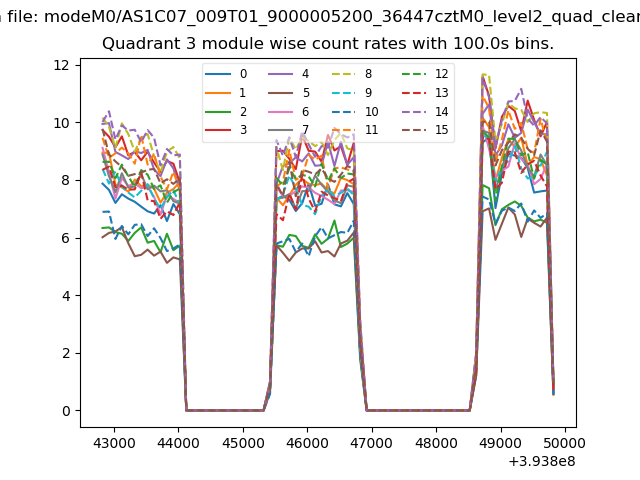
| Module-wise count rates for Quadrant A Data is divided into 100 sec bins |
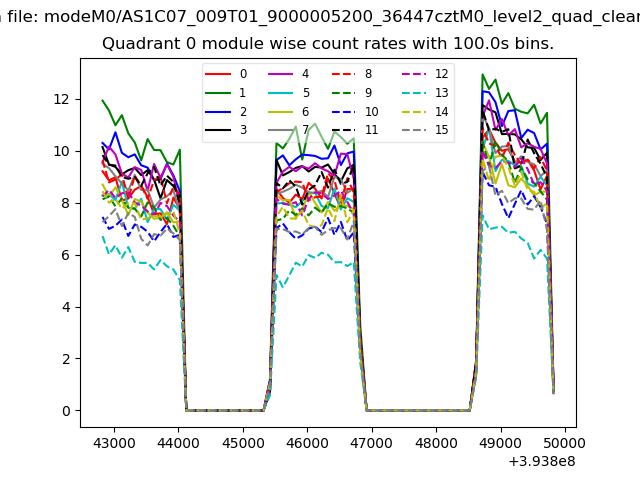 |
 |
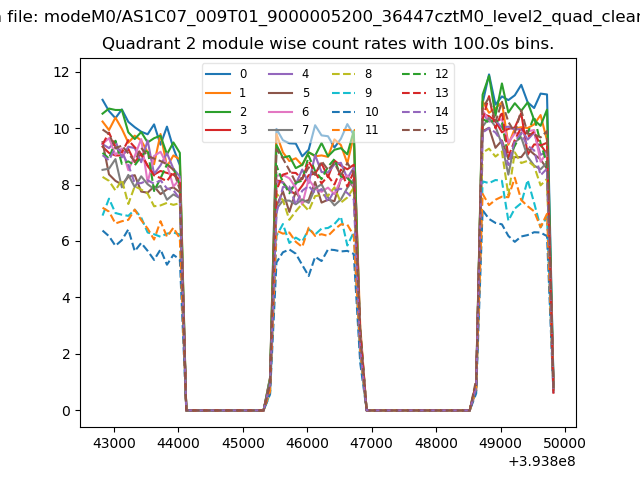
| Module-wise count rates for Quadrant B Data is divided into 100 sec bins |
 |
 |
| Module-wise count rates for Quadrant C Data is divided into 100 sec bins |
 |
 |
| Module-wise count rates for Quadrant D Data is divided into 100 sec bins |
 |
 |
| Parameter | Plot |
|---|---|
| CZT HV Monitor | 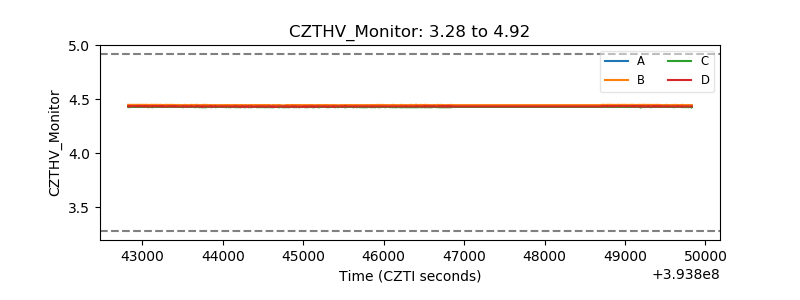 |
| D_VDD | 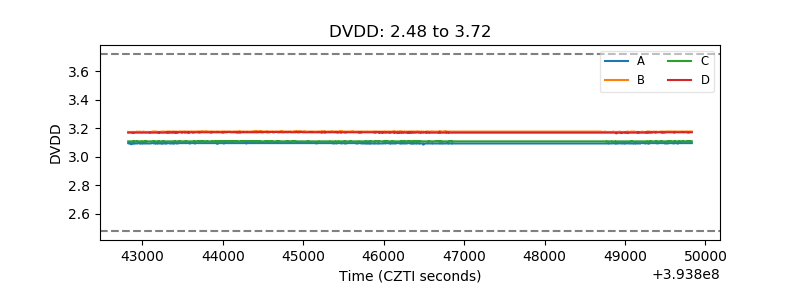 |
| Temperature 1 | 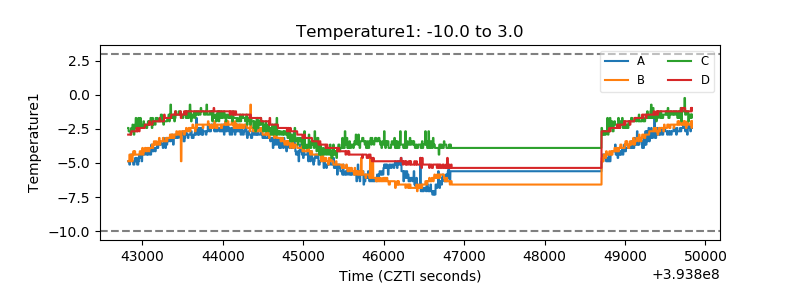 |
| Veto HV Monitor | 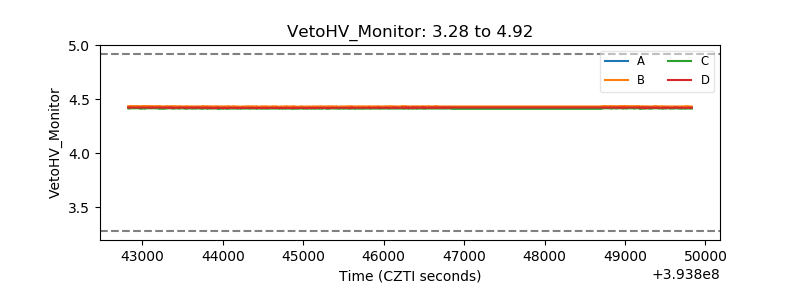 |
| Veto LLD | 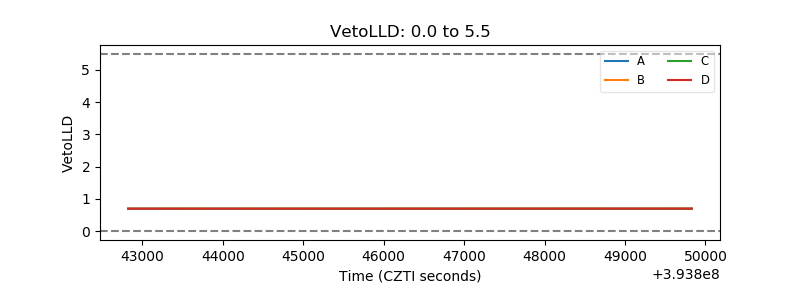 |
| Alpha Counter | 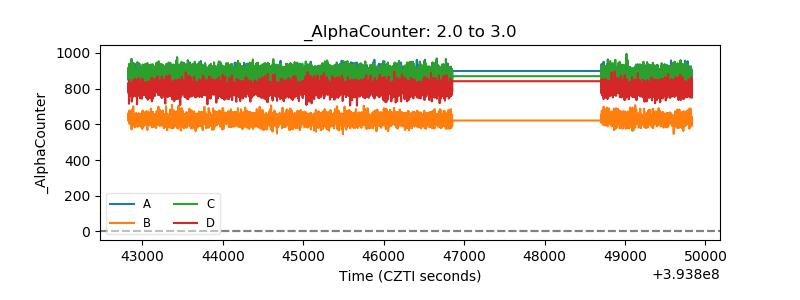 |
| _CPM_Rate | 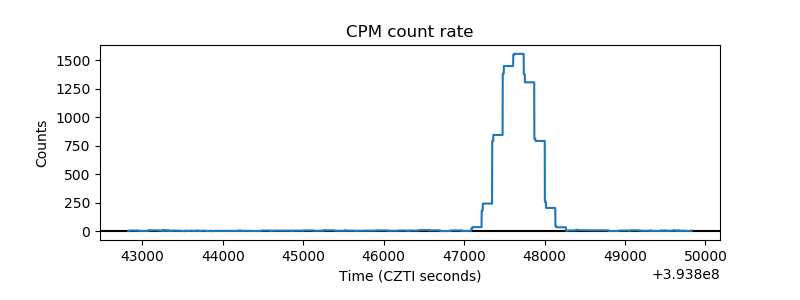 |
| CZT Counter | 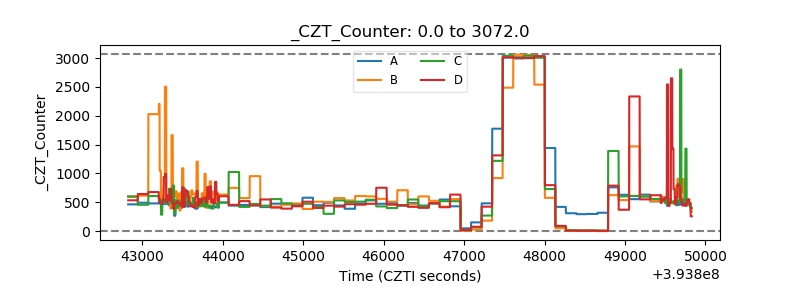 |
| +2.5 Volts monitor | 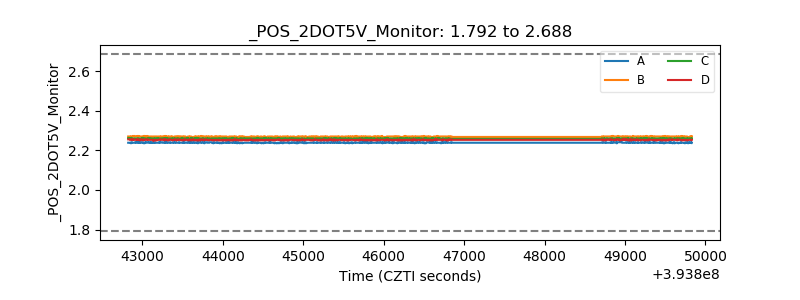 |
| +5 Volts monitor |  |
| _ROLL_ROT | 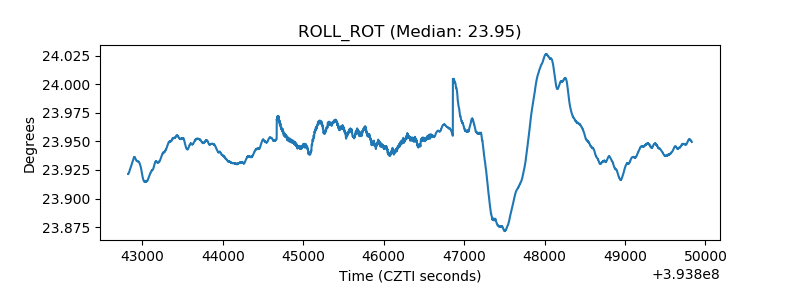 |
| _Roll_DEC | 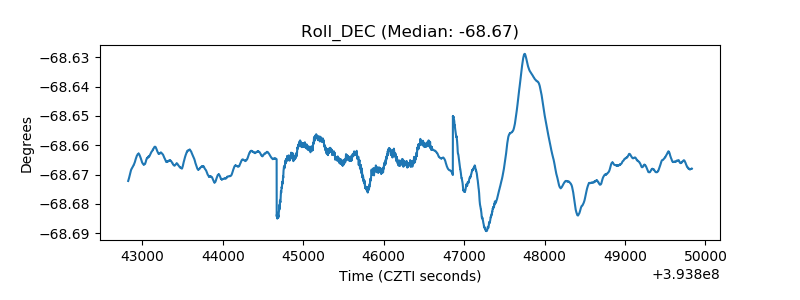 |
| _Roll_RA | 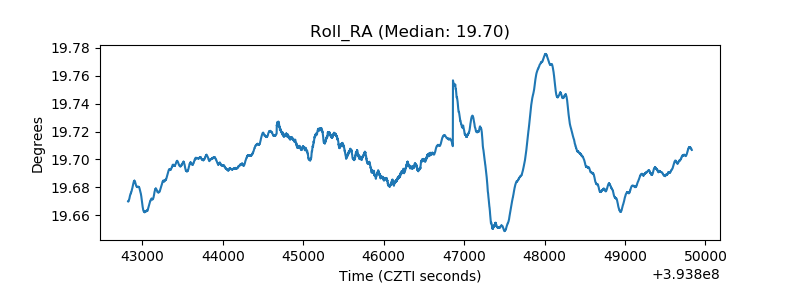 |
| Veto Counter | 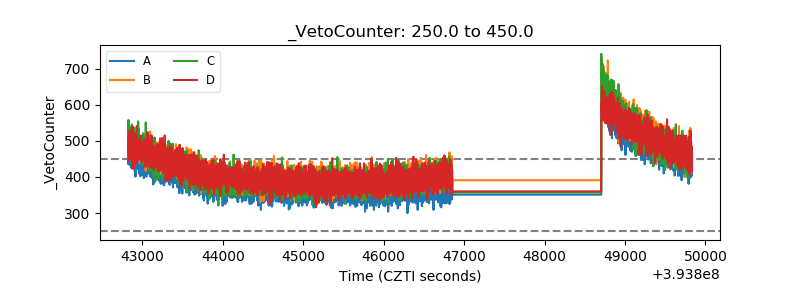 |