| Param | Original file | Final file |
|---|---|---|
| Filename | modeM0/AS1A11_003T08_9000005202cztM0_level2.fits | modeM0/AS1A11_003T08_9000005202cztM0_level2_quad_clean.evt |
| Size (bytes) | 268,822,080 | 282,072,960 |
| Size | 256.4 MB | 269.0 MB |
| Events in quadrant A | 1,648,972 | 1,739,862 |
| Events in quadrant B | 1,540,862 | 1,686,314 |
| Events in quadrant C | 1,582,280 | 1,632,850 |
| Events in quadrant D | 1,394,172 | 1,508,312 |
| Mode SS | |||
|---|---|---|---|
| Quadrant | BADHDUFLAG | Total packets | Discarded packets |
| A | 0 | 588 | 0 |
| B | 0 | 588 | 0 |
| C | 0 | 588 | 0 |
| D | 0 | 588 | 0 |
| Mode M9 | |||
|---|---|---|---|
| Quadrant | BADHDUFLAG | Total packets | Discarded packets |
| A | 0 | 91 | 0 |
| B | 0 | 91 | 0 |
| C | 0 | 91 | 0 |
| D | 0 | 91 | 0 |
| Mode M0 | |||
|---|---|---|---|
| Quadrant | BADHDUFLAG | Total packets | Discarded packets |
| A | 0 | 59368 | 0 |
| B | 0 | 69976 | 0 |
| C | 0 | 61075 | 0 |
| D | 0 | 64538 | 0 |
| Quadrant | Total seconds | Saturated seconds | Saturation percentage |
|---|---|---|---|
| A | 28726 | 64 | 0.222795% |
| B | 28726 | 883 | 3.073870% |
| C | 28726 | 202 | 0.703196% |
| D | 28726 | 270 | 0.939915% |
Noise dominated data is calculated using 1-second bins in cleaned event files. If a bin has >2000 counts, and if more than 50% of those come from <1% of pixels, then it is considered to be noise-dominated and hence unusable.
| Quadrant | # 1 sec bins | Bins with >0 counts | Bins with >2000 counts | High rate bins dominated by noise | Noise dominated (total time) | Noise dominated (detector-on time) | Marked lightcurve |
|---|---|---|---|---|---|---|---|
| A | 37859 | 28726 | 0 | 0 | 0.00% | 0.00% |  |
| B | 37859 | 28724 | 0 | 0 | 0.00% | 0.00% |  |
| C | 37859 | 28725 | 0 | 0 | 0.00% | 0.00% |  |
| D | 37859 | 28723 | 0 | 0 | 0.00% | 0.00% |  |
Top three noisy pixels from each quadrant. If the there are fewer than three noisy pixels in the level2.evt file, extra rows are filled as -1
| Pixel properties | Quadrant properties | ||||||
|---|---|---|---|---|---|---|---|
| Quadrant | DetID | PixID | Counts | Sigma | Mean | Median | Sigma |
| A | 9 | 19 | 1344 | 8.69 | 430 | 403 | 108.3 |
| A | 0 | 29 | 1341 | 8.66 | 430 | 403 | 108.3 |
| A | 7 | 110 | 1328 | 8.54 | 430 | 403 | 108.3 |
| B | 2 | 9 | 1369 | 12.13 | 407 | 389 | 80.8 |
| B | 3 | 80 | 1205 | 10.1 | 407 | 389 | 80.8 |
| B | 2 | 8 | 1129 | 9.16 | 407 | 389 | 80.8 |
| C | 1 | 81 | 1336 | 8.68 | 419 | 391 | 108.8 |
| C | 1 | 80 | 1290 | 8.26 | 419 | 391 | 108.8 |
| C | 3 | 187 | 1080 | 6.33 | 419 | 391 | 108.8 |
| D | 7 | 3 | 1054 | 6.44 | 399 | 364 | 107.1 |
| D | 6 | 38 | 1022 | 6.14 | 399 | 364 | 107.1 |
| D | 6 | 231 | 1007 | 6.0 | 399 | 364 | 107.1 |
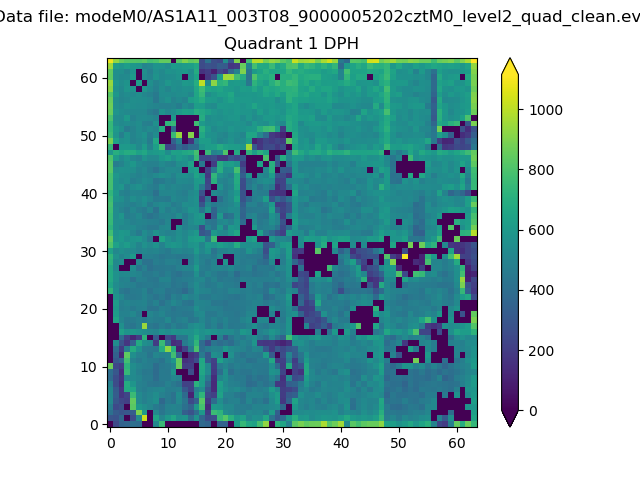
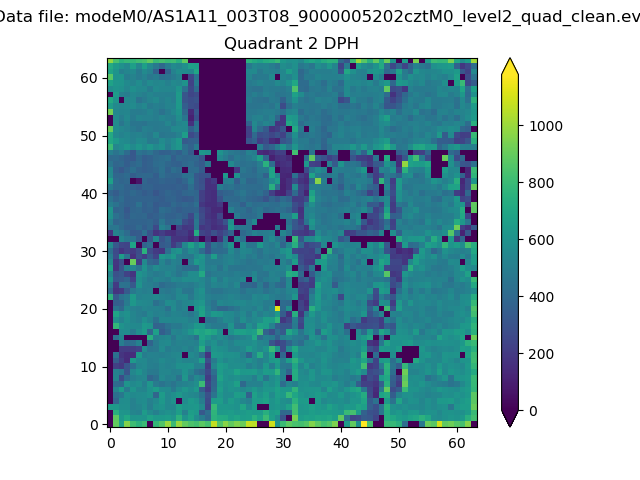
Histogram calculated using DETX and DETY for each event in the final _common_clean file
| Quadrant A |  |
 |
Quadrant B |
|---|---|---|---|
| Quadrant D | 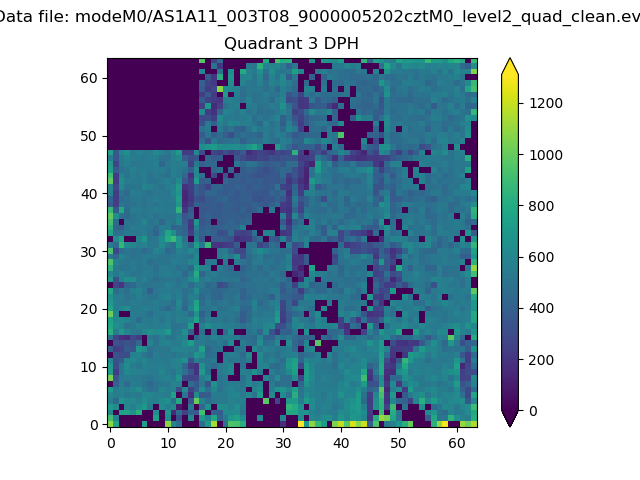 |
 |
Quadrant C |
| Plot type | Count rate plots | Images |
|---|---|---|
| Comparison with Poisson distribution Blue bars denote a histogram of data divided into 1 sec bins. Red curve is a Poisson curve with rate = median count rate of data. |
 |
 |
| Quadrant-wise count rates Data is divided into 100 sec bins |
 |
|
| Module-wise count rates for Quadrant A Data is divided into 100 sec bins |
 |
 |
| Module-wise count rates for Quadrant B Data is divided into 100 sec bins |
 |
 |
| Module-wise count rates for Quadrant C Data is divided into 100 sec bins |
 |
 |
| Module-wise count rates for Quadrant D Data is divided into 100 sec bins |
 |
 |
| Parameter | Plot |
|---|---|
| CZT HV Monitor |  |
| D_VDD | 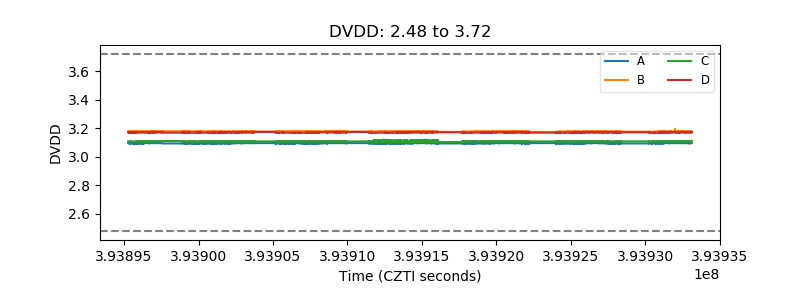 |
| Temperature 1 |  |
| Veto HV Monitor |  |
| Veto LLD |  |
| Alpha Counter |  |
| _CPM_Rate |  |
| CZT Counter |  |
| +2.5 Volts monitor |  |
| +5 Volts monitor |  |
| _ROLL_ROT |  |
| _Roll_DEC |  |
| _Roll_RA |  |
| Veto Counter |  |