| Param | Original file | Final file |
|---|---|---|
| Filename | modeM0/AS1A11_049T02_9000005206cztM0_level2.fits | modeM0/AS1A11_049T02_9000005206cztM0_level2_quad_clean.evt |
| Size (bytes) | 434,655,360 | 448,934,400 |
| Size | 414.5 MB | 428.1 MB |
| Events in quadrant A | 2,658,798 | 2,766,493 |
| Events in quadrant B | 2,486,304 | 2,659,994 |
| Events in quadrant C | 2,568,272 | 2,577,593 |
| Events in quadrant D | 2,216,812 | 2,358,848 |
| Mode M0 | |||
|---|---|---|---|
| Quadrant | BADHDUFLAG | Total packets | Discarded packets |
| A | 0 | 96712 | 0 |
| B | 0 | 110340 | 0 |
| C | 0 | 102031 | 0 |
| D | 0 | 117131 | 0 |
| Mode SS | |||
|---|---|---|---|
| Quadrant | BADHDUFLAG | Total packets | Discarded packets |
| A | 0 | 962 | 0 |
| B | 0 | 962 | 0 |
| C | 0 | 962 | 0 |
| D | 0 | 962 | 0 |
| Mode M9 | |||
|---|---|---|---|
| Quadrant | BADHDUFLAG | Total packets | Discarded packets |
| A | 0 | 161 | 0 |
| B | 0 | 161 | 0 |
| C | 0 | 161 | 0 |
| D | 0 | 161 | 0 |
| Quadrant | Total seconds | Saturated seconds | Saturation percentage |
|---|---|---|---|
| A | 47108 | 50 | 0.106139% |
| B | 47106 | 1091 | 2.316053% |
| C | 47108 | 465 | 0.987093% |
| D | 47108 | 1419 | 3.012227% |
Noise dominated data is calculated using 1-second bins in cleaned event files. If a bin has >2000 counts, and if more than 50% of those come from <1% of pixels, then it is considered to be noise-dominated and hence unusable.
| Quadrant | # 1 sec bins | Bins with >0 counts | Bins with >2000 counts | High rate bins dominated by noise | Noise dominated (total time) | Noise dominated (detector-on time) | Marked lightcurve |
|---|---|---|---|---|---|---|---|
| A | 63204 | 47108 | 0 | 0 | 0.00% | 0.00% |  |
| B | 63204 | 47099 | 0 | 0 | 0.00% | 0.00% | 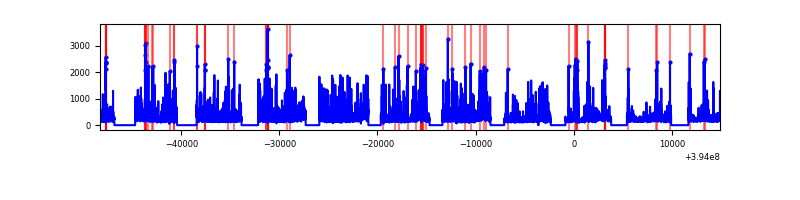 |
| C | 63204 | 47095 | 0 | 0 | 0.00% | 0.00% |  |
| D | 63204 | 47102 | 0 | 0 | 0.00% | 0.00% | 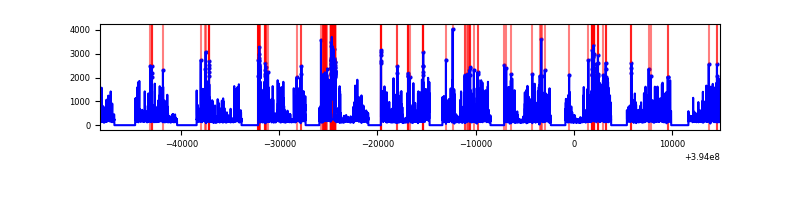 |
Top three noisy pixels from each quadrant. If the there are fewer than three noisy pixels in the level2.evt file, extra rows are filled as -1
| Pixel properties | Quadrant properties | ||||||
|---|---|---|---|---|---|---|---|
| Quadrant | DetID | PixID | Counts | Sigma | Mean | Median | Sigma |
| A | 7 | 110 | 2174 | 8.83 | 693 | 651 | 172.5 |
| A | 9 | 19 | 2148 | 8.68 | 693 | 651 | 172.5 |
| A | 0 | 29 | 2125 | 8.54 | 693 | 651 | 172.5 |
| B | 2 | 9 | 2244 | 12.47 | 658 | 629 | 129.5 |
| B | 3 | 80 | 1902 | 9.83 | 658 | 629 | 129.5 |
| B | 2 | 8 | 1777 | 8.86 | 658 | 629 | 129.5 |
| C | 1 | 81 | 2171 | 8.79 | 678 | 635 | 174.8 |
| C | 3 | 203 | 2081 | 8.27 | 678 | 635 | 174.8 |
| C | 1 | 80 | 2074 | 8.23 | 678 | 635 | 174.8 |
| D | 7 | 3 | 1705 | 6.7 | 635 | 582 | 167.6 |
| D | 10 | 189 | 1648 | 6.36 | 635 | 582 | 167.6 |
| D | 10 | 113 | 1616 | 6.17 | 635 | 582 | 167.6 |
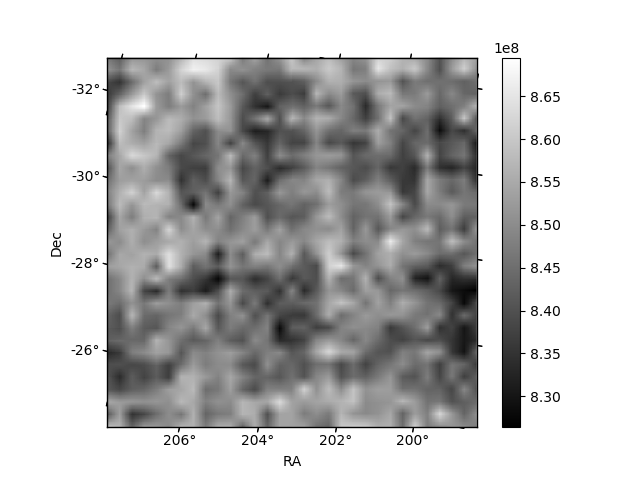
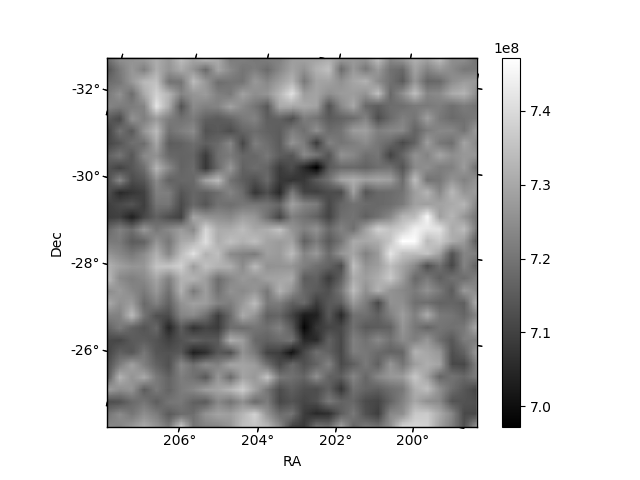
Histogram calculated using DETX and DETY for each event in the final _common_clean file
| Quadrant A | 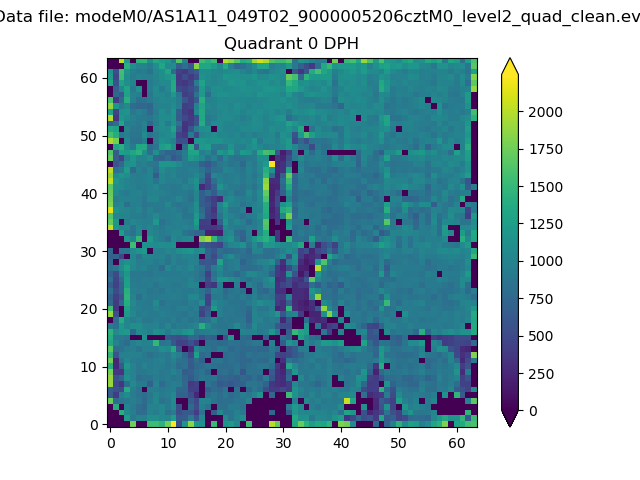 |
 |
Quadrant B |
|---|---|---|---|
| Quadrant D |  |
 |
Quadrant C |
| Plot type | Count rate plots | Images |
|---|---|---|
| Comparison with Poisson distribution Blue bars denote a histogram of data divided into 1 sec bins. Red curve is a Poisson curve with rate = median count rate of data. |
 |
 |
| Quadrant-wise count rates Data is divided into 100 sec bins |
 |
|
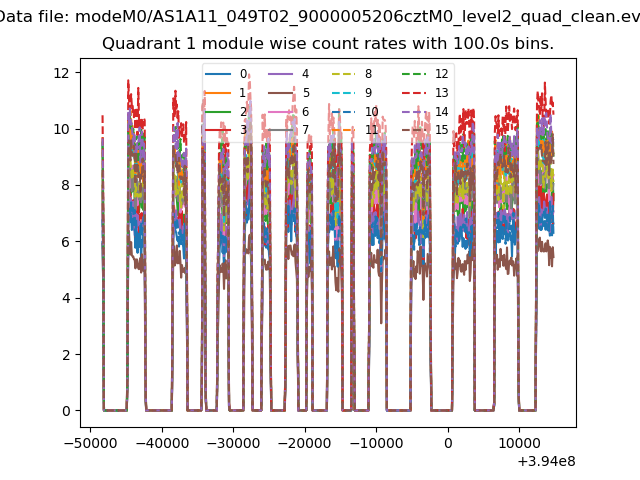
| Module-wise count rates for Quadrant A Data is divided into 100 sec bins |
 |
 |
| Module-wise count rates for Quadrant B Data is divided into 100 sec bins |
 |
 |
| Module-wise count rates for Quadrant C Data is divided into 100 sec bins |
 |
 |
| Module-wise count rates for Quadrant D Data is divided into 100 sec bins |
 |
 |
| Parameter | Plot |
|---|---|
| CZT HV Monitor |  |
| D_VDD |  |
| Temperature 1 | 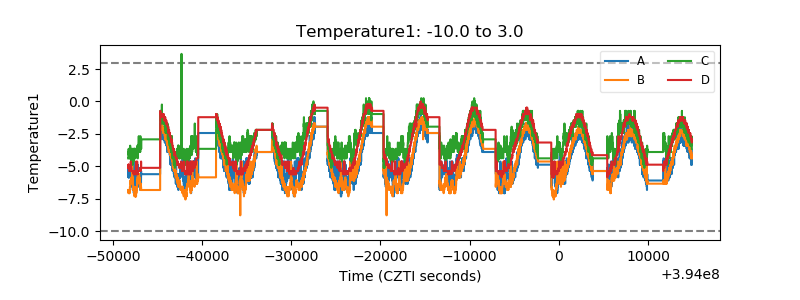 |
| Veto HV Monitor |  |
| Veto LLD | 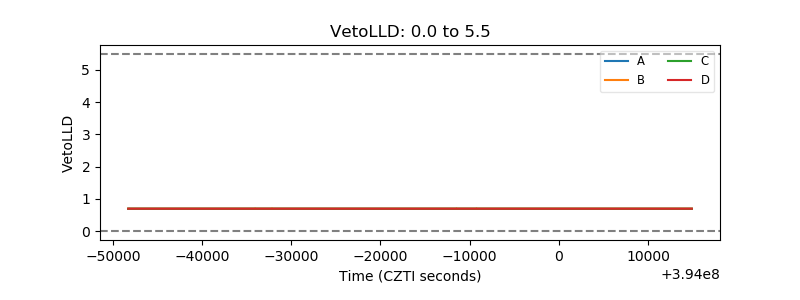 |
| Alpha Counter |  |
| _CPM_Rate |  |
| CZT Counter |  |
| +2.5 Volts monitor |  |
| +5 Volts monitor |  |
| _ROLL_ROT | 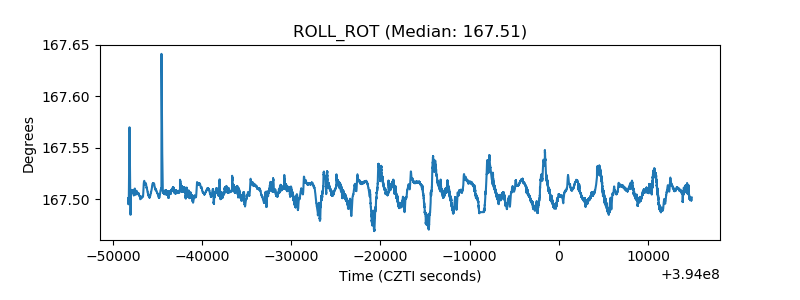 |
| _Roll_DEC | 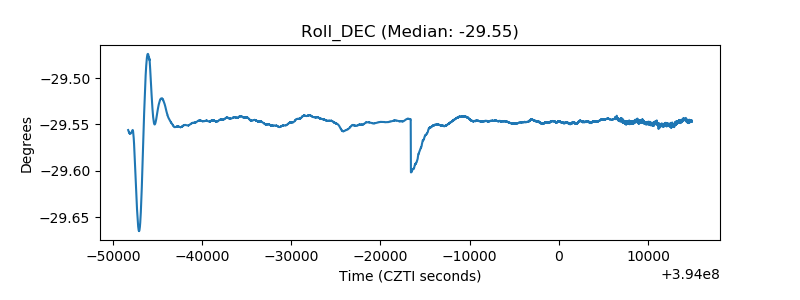 |
| _Roll_RA |  |
| Veto Counter |  |