| Param | Original file | Final file |
|---|---|---|
| Filename | modeM0/AS1A11_049T02_9000005206_36469cztM0_level2.evt | modeM0/AS1A11_049T02_9000005206_36469cztM0_level2_quad_clean.evt |
| Size (bytes) | 466,009,920 | 73,013,760 |
| Size | 444.4 MB | 69.6 MB |
| Events in quadrant A | 2,851,168 | 460,810 |
| Events in quadrant B | 3,433,765 | 453,249 |
| Events in quadrant C | 3,198,208 | 443,423 |
| Events in quadrant D | 4,221,252 | 433,047 |
| Mode M0 | |||
|---|---|---|---|
| Quadrant | BADHDUFLAG | Total packets | Discarded packets |
| A | 0 | 12413 | 3 |
| B | 0 | 14272 | 2 |
| C | 0 | 13259 | 2 |
| D | 0 | 16593 | 2 |
| Mode SS | |||
|---|---|---|---|
| Quadrant | BADHDUFLAG | Total packets | Discarded packets |
| A | 0 | 122 | 0 |
| B | 0 | 122 | 0 |
| C | 0 | 122 | 0 |
| D | 0 | 122 | 0 |
| Mode M9 | |||
|---|---|---|---|
| Quadrant | BADHDUFLAG | Total packets | Discarded packets |
| A | 0 | 26 | 0 |
| B | 0 | 26 | 0 |
| C | 0 | 26 | 0 |
| D | 0 | 26 | 0 |
| Quadrant | Total seconds | Saturated seconds | Saturation percentage |
|---|---|---|---|
| A | 6019 | 3 | 0.049842% |
| B | 6019 | 94 | 1.561721% |
| C | 6019 | 96 | 1.594949% |
| D | 6019 | 409 | 6.795149% |
Noise dominated data is calculated using 1-second bins in cleaned event files. If a bin has >2000 counts, and if more than 50% of those come from <1% of pixels, then it is considered to be noise-dominated and hence unusable.
| Quadrant | # 1 sec bins | Bins with >0 counts | Bins with >2000 counts | High rate bins dominated by noise | Noise dominated (total time) | Noise dominated (detector-on time) | Marked lightcurve |
|---|---|---|---|---|---|---|---|
| A | 7300 | 6020 | 0 | 0 | 0.00% | 0.00% | 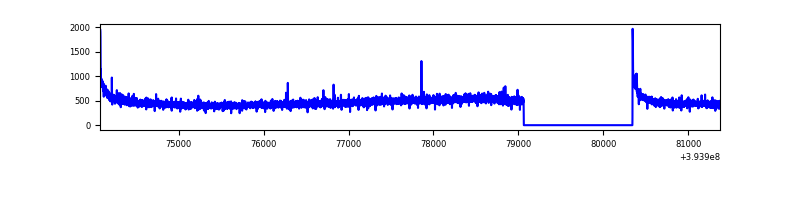 |
| B | 7300 | 6020 | 53 | 53 | 0.73% | 0.88% | 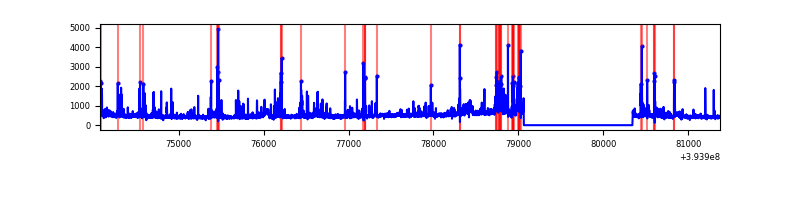 |
| C | 7300 | 6020 | 89 | 89 | 1.22% | 1.48% | 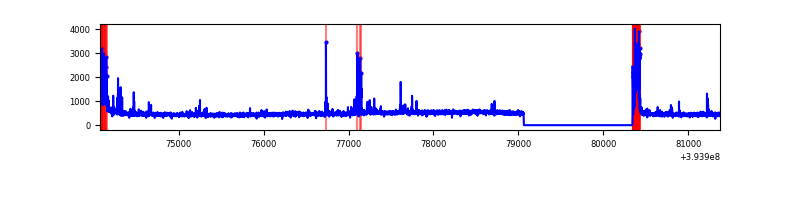 |
| D | 7300 | 6020 | 417 | 417 | 5.71% | 6.93% | 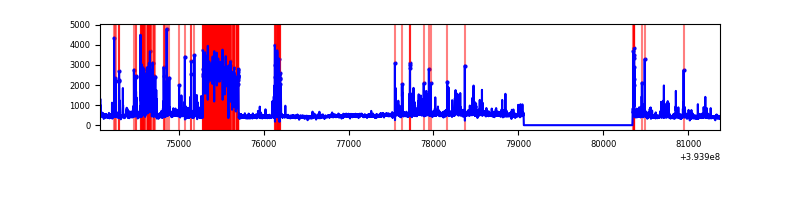 |
Top three noisy pixels from each quadrant. If the there are fewer than three noisy pixels in the level2.evt file, extra rows are filled as -1
| Pixel properties | Quadrant properties | ||||||
|---|---|---|---|---|---|---|---|
| Quadrant | DetID | PixID | Counts | Sigma | Mean | Median | Sigma |
| A | 10 | 83 | 202874 | 1472.89 | 679 | 666 | 137.3 |
| A | 13 | 254 | 11020 | 75.42 | 679 | 666 | 137.3 |
| A | 3 | 137 | 7331 | 48.55 | 679 | 666 | 137.3 |
| B | 5 | 172 | 298546 | 2292.86 | 669 | 652 | 129.9 |
| B | 5 | 255 | 171359 | 1313.92 | 669 | 652 | 129.9 |
| B | 0 | 189 | 145257 | 1113.01 | 669 | 652 | 129.9 |
| C | 15 | 214 | 257040 | 1684.5 | 650 | 653 | 152.2 |
| C | 0 | 10 | 194930 | 1276.43 | 650 | 653 | 152.2 |
| C | 6 | 255 | 122759 | 802.25 | 650 | 653 | 152.2 |
| D | 1 | 20 | 954400 | 6006.37 | 644 | 626 | 158.8 |
| D | 12 | 6 | 169914 | 1066.09 | 644 | 626 | 158.8 |
| D | 10 | 118 | 100742 | 630.48 | 644 | 626 | 158.8 |
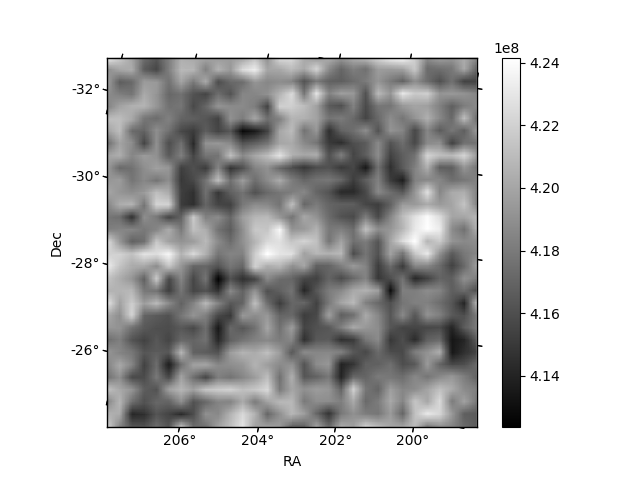
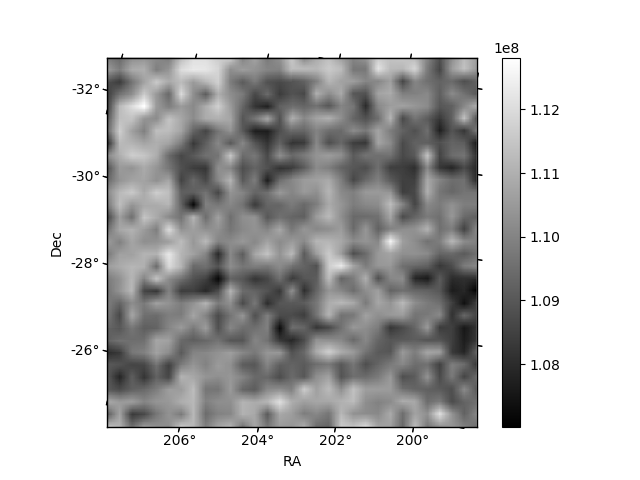
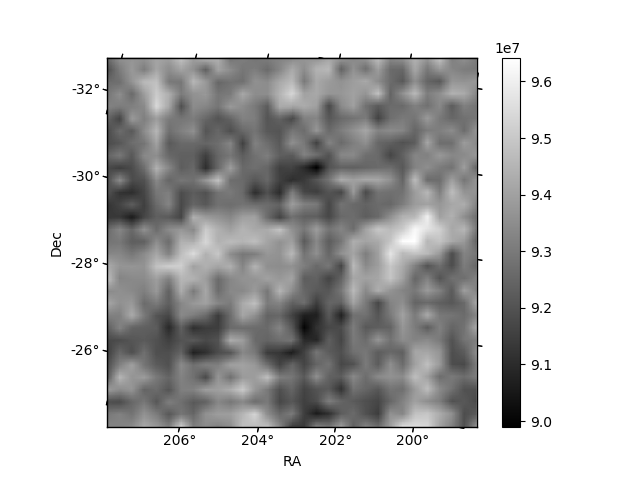
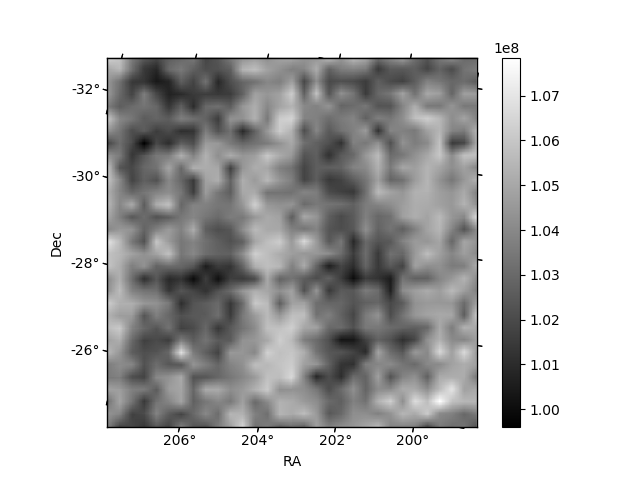
Histogram calculated using DETX and DETY for each event in the final _common_clean file
| Quadrant A | 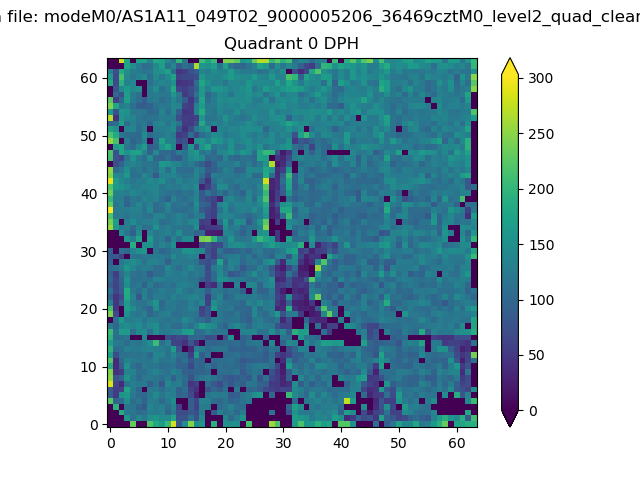 |
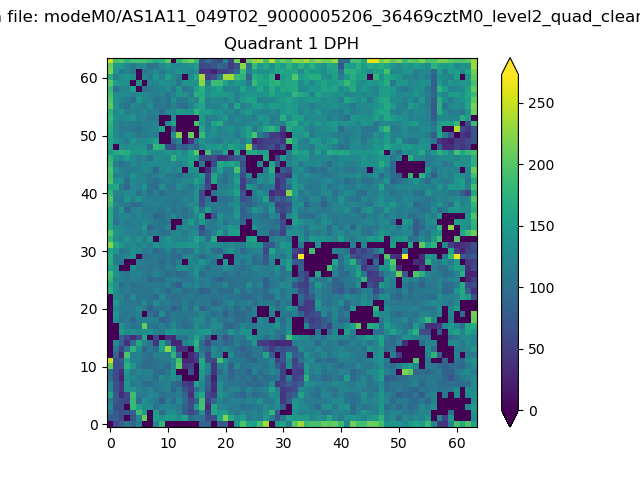 |
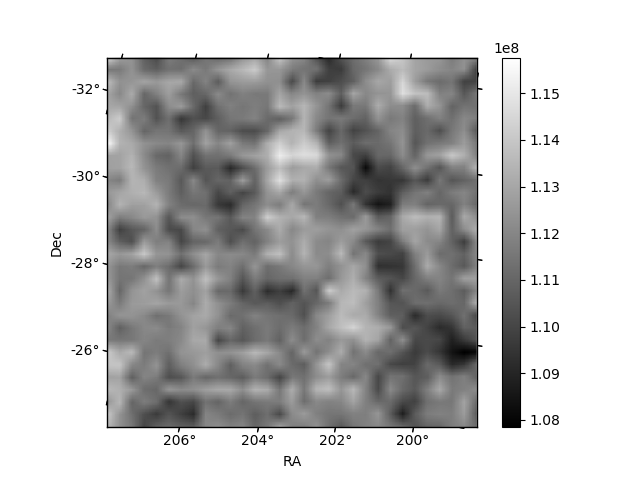
Quadrant B |
|---|---|---|---|
| Quadrant D | 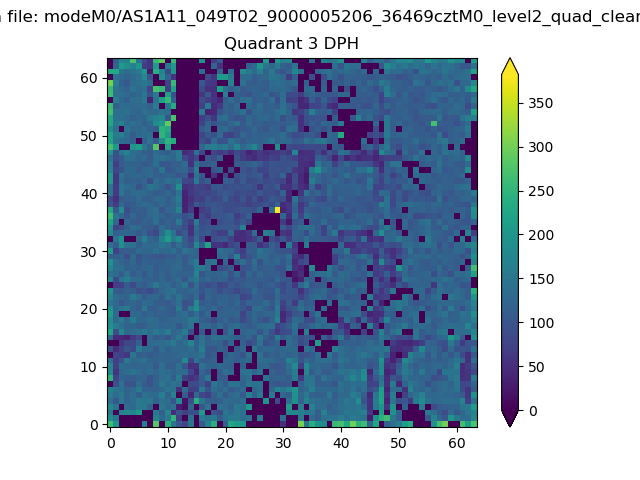 |
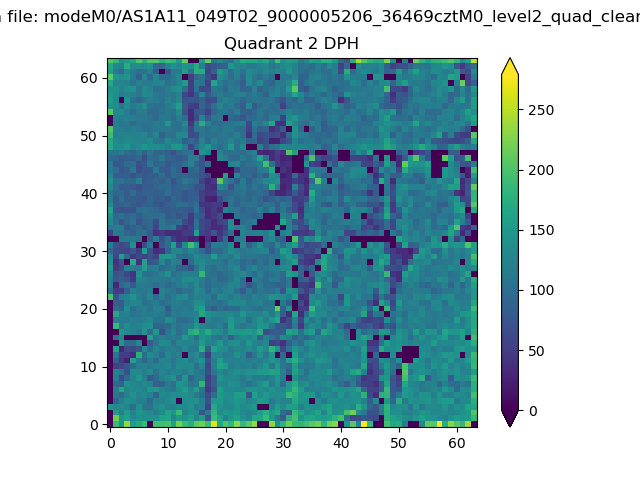 |
Quadrant C |
| Plot type | Count rate plots | Images |
|---|---|---|
| Comparison with Poisson distribution Blue bars denote a histogram of data divided into 1 sec bins. Red curve is a Poisson curve with rate = median count rate of data. |
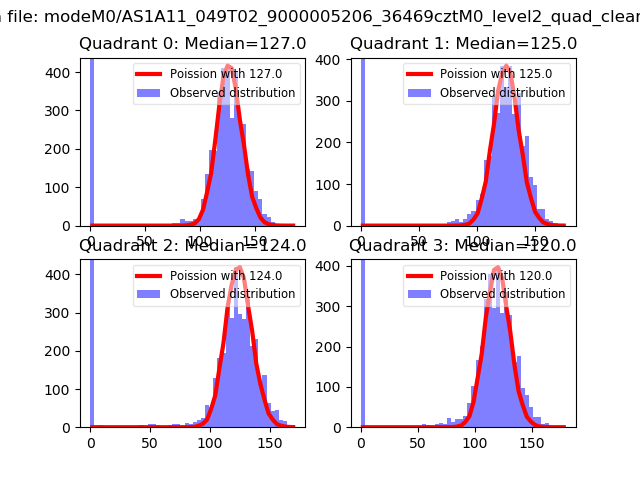 |
 |
| Quadrant-wise count rates Data is divided into 100 sec bins |
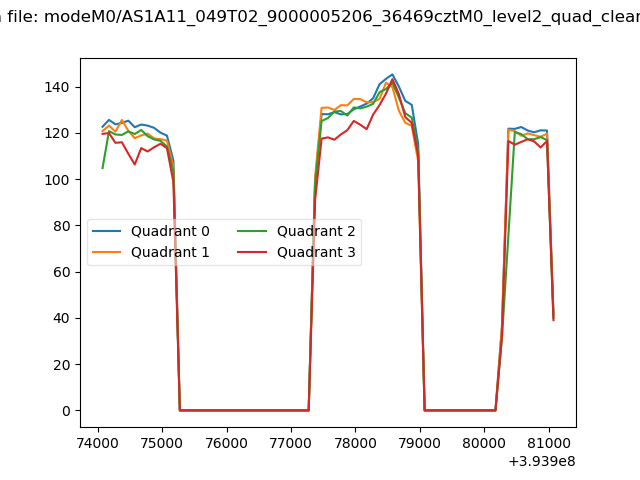 |
|
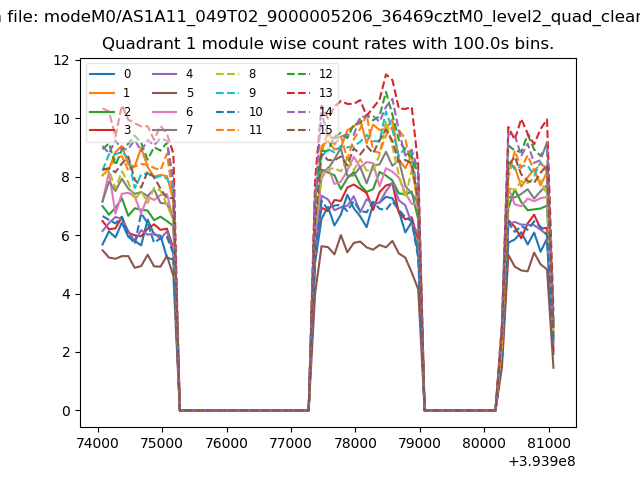
| Module-wise count rates for Quadrant A Data is divided into 100 sec bins |
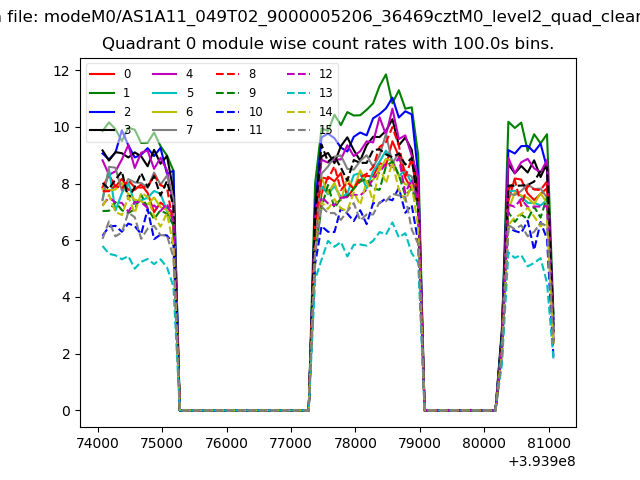 |
 |
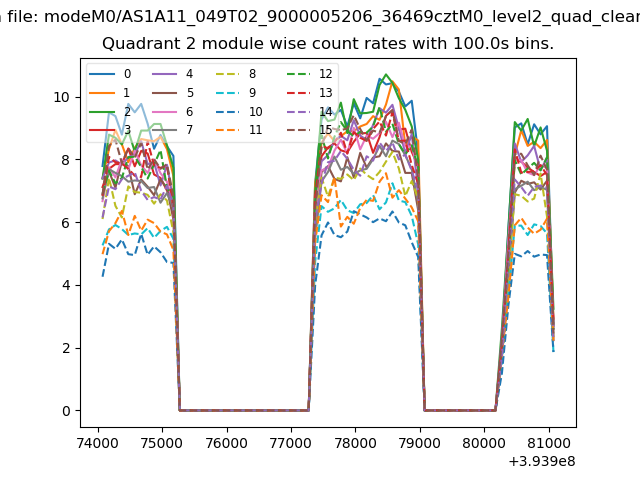
| Module-wise count rates for Quadrant B Data is divided into 100 sec bins |
 |
 |
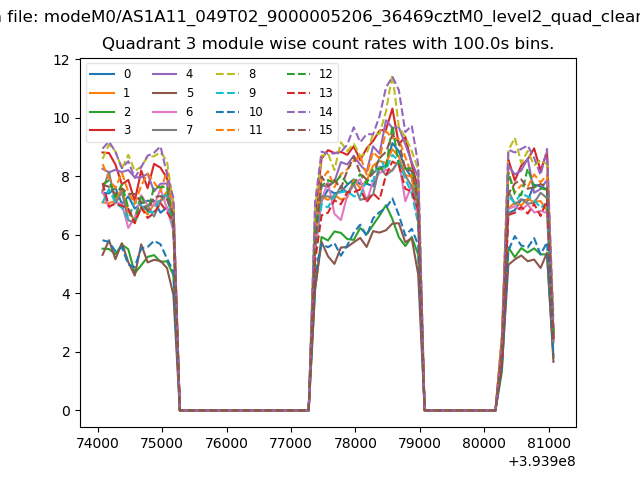
| Module-wise count rates for Quadrant C Data is divided into 100 sec bins |
 |
 |
| Module-wise count rates for Quadrant D Data is divided into 100 sec bins |
 |
 |
| Parameter | Plot |
|---|---|
| CZT HV Monitor | 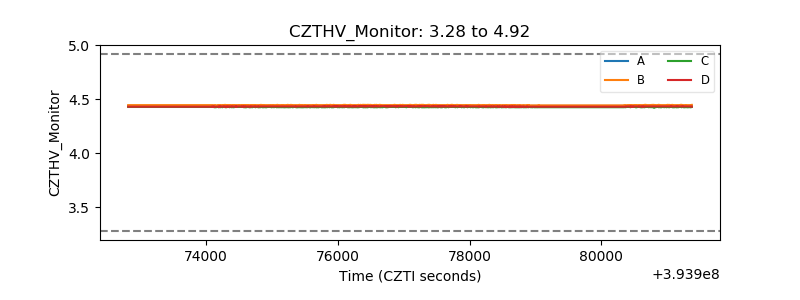 |
| D_VDD | 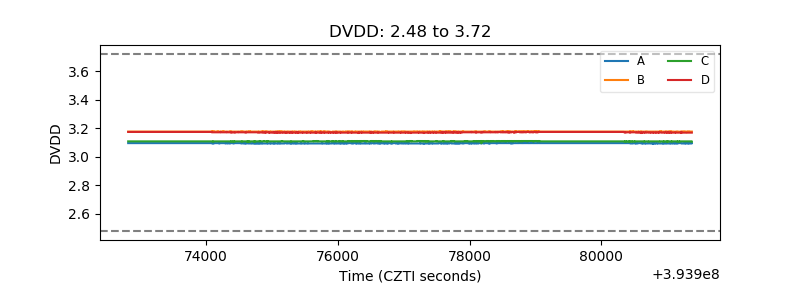 |
| Temperature 1 | 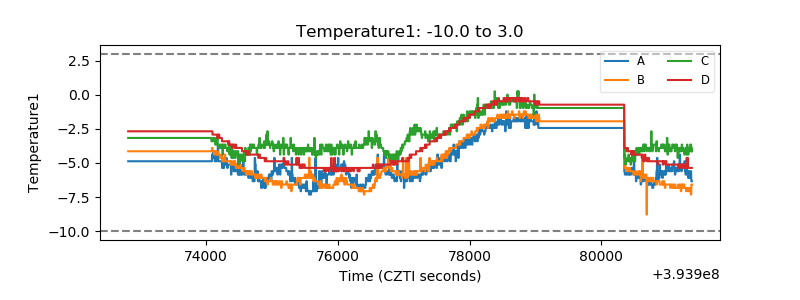 |
| Veto HV Monitor | 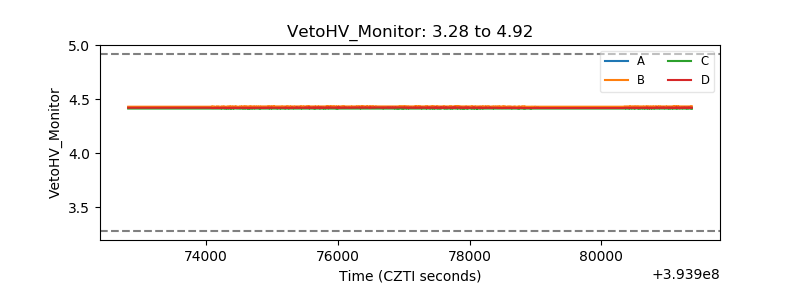 |
| Veto LLD | 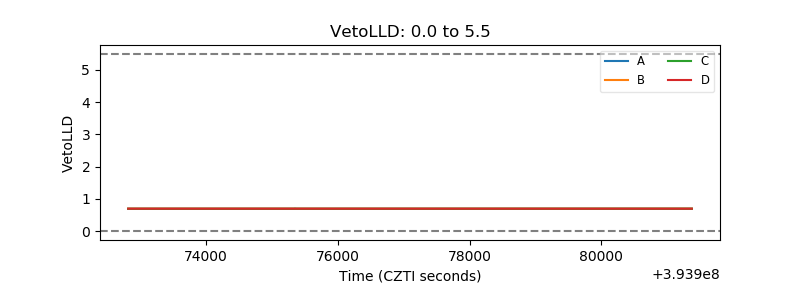 |
| Alpha Counter | 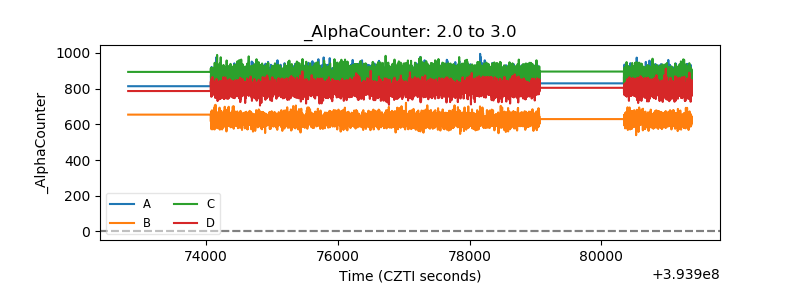 |
| _CPM_Rate | 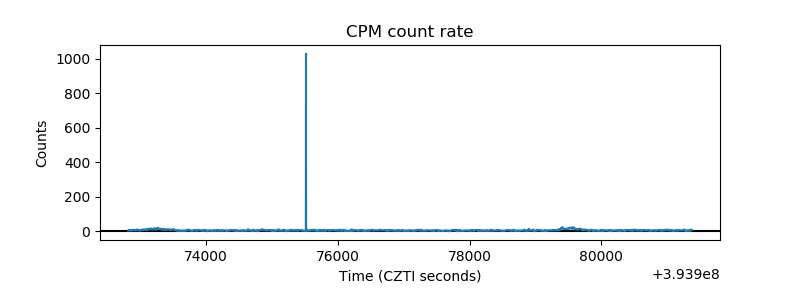 |
| CZT Counter | 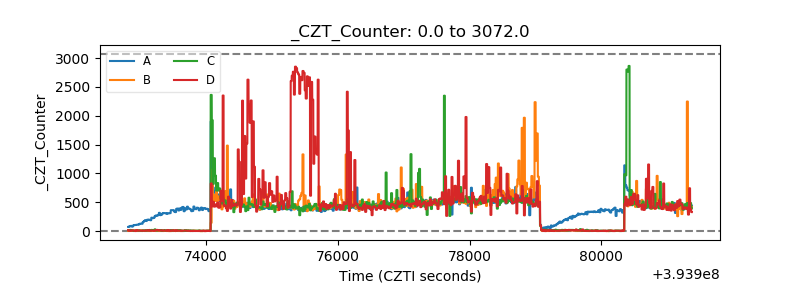 |
| +2.5 Volts monitor |  |
| +5 Volts monitor |  |
| _ROLL_ROT | 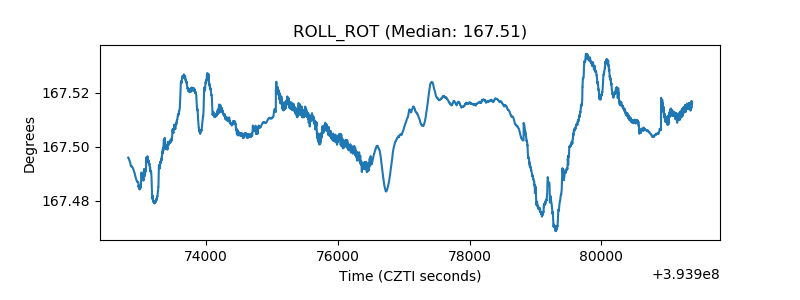 |
| _Roll_DEC | 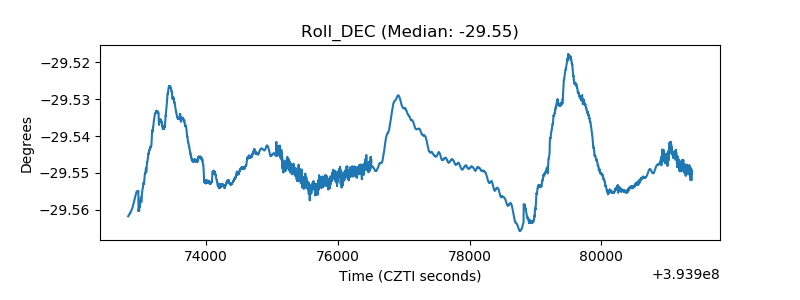 |
| _Roll_RA | 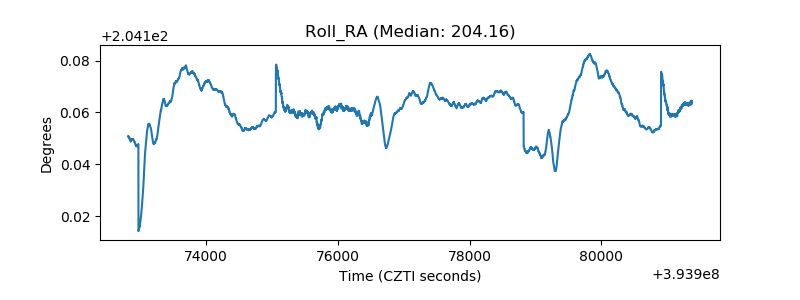 |
| Veto Counter | 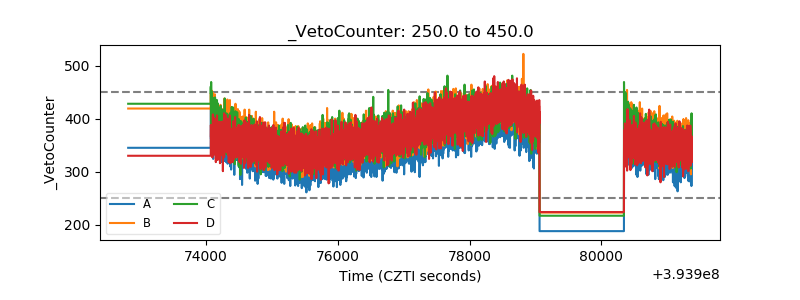 |