| Param | Original file | Final file |
|---|---|---|
| Filename | modeM0/AS1A11_049T03_9000005208cztM0_level2.fits | modeM0/AS1A11_049T03_9000005208cztM0_level2_quad_clean.evt |
| Size (bytes) | 266,071,680 | 252,184,320 |
| Size | 253.7 MB | 240.5 MB |
| Events in quadrant A | 1,677,844 | 1,564,301 |
| Events in quadrant B | 1,557,204 | 1,485,343 |
| Events in quadrant C | 1,563,804 | 1,398,076 |
| Events in quadrant D | 1,379,066 | 1,309,071 |
| Mode M9 | |||
|---|---|---|---|
| Quadrant | BADHDUFLAG | Total packets | Discarded packets |
| A | 0 | 135 | 0 |
| B | 0 | 135 | 0 |
| C | 0 | 135 | 0 |
| D | 0 | 135 | 0 |
| Mode M0 | |||
|---|---|---|---|
| Quadrant | BADHDUFLAG | Total packets | Discarded packets |
| A | 0 | 57617 | 0 |
| B | 0 | 65136 | 0 |
| C | 0 | 74931 | 0 |
| D | 0 | 73610 | 0 |
| Mode SS | |||
|---|---|---|---|
| Quadrant | BADHDUFLAG | Total packets | Discarded packets |
| A | 0 | 562 | 0 |
| B | 0 | 562 | 0 |
| C | 0 | 562 | 0 |
| D | 0 | 562 | 0 |
| Quadrant | Total seconds | Saturated seconds | Saturation percentage |
|---|---|---|---|
| A | 27332 | 44 | 0.160983% |
| B | 27332 | 481 | 1.759842% |
| C | 27332 | 1105 | 4.042880% |
| D | 27332 | 1206 | 4.412410% |
Noise dominated data is calculated using 1-second bins in cleaned event files. If a bin has >2000 counts, and if more than 50% of those come from <1% of pixels, then it is considered to be noise-dominated and hence unusable.
| Quadrant | # 1 sec bins | Bins with >0 counts | Bins with >2000 counts | High rate bins dominated by noise | Noise dominated (total time) | Noise dominated (detector-on time) | Marked lightcurve |
|---|---|---|---|---|---|---|---|
| A | 40928 | 27332 | 0 | 0 | 0.00% | 0.00% |  |
| B | 40928 | 27330 | 0 | 0 | 0.00% | 0.00% |  |
| C | 40928 | 27324 | 0 | 0 | 0.00% | 0.00% |  |
| D | 40928 | 27312 | 0 | 0 | 0.00% | 0.00% |  |
Top three noisy pixels from each quadrant. If the there are fewer than three noisy pixels in the level2.evt file, extra rows are filled as -1
| Pixel properties | Quadrant properties | ||||||
|---|---|---|---|---|---|---|---|
| Quadrant | DetID | PixID | Counts | Sigma | Mean | Median | Sigma |
| A | 0 | 29 | 1380 | 8.88 | 438 | 415 | 108.6 |
| A | 9 | 19 | 1355 | 8.65 | 438 | 415 | 108.6 |
| A | 7 | 110 | 1340 | 8.51 | 438 | 415 | 108.6 |
| B | 2 | 9 | 1359 | 11.81 | 413 | 397 | 81.5 |
| B | 3 | 80 | 1173 | 9.53 | 413 | 397 | 81.5 |
| B | 5 | 128 | 1082 | 8.41 | 413 | 397 | 81.5 |
| C | 1 | 81 | 1312 | 8.57 | 413 | 389 | 107.7 |
| C | 3 | 202 | 1263 | 8.11 | 413 | 389 | 107.7 |
| C | 1 | 80 | 1262 | 8.11 | 413 | 389 | 107.7 |
| D | 10 | 113 | 1072 | 6.72 | 395 | 363 | 105.5 |
| D | 4 | 160 | 1063 | 6.64 | 395 | 363 | 105.5 |
| D | 7 | 3 | 1060 | 6.61 | 395 | 363 | 105.5 |
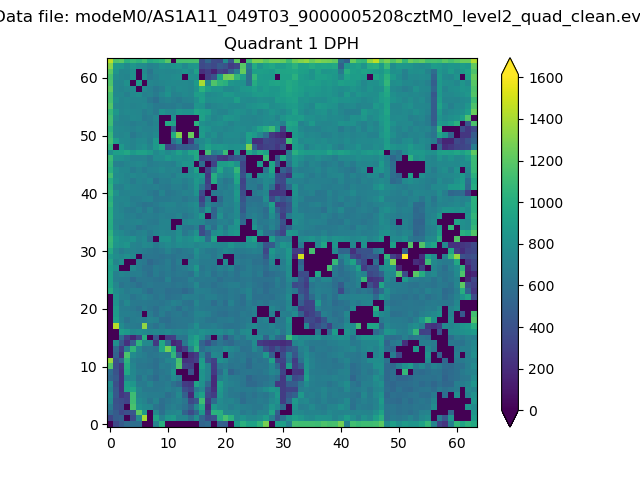
Histogram calculated using DETX and DETY for each event in the final _common_clean file
| Quadrant A |  |
 |
Quadrant B |
|---|---|---|---|
| Quadrant D |  |
 |
Quadrant C |
| Plot type | Count rate plots | Images |
|---|---|---|
| Comparison with Poisson distribution Blue bars denote a histogram of data divided into 1 sec bins. Red curve is a Poisson curve with rate = median count rate of data. |
 |
 |
| Quadrant-wise count rates Data is divided into 100 sec bins |
 |
|
| Module-wise count rates for Quadrant A Data is divided into 100 sec bins |
 |
 |
| Module-wise count rates for Quadrant B Data is divided into 100 sec bins |
 |
 |
| Module-wise count rates for Quadrant C Data is divided into 100 sec bins |
 |
 |
| Module-wise count rates for Quadrant D Data is divided into 100 sec bins |
 |
 |
| Parameter | Plot |
|---|---|
| CZT HV Monitor |  |
| D_VDD |  |
| Temperature 1 |  |
| Veto HV Monitor |  |
| Veto LLD |  |
| Alpha Counter |  |
| _CPM_Rate |  |
| CZT Counter |  |
| +2.5 Volts monitor |  |
| +5 Volts monitor |  |
| _ROLL_ROT |  |
| _Roll_DEC |  |
| _Roll_RA |  |
| Veto Counter |  |