| Param | Original file | Final file |
|---|---|---|
| Filename | modeM0/AS1A11_049T03_9000005208_36483cztM0_level2.evt | modeM0/AS1A11_049T03_9000005208_36483cztM0_level2_quad_clean.evt |
| Size (bytes) | 69,710,400 | 10,365,120 |
| Size | 66.5 MB | 9.9 MB |
| Events in quadrant A | 318,947 | 72,038 |
| Events in quadrant B | 549,016 | 66,522 |
| Events in quadrant C | 432,198 | 68,107 |
| Events in quadrant D | 768,337 | 58,100 |
| Mode M9 | |||
|---|---|---|---|
| Quadrant | BADHDUFLAG | Total packets | Discarded packets |
| A | 0 | 10 | 0 |
| B | 0 | 10 | 0 |
| C | 0 | 10 | 0 |
| D | 0 | 11 | 0 |
| Mode M0 | |||
|---|---|---|---|
| Quadrant | BADHDUFLAG | Total packets | Discarded packets |
| A | 0 | 1312 | 1 |
| B | 0 | 2016 | 1 |
| C | 0 | 1656 | 1 |
| D | 0 | 2689 | 1 |
| Mode SS | |||
|---|---|---|---|
| Quadrant | BADHDUFLAG | Total packets | Discarded packets |
| A | 0 | 12 | 0 |
| B | 0 | 12 | 0 |
| C | 0 | 12 | 0 |
| D | 0 | 12 | 0 |
| Quadrant | Total seconds | Saturated seconds | Saturation percentage |
|---|---|---|---|
| A | 580 | 4 | 0.689655% |
| B | 580 | 90 | 15.517241% |
| C | 580 | 43 | 7.413793% |
| D | 580 | 178 | 30.689655% |
Noise dominated data is calculated using 1-second bins in cleaned event files. If a bin has >2000 counts, and if more than 50% of those come from <1% of pixels, then it is considered to be noise-dominated and hence unusable.
| Quadrant | # 1 sec bins | Bins with >0 counts | Bins with >2000 counts | High rate bins dominated by noise | Noise dominated (total time) | Noise dominated (detector-on time) | Marked lightcurve |
|---|---|---|---|---|---|---|---|
| A | 580 | 580 | 2 | 2 | 0.34% | 0.34% | 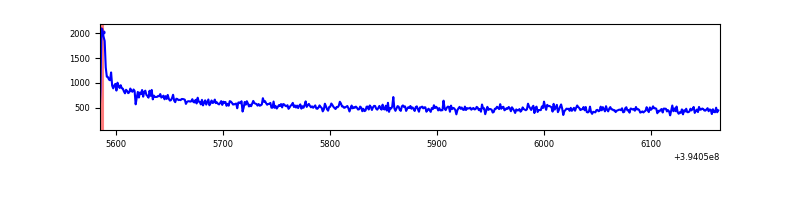 |
| B | 580 | 580 | 80 | 80 | 13.79% | 13.79% | 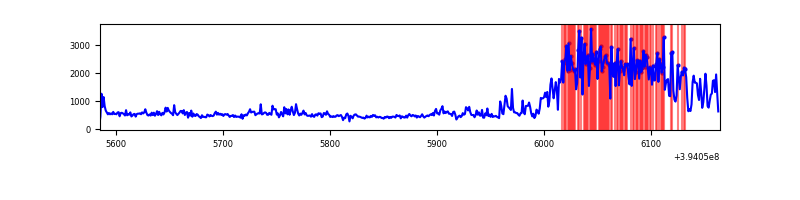 |
| C | 580 | 580 | 34 | 34 | 5.86% | 5.86% | 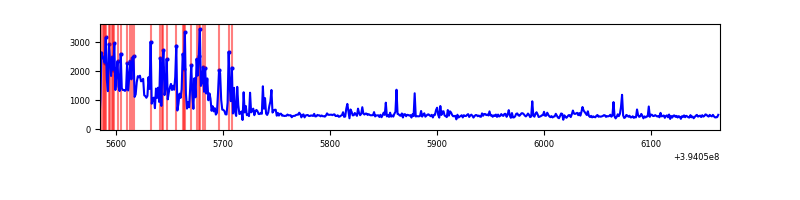 |
| D | 580 | 580 | 178 | 178 | 30.69% | 30.69% | 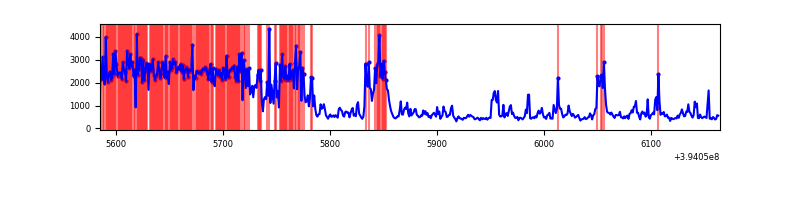 |
Top three noisy pixels from each quadrant. If the there are fewer than three noisy pixels in the level2.evt file, extra rows are filled as -1
| Pixel properties | Quadrant properties | ||||||
|---|---|---|---|---|---|---|---|
| Quadrant | DetID | PixID | Counts | Sigma | Mean | Median | Sigma |
| A | 10 | 83 | 61999 | 4037.76 | 65 | 63 | 15.3 |
| A | 10 | 67 | 2505 | 159.2 | 65 | 63 | 15.3 |
| A | 13 | 6 | 2422 | 153.79 | 65 | 63 | 15.3 |
| B | 5 | 172 | 281082 | 20407.16 | 60 | 59 | 13.8 |
| B | 0 | 189 | 8912 | 642.88 | 60 | 59 | 13.8 |
| B | 0 | 213 | 7323 | 527.49 | 60 | 59 | 13.8 |
| C | 0 | 10 | 166179 | 10541.38 | 59 | 59 | 15.8 |
| C | 15 | 214 | 29369 | 1859.91 | 59 | 59 | 15.8 |
| C | 4 | 254 | 2134 | 131.67 | 59 | 59 | 15.8 |
| D | 12 | 227 | 439091 | 28930.73 | 54 | 52 | 15.2 |
| D | 13 | 171 | 80580 | 5306.44 | 54 | 52 | 15.2 |
| D | 13 | 249 | 9245 | 605.78 | 54 | 52 | 15.2 |
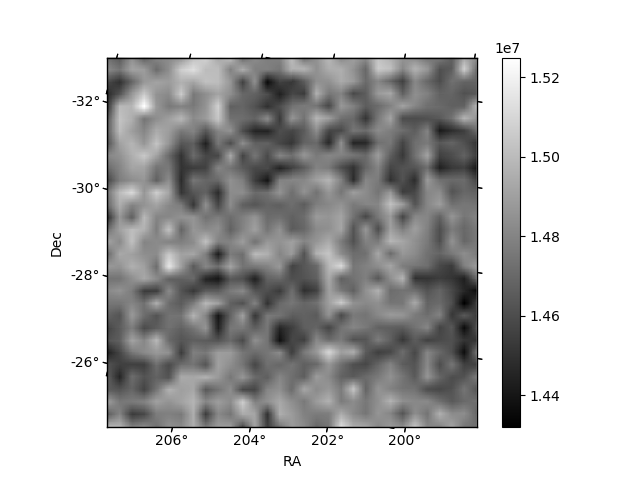
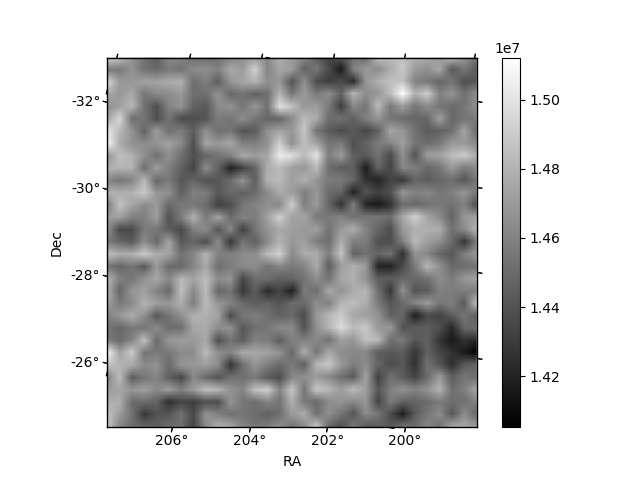
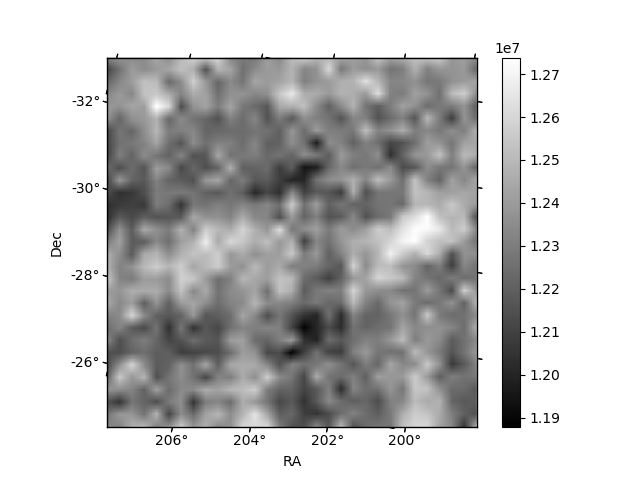
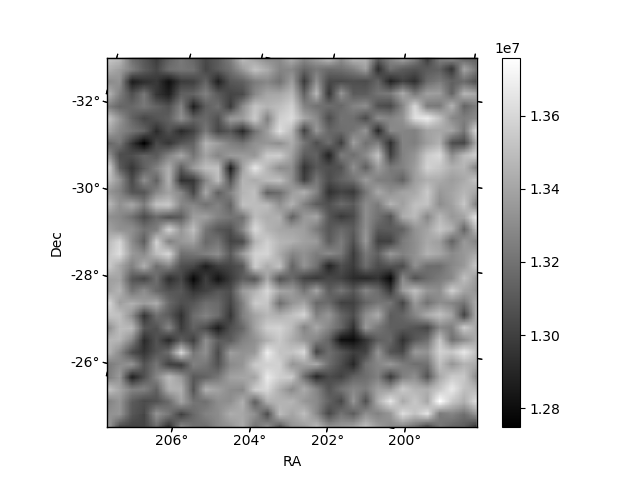
Histogram calculated using DETX and DETY for each event in the final _common_clean file
| Quadrant A | 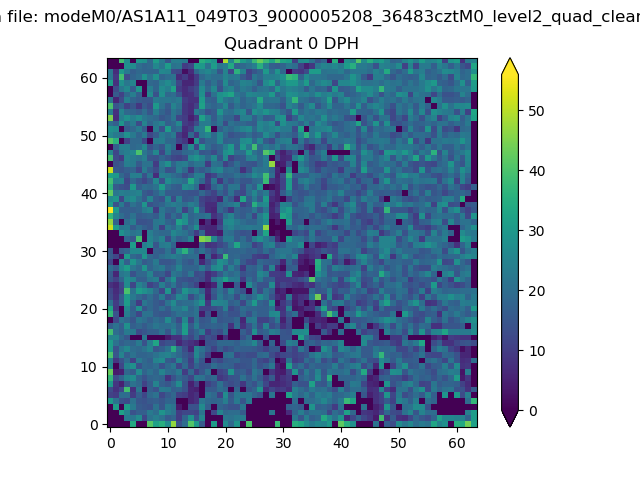 |
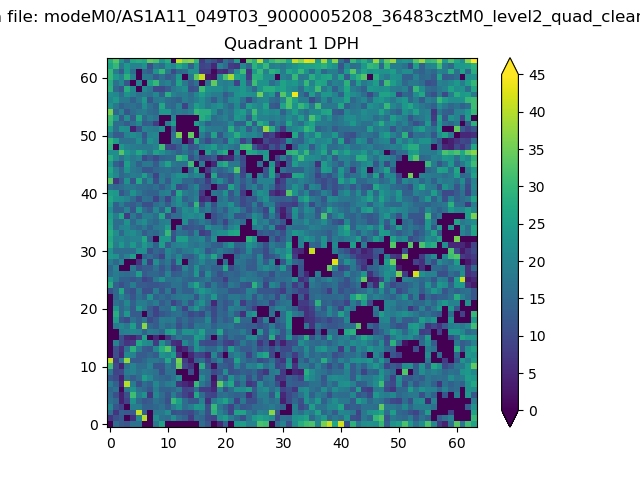 |
Quadrant B |
|---|---|---|---|
| Quadrant D | 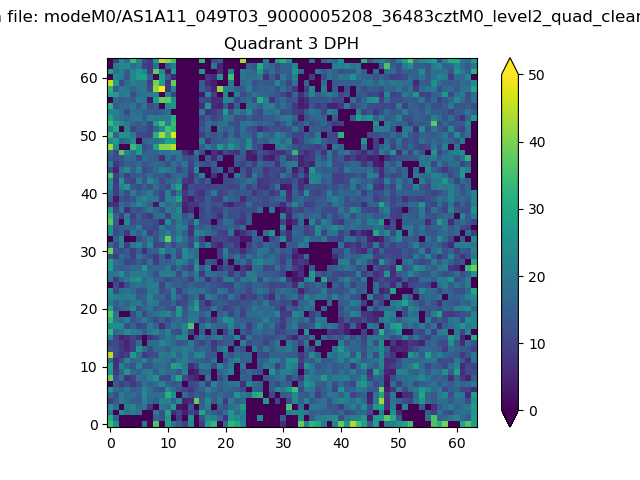 |
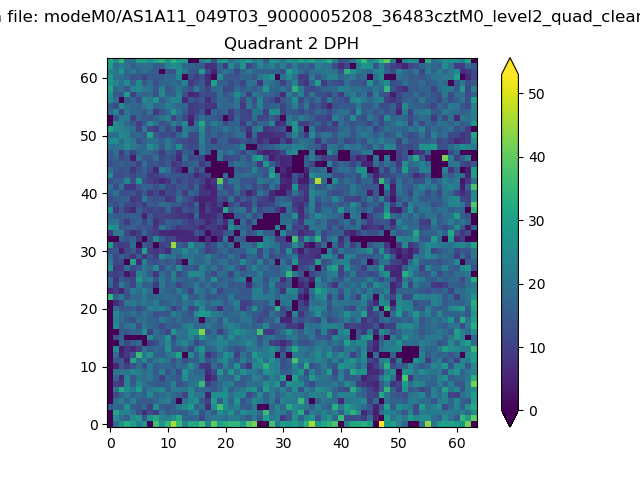 |
Quadrant C |
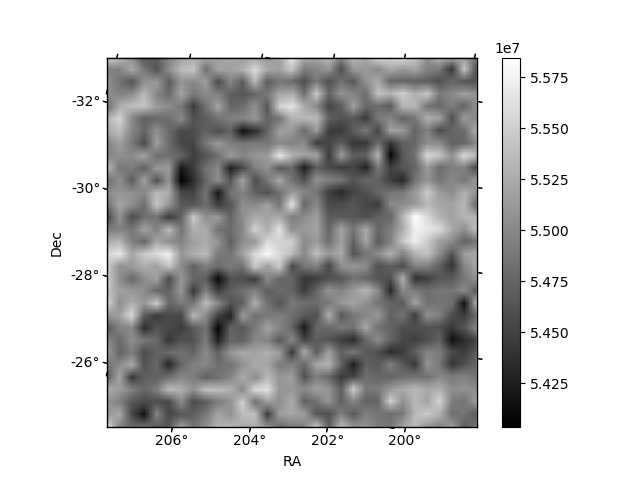
| Plot type | Count rate plots | Images |
|---|---|---|
| Comparison with Poisson distribution Blue bars denote a histogram of data divided into 1 sec bins. Red curve is a Poisson curve with rate = median count rate of data. |
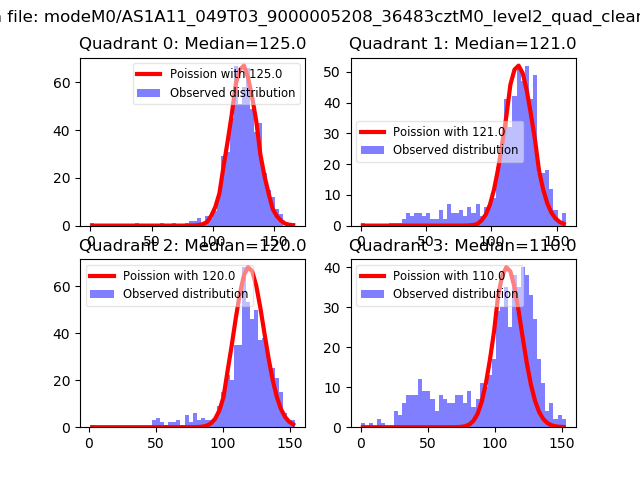 |
 |
| Quadrant-wise count rates Data is divided into 100 sec bins |
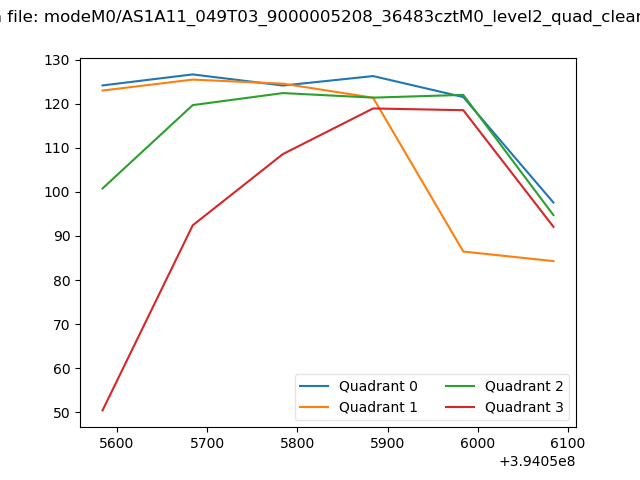 |
|
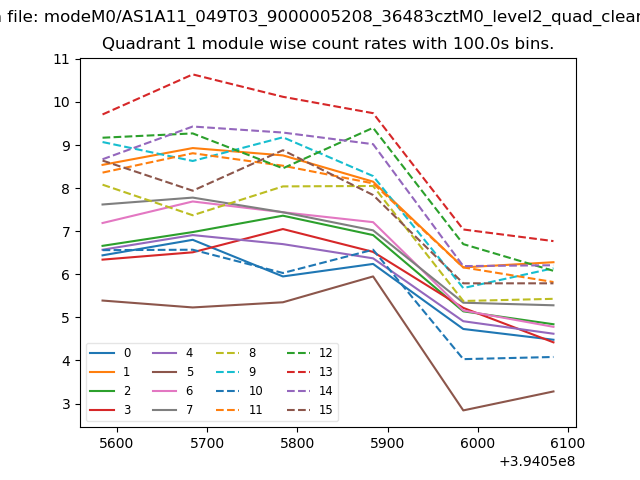
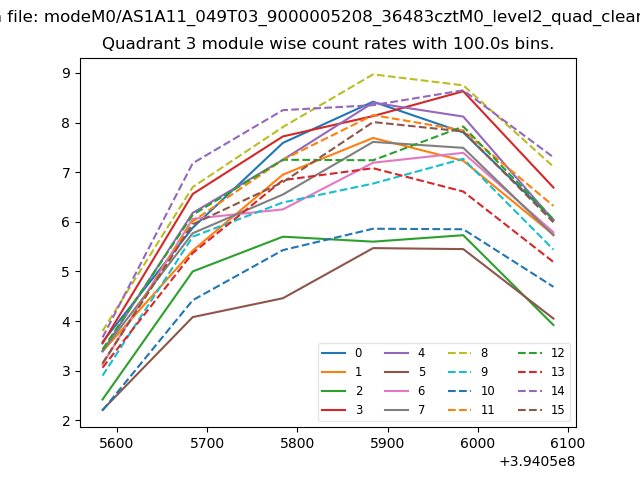
| Module-wise count rates for Quadrant A Data is divided into 100 sec bins |
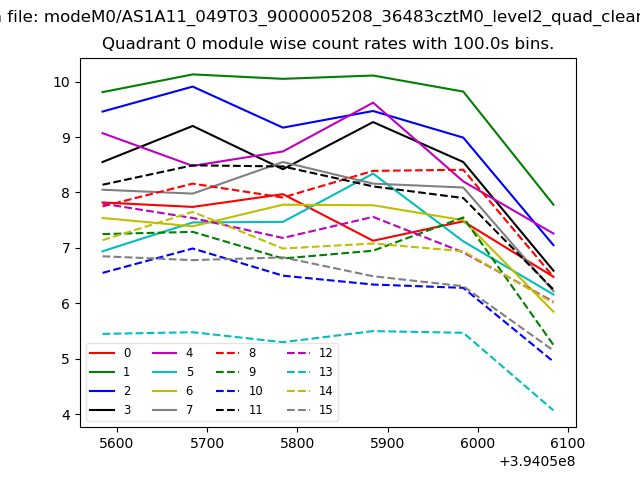 |
 |
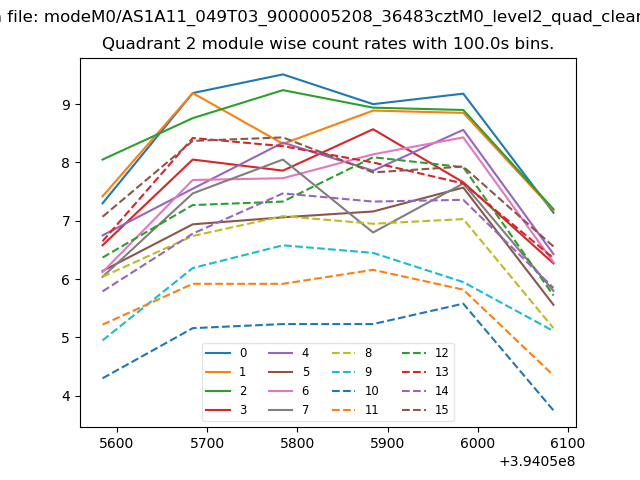
| Module-wise count rates for Quadrant B Data is divided into 100 sec bins |
 |
 |
| Module-wise count rates for Quadrant C Data is divided into 100 sec bins |
 |
 |
| Module-wise count rates for Quadrant D Data is divided into 100 sec bins |
 |
 |
| Parameter | Plot |
|---|---|
| CZT HV Monitor | 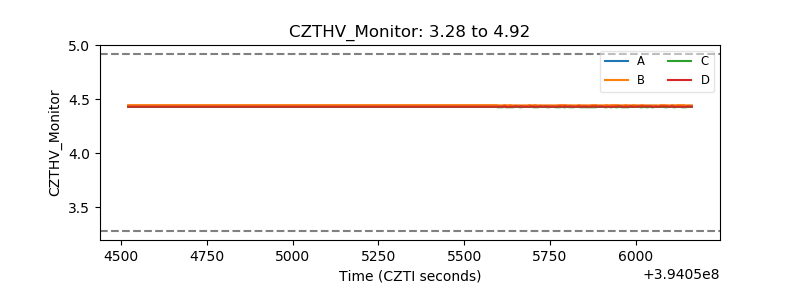 |
| D_VDD | 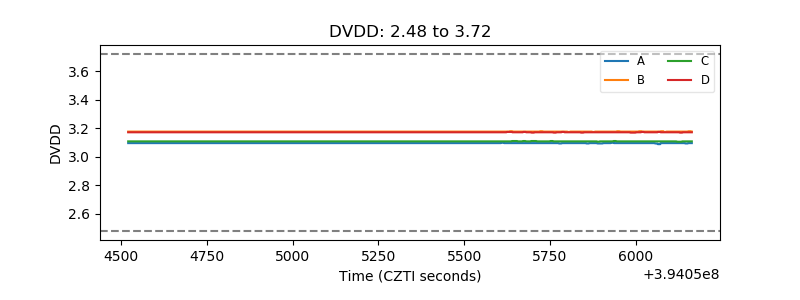 |
| Temperature 1 | 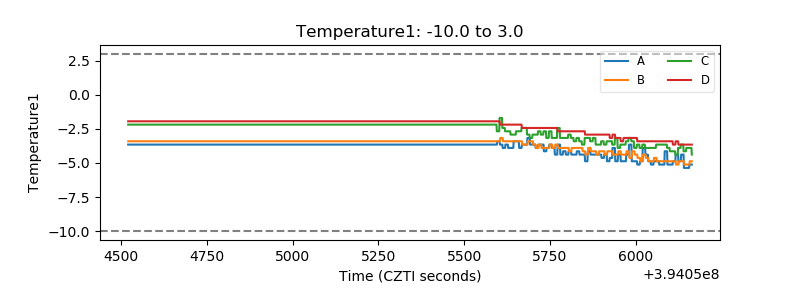 |
| Veto HV Monitor | 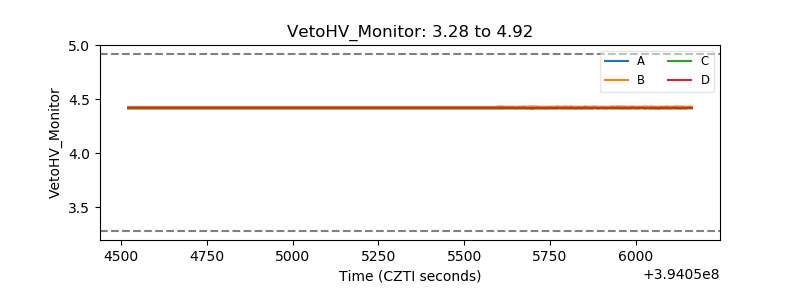 |
| Veto LLD | 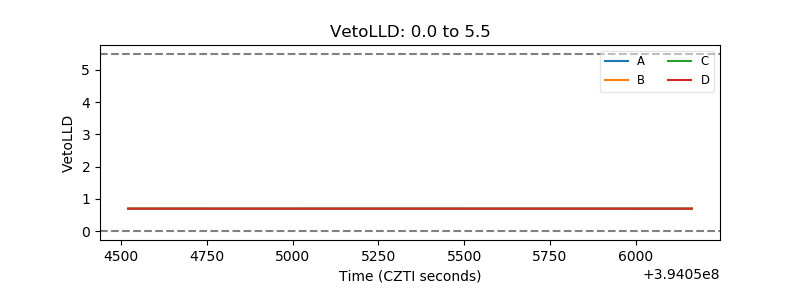 |
| Alpha Counter | 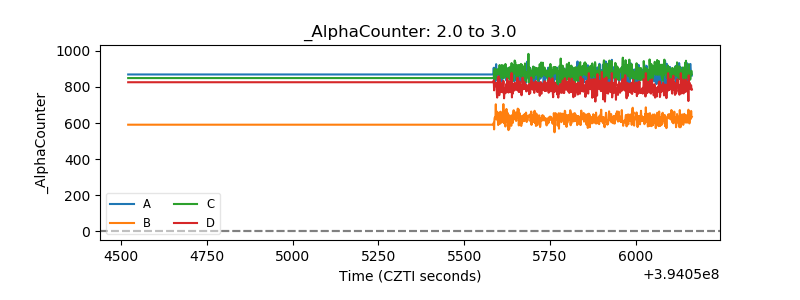 |
| _CPM_Rate | 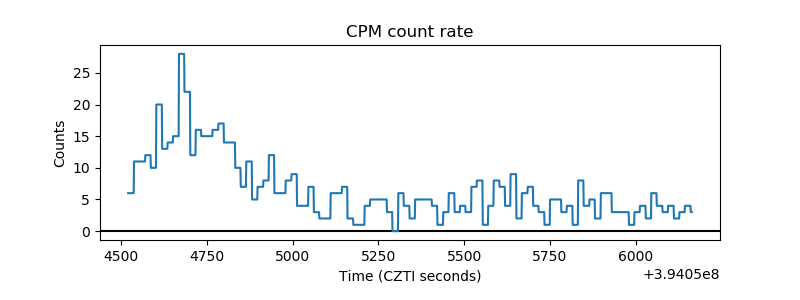 |
| CZT Counter | 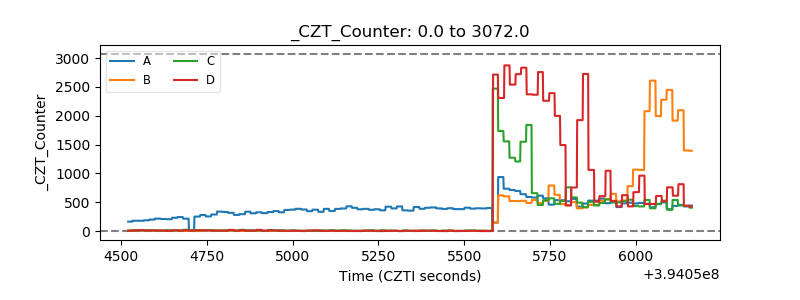 |
| +2.5 Volts monitor |  |
| +5 Volts monitor | 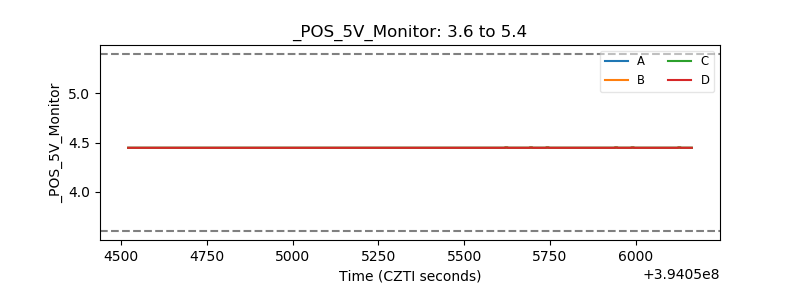 |
| _ROLL_ROT | 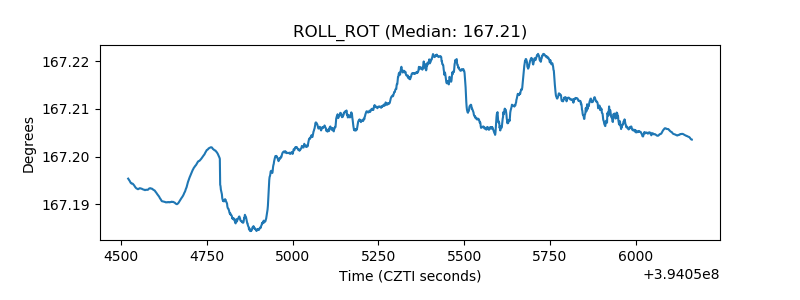 |
| _Roll_DEC | 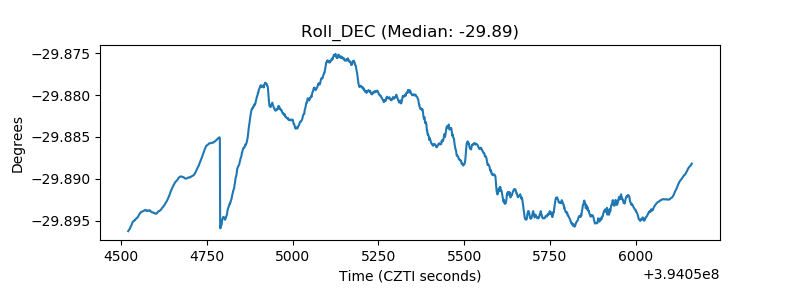 |
| _Roll_RA | 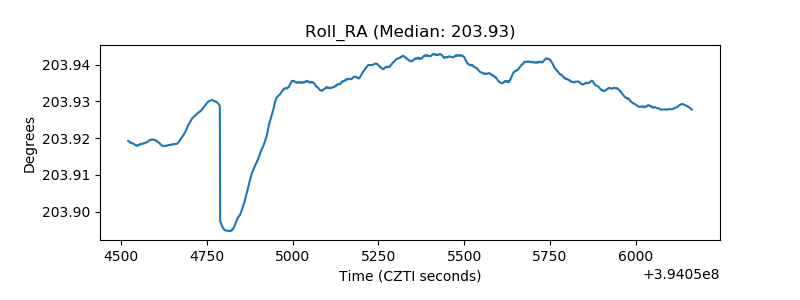 |
| Veto Counter | 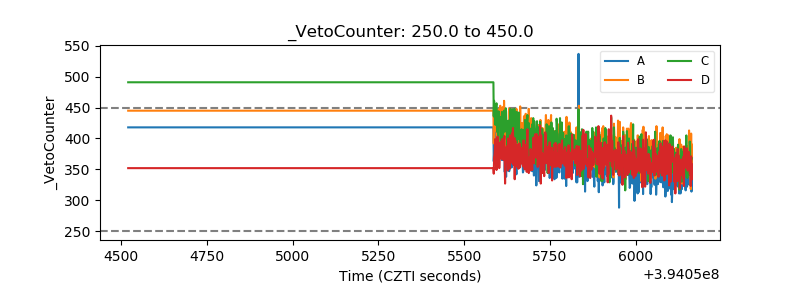 |