| Param | Original file | Final file |
|---|---|---|
| Filename | modeM0/AS1A11_049T04_9000005210cztM0_level2.fits | modeM0/AS1A11_049T04_9000005210cztM0_level2_quad_clean.evt |
| Size (bytes) | 447,569,280 | 442,728,000 |
| Size | 426.8 MB | 422.2 MB |
| Events in quadrant A | 2,785,264 | 2,752,058 |
| Events in quadrant B | 2,555,772 | 2,535,102 |
| Events in quadrant C | 2,676,680 | 2,580,247 |
| Events in quadrant D | 2,295,516 | 2,299,909 |
| Mode M9 | |||
|---|---|---|---|
| Quadrant | BADHDUFLAG | Total packets | Discarded packets |
| A | 0 | 167 | 0 |
| B | 0 | 167 | 0 |
| C | 0 | 167 | 0 |
| D | 0 | 167 | 0 |
| Mode SS | |||
|---|---|---|---|
| Quadrant | BADHDUFLAG | Total packets | Discarded packets |
| A | 0 | 964 | 0 |
| B | 0 | 964 | 0 |
| C | 0 | 964 | 0 |
| D | 0 | 964 | 0 |
| Mode M0 | |||
|---|---|---|---|
| Quadrant | BADHDUFLAG | Total packets | Discarded packets |
| A | 0 | 98509 | 0 |
| B | 0 | 126618 | 0 |
| C | 0 | 100080 | 0 |
| D | 0 | 132896 | 0 |
| Quadrant | Total seconds | Saturated seconds | Saturation percentage |
|---|---|---|---|
| A | 47209 | 91 | 0.192760% |
| B | 47209 | 2740 | 5.803978% |
| C | 47209 | 317 | 0.671482% |
| D | 47209 | 2364 | 5.007520% |
Noise dominated data is calculated using 1-second bins in cleaned event files. If a bin has >2000 counts, and if more than 50% of those come from <1% of pixels, then it is considered to be noise-dominated and hence unusable.
| Quadrant | # 1 sec bins | Bins with >0 counts | Bins with >2000 counts | High rate bins dominated by noise | Noise dominated (total time) | Noise dominated (detector-on time) | Marked lightcurve |
|---|---|---|---|---|---|---|---|
| A | 63908 | 47209 | 0 | 0 | 0.00% | 0.00% |  |
| B | 63908 | 47201 | 0 | 0 | 0.00% | 0.00% |  |
| C | 63908 | 47207 | 0 | 0 | 0.00% | 0.00% |  |
| D | 63908 | 47190 | 0 | 0 | 0.00% | 0.00% |  |
Top three noisy pixels from each quadrant. If the there are fewer than three noisy pixels in the level2.evt file, extra rows are filled as -1
| Pixel properties | Quadrant properties | ||||||
|---|---|---|---|---|---|---|---|
| Quadrant | DetID | PixID | Counts | Sigma | Mean | Median | Sigma |
| A | 7 | 110 | 2335 | 9.37 | 726 | 684 | 176.2 |
| A | 9 | 19 | 2231 | 8.78 | 726 | 684 | 176.2 |
| A | 0 | 29 | 2190 | 8.55 | 726 | 684 | 176.2 |
| B | 2 | 9 | 2131 | 11.01 | 678 | 650 | 134.5 |
| B | 3 | 80 | 1968 | 9.8 | 678 | 650 | 134.5 |
| B | 2 | 8 | 1753 | 8.2 | 678 | 650 | 134.5 |
| C | 1 | 81 | 2201 | 8.49 | 707 | 663 | 181.1 |
| C | 1 | 80 | 2163 | 8.29 | 707 | 663 | 181.1 |
| C | 3 | 203 | 2123 | 8.06 | 707 | 663 | 181.1 |
| D | 4 | 160 | 1748 | 6.53 | 658 | 603 | 175.3 |
| D | 10 | 189 | 1700 | 6.26 | 658 | 603 | 175.3 |
| D | 7 | 3 | 1689 | 6.2 | 658 | 603 | 175.3 |
Histogram calculated using DETX and DETY for each event in the final _common_clean file
| Quadrant A | 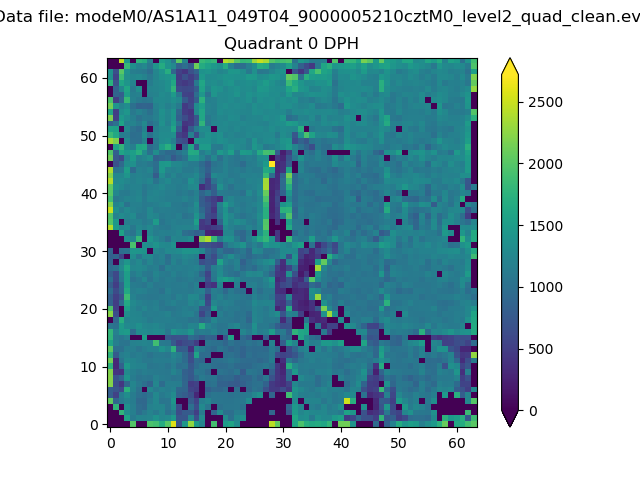 |
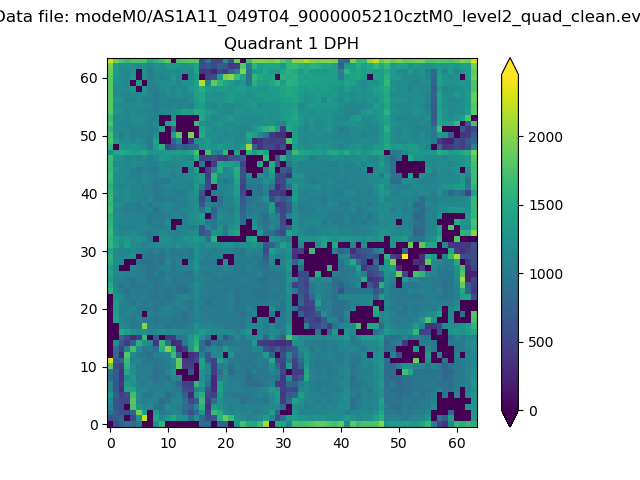 |
Quadrant B |
|---|---|---|---|
| Quadrant D | 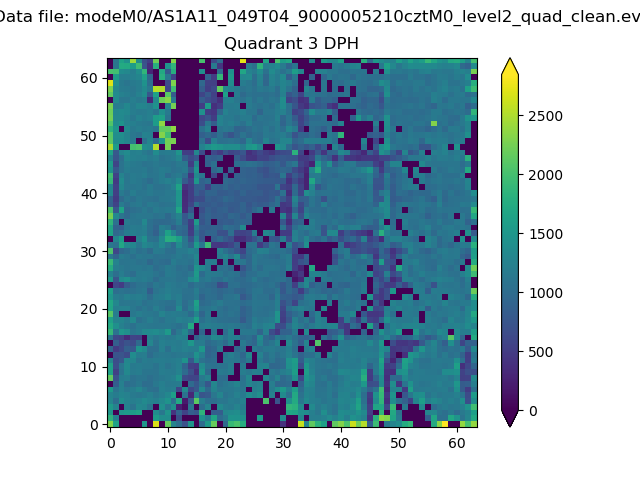 |
 |
Quadrant C |
| Plot type | Count rate plots | Images |
|---|---|---|
| Comparison with Poisson distribution Blue bars denote a histogram of data divided into 1 sec bins. Red curve is a Poisson curve with rate = median count rate of data. |
 |
 |
| Quadrant-wise count rates Data is divided into 100 sec bins |
 |
|
| Module-wise count rates for Quadrant A Data is divided into 100 sec bins |
 |
 |
| Module-wise count rates for Quadrant B Data is divided into 100 sec bins |
 |
 |
| Module-wise count rates for Quadrant C Data is divided into 100 sec bins |
 |
 |
| Module-wise count rates for Quadrant D Data is divided into 100 sec bins |
 |
 |
| Parameter | Plot |
|---|---|
| CZT HV Monitor |  |
| D_VDD |  |
| Temperature 1 |  |
| Veto HV Monitor |  |
| Veto LLD |  |
| Alpha Counter |  |
| _CPM_Rate |  |
| CZT Counter |  |
| +2.5 Volts monitor |  |
| +5 Volts monitor |  |
| _ROLL_ROT |  |
| _Roll_DEC |  |
| _Roll_RA |  |
| Veto Counter |  |