| Param | Original file | Final file |
|---|---|---|
| Filename | modeM0/AS1A11_049T05_9000005212cztM0_level2.fits | modeM0/AS1A11_049T05_9000005212cztM0_level2_quad_clean.evt |
| Size (bytes) | 440,576,640 | 455,359,680 |
| Size | 420.2 MB | 434.3 MB |
| Events in quadrant A | 2,699,462 | 2,819,221 |
| Events in quadrant B | 2,542,480 | 2,722,294 |
| Events in quadrant C | 2,587,936 | 2,623,167 |
| Events in quadrant D | 2,238,618 | 2,352,050 |
| Mode SS | |||
|---|---|---|---|
| Quadrant | BADHDUFLAG | Total packets | Discarded packets |
| A | 0 | 974 | 0 |
| B | 0 | 974 | 0 |
| C | 0 | 974 | 0 |
| D | 0 | 974 | 0 |
| Mode M0 | |||
|---|---|---|---|
| Quadrant | BADHDUFLAG | Total packets | Discarded packets |
| A | 0 | 99289 | 0 |
| B | 0 | 113563 | 0 |
| C | 0 | 101374 | 0 |
| D | 0 | 136106 | 0 |
| Mode M9 | |||
|---|---|---|---|
| Quadrant | BADHDUFLAG | Total packets | Discarded packets |
| A | 0 | 161 | 0 |
| B | 0 | 161 | 0 |
| C | 0 | 161 | 0 |
| D | 0 | 161 | 0 |
| Quadrant | Total seconds | Saturated seconds | Saturation percentage |
|---|---|---|---|
| A | 47701 | 129 | 0.270435% |
| B | 47701 | 951 | 1.993669% |
| C | 47701 | 446 | 0.934991% |
| D | 47701 | 2101 | 4.404520% |
Noise dominated data is calculated using 1-second bins in cleaned event files. If a bin has >2000 counts, and if more than 50% of those come from <1% of pixels, then it is considered to be noise-dominated and hence unusable.
| Quadrant | # 1 sec bins | Bins with >0 counts | Bins with >2000 counts | High rate bins dominated by noise | Noise dominated (total time) | Noise dominated (detector-on time) | Marked lightcurve |
|---|---|---|---|---|---|---|---|
| A | 63826 | 47700 | 0 | 0 | 0.00% | 0.00% |  |
| B | 63826 | 47700 | 0 | 0 | 0.00% | 0.00% |  |
| C | 63826 | 47697 | 0 | 0 | 0.00% | 0.00% |  |
| D | 63826 | 47690 | 0 | 0 | 0.00% | 0.00% |  |
Top three noisy pixels from each quadrant. If the there are fewer than three noisy pixels in the level2.evt file, extra rows are filled as -1
| Pixel properties | Quadrant properties | ||||||
|---|---|---|---|---|---|---|---|
| Quadrant | DetID | PixID | Counts | Sigma | Mean | Median | Sigma |
| A | 9 | 19 | 2266 | 9.19 | 704 | 660 | 174.7 |
| A | 7 | 110 | 2239 | 9.04 | 704 | 660 | 174.7 |
| A | 0 | 29 | 2094 | 8.21 | 704 | 660 | 174.7 |
| B | 2 | 9 | 2215 | 11.95 | 672 | 642 | 131.6 |
| B | 3 | 80 | 1879 | 9.4 | 672 | 642 | 131.6 |
| B | 5 | 128 | 1801 | 8.8 | 672 | 642 | 131.6 |
| C | 3 | 203 | 2074 | 8.15 | 685 | 640 | 175.9 |
| C | 3 | 202 | 2038 | 7.95 | 685 | 640 | 175.9 |
| C | 1 | 65 | 1706 | 6.06 | 685 | 640 | 175.9 |
| D | 10 | 113 | 1639 | 6.07 | 642 | 586 | 173.3 |
| D | 4 | 160 | 1626 | 6.0 | 642 | 586 | 173.3 |
| D | 7 | 3 | 1592 | 5.8 | 642 | 586 | 173.3 |
Histogram calculated using DETX and DETY for each event in the final _common_clean file
| Quadrant A |  |
 |
Quadrant B |
|---|---|---|---|
| Quadrant D |  |
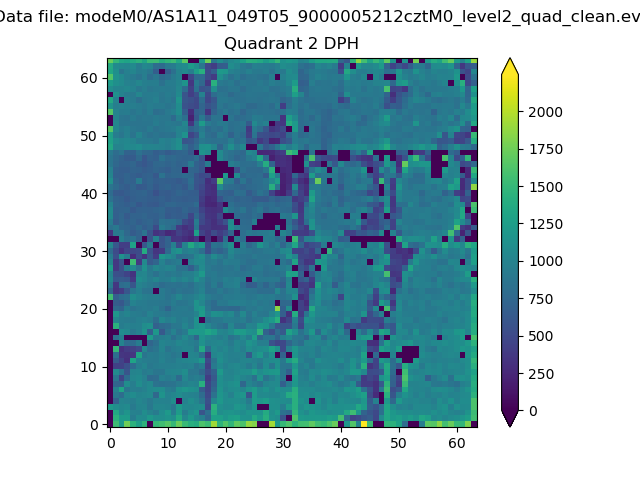 |
Quadrant C |
| Plot type | Count rate plots | Images |
|---|---|---|
| Comparison with Poisson distribution Blue bars denote a histogram of data divided into 1 sec bins. Red curve is a Poisson curve with rate = median count rate of data. |
 |
 |
| Quadrant-wise count rates Data is divided into 100 sec bins |
 |
|
| Module-wise count rates for Quadrant A Data is divided into 100 sec bins |
 |
 |
| Module-wise count rates for Quadrant B Data is divided into 100 sec bins |
 |
 |
| Module-wise count rates for Quadrant C Data is divided into 100 sec bins |
 |
 |
| Module-wise count rates for Quadrant D Data is divided into 100 sec bins |
 |
 |
| Parameter | Plot |
|---|---|
| CZT HV Monitor |  |
| D_VDD |  |
| Temperature 1 |  |
| Veto HV Monitor |  |
| Veto LLD |  |
| Alpha Counter |  |
| _CPM_Rate |  |
| CZT Counter |  |
| +2.5 Volts monitor |  |
| +5 Volts monitor |  |
| _ROLL_ROT |  |
| _Roll_DEC |  |
| _Roll_RA |  |
| Veto Counter |  |