| Param | Original file | Final file |
|---|---|---|
| Filename | modeM0/AS1A11_049T05_9000005212_36502cztM0_level2.evt | modeM0/AS1A11_049T05_9000005212_36502cztM0_level2_quad_clean.evt |
| Size (bytes) | 417,818,880 | 58,556,160 |
| Size | 398.5 MB | 55.8 MB |
| Events in quadrant A | 2,727,496 | 352,334 |
| Events in quadrant B | 3,115,528 | 350,297 |
| Events in quadrant C | 2,945,455 | 346,287 |
| Events in quadrant D | 3,484,038 | 331,629 |
| Mode SS | |||
|---|---|---|---|
| Quadrant | BADHDUFLAG | Total packets | Discarded packets |
| A | 0 | 116 | 0 |
| B | 0 | 116 | 0 |
| C | 0 | 116 | 0 |
| D | 0 | 116 | 0 |
| Mode M0 | |||
|---|---|---|---|
| Quadrant | BADHDUFLAG | Total packets | Discarded packets |
| A | 0 | 11600 | 3 |
| B | 0 | 12858 | 2 |
| C | 0 | 12073 | 2 |
| D | 0 | 14187 | 2 |
| Mode M9 | |||
|---|---|---|---|
| Quadrant | BADHDUFLAG | Total packets | Discarded packets |
| A | 0 | 20 | 0 |
| B | 0 | 20 | 0 |
| C | 0 | 20 | 0 |
| D | 0 | 21 | 0 |
| Quadrant | Total seconds | Saturated seconds | Saturation percentage |
|---|---|---|---|
| A | 5602 | 8 | 0.142806% |
| B | 5602 | 114 | 2.034988% |
| C | 5602 | 96 | 1.713674% |
| D | 5602 | 98 | 1.749375% |
Noise dominated data is calculated using 1-second bins in cleaned event files. If a bin has >2000 counts, and if more than 50% of those come from <1% of pixels, then it is considered to be noise-dominated and hence unusable.
| Quadrant | # 1 sec bins | Bins with >0 counts | Bins with >2000 counts | High rate bins dominated by noise | Noise dominated (total time) | Noise dominated (detector-on time) | Marked lightcurve |
|---|---|---|---|---|---|---|---|
| A | 7244 | 5603 | 3 | 3 | 0.04% | 0.05% | 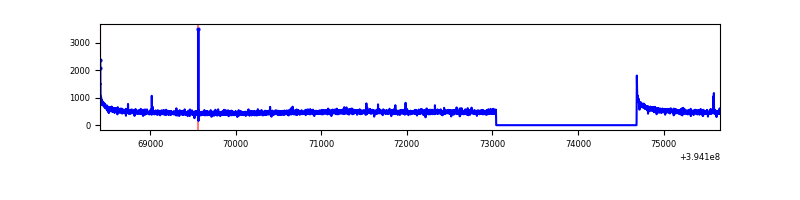 |
| B | 7244 | 5603 | 61 | 61 | 0.84% | 1.09% | 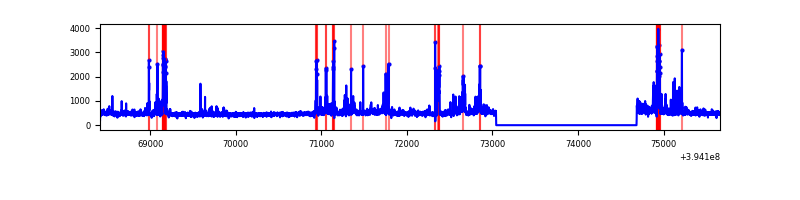 |
| C | 7244 | 5603 | 54 | 54 | 0.75% | 0.96% | 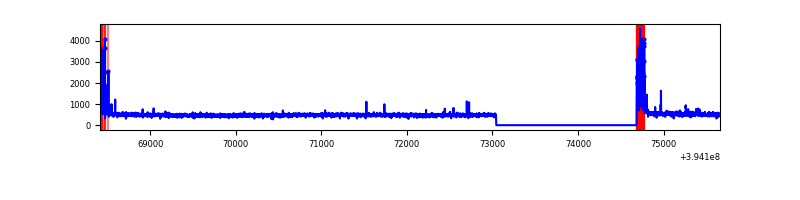 |
| D | 7244 | 5603 | 62 | 62 | 0.86% | 1.11% | 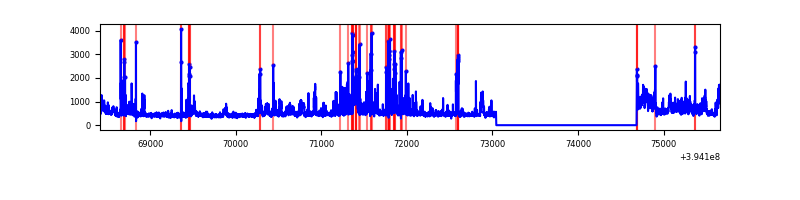 |
Top three noisy pixels from each quadrant. If the there are fewer than three noisy pixels in the level2.evt file, extra rows are filled as -1
| Pixel properties | Quadrant properties | ||||||
|---|---|---|---|---|---|---|---|
| Quadrant | DetID | PixID | Counts | Sigma | Mean | Median | Sigma |
| A | 10 | 83 | 205957 | 1578.45 | 648 | 636 | 130.1 |
| A | 13 | 254 | 9201 | 65.85 | 648 | 636 | 130.1 |
| A | 3 | 137 | 6778 | 47.22 | 648 | 636 | 130.1 |
| B | 5 | 172 | 300065 | 2455.78 | 637 | 621 | 121.9 |
| B | 4 | 171 | 117239 | 956.4 | 637 | 621 | 121.9 |
| B | 5 | 255 | 90770 | 739.32 | 637 | 621 | 121.9 |
| C | 0 | 10 | 279802 | 1928.62 | 621 | 625 | 144.8 |
| C | 15 | 214 | 241590 | 1664.64 | 621 | 625 | 144.8 |
| C | 13 | 61 | 4142 | 24.3 | 621 | 625 | 144.8 |
| D | 12 | 227 | 579292 | 3809.96 | 624 | 606 | 151.9 |
| D | 13 | 249 | 138229 | 906.08 | 624 | 606 | 151.9 |
| D | 2 | 153 | 102213 | 668.96 | 624 | 606 | 151.9 |
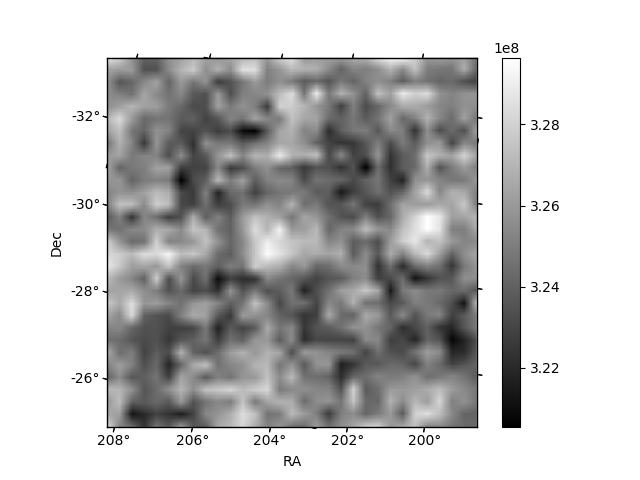
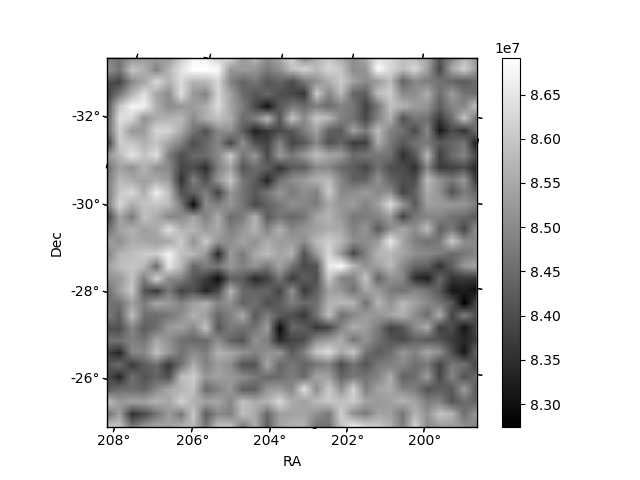
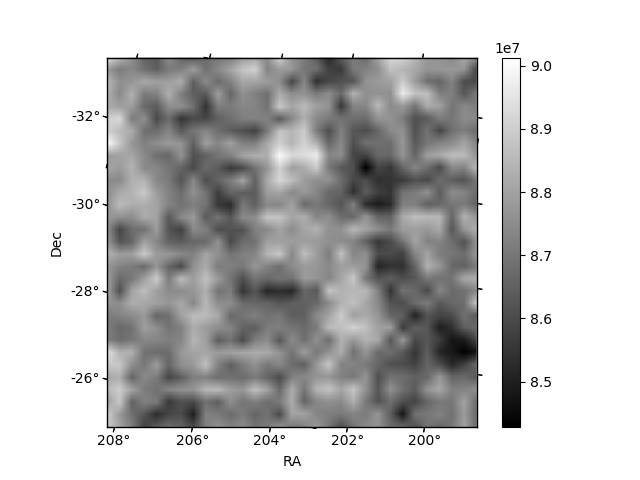
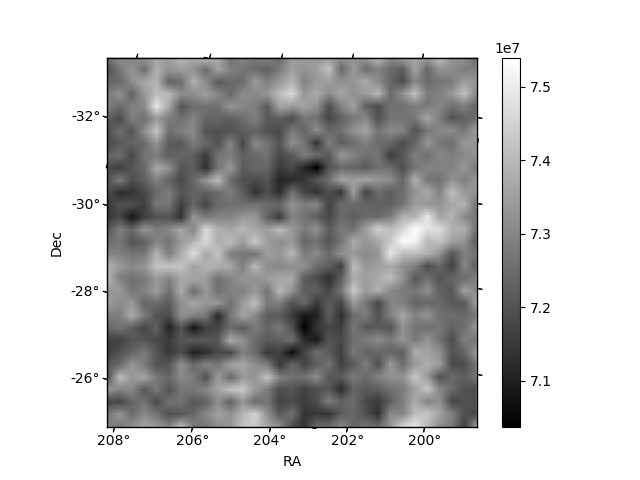
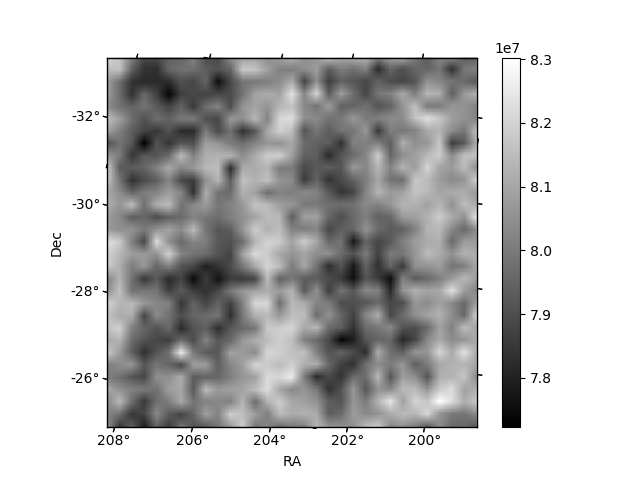
Histogram calculated using DETX and DETY for each event in the final _common_clean file
| Quadrant A | 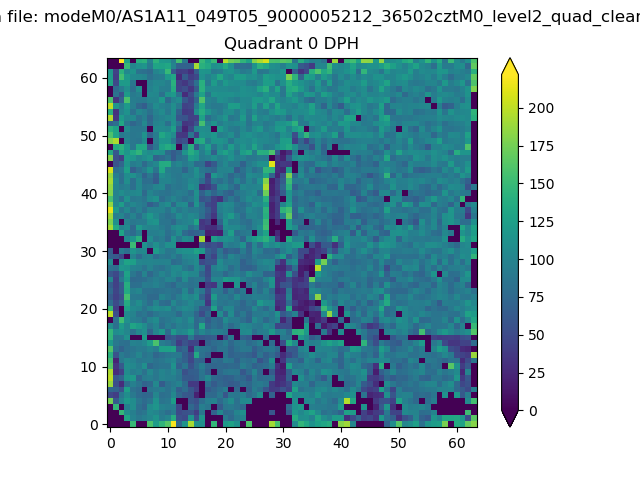 |
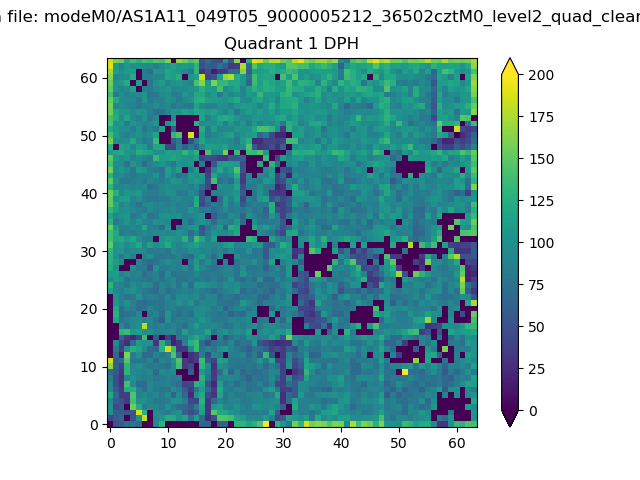 |
Quadrant B |
|---|---|---|---|
| Quadrant D | 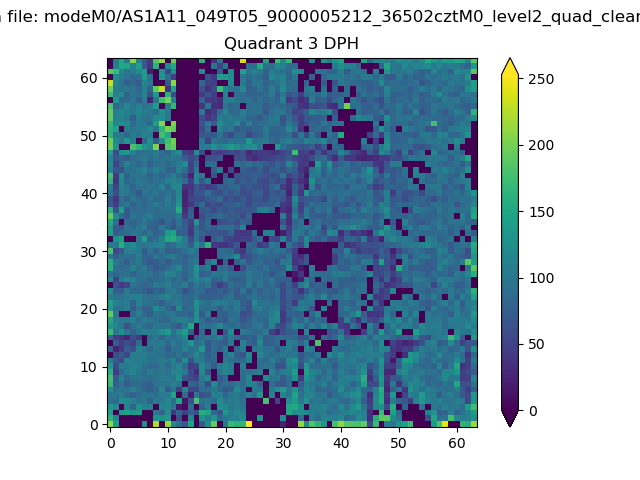 |
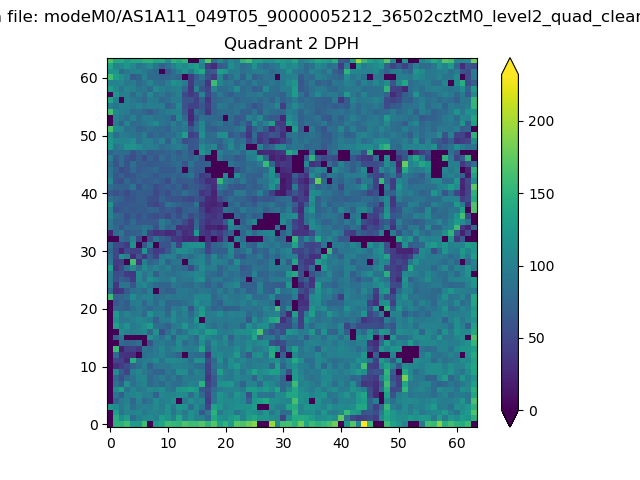 |
Quadrant C |
| Plot type | Count rate plots | Images |
|---|---|---|
| Comparison with Poisson distribution Blue bars denote a histogram of data divided into 1 sec bins. Red curve is a Poisson curve with rate = median count rate of data. |
 |
 |
| Quadrant-wise count rates Data is divided into 100 sec bins |
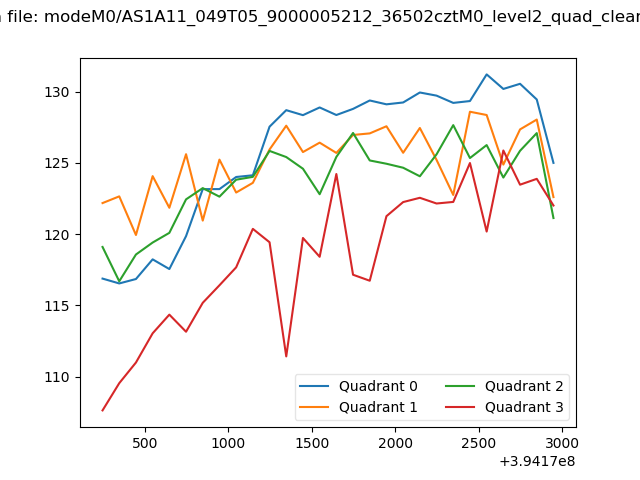 |
|
| Module-wise count rates for Quadrant A Data is divided into 100 sec bins |
 |
 |
| Module-wise count rates for Quadrant B Data is divided into 100 sec bins |
 |
 |
| Module-wise count rates for Quadrant C Data is divided into 100 sec bins |
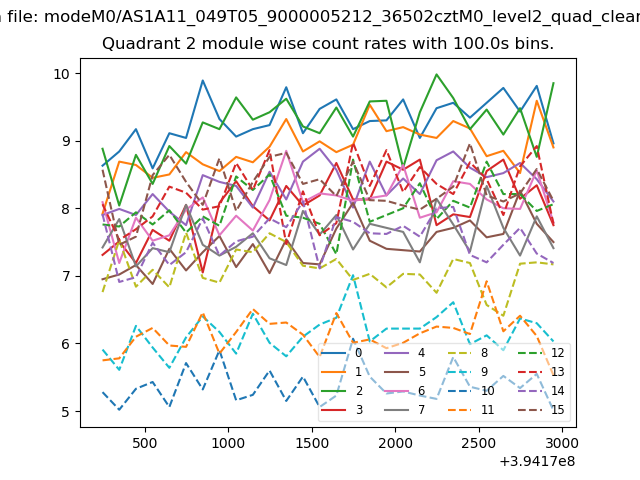 |
 |
| Module-wise count rates for Quadrant D Data is divided into 100 sec bins |
 |
 |
| Parameter | Plot |
|---|---|
| CZT HV Monitor | 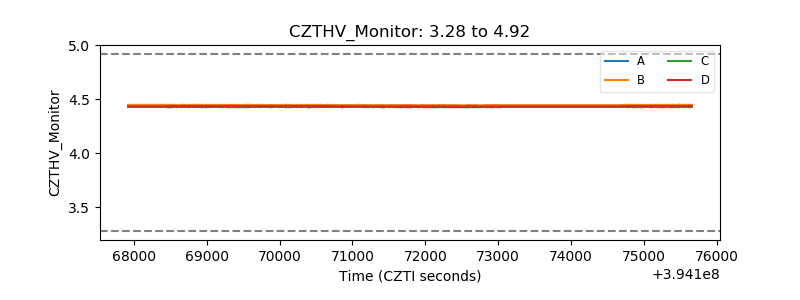 |
| D_VDD | 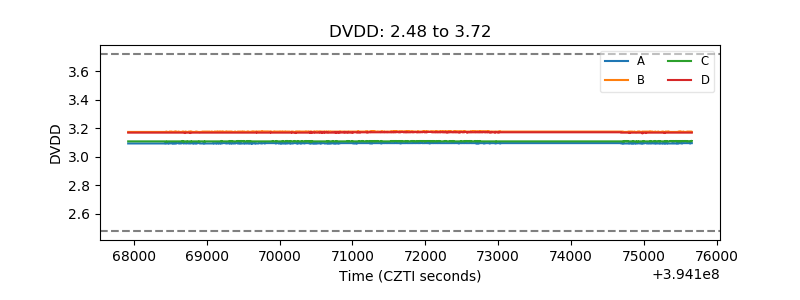 |
| Temperature 1 | 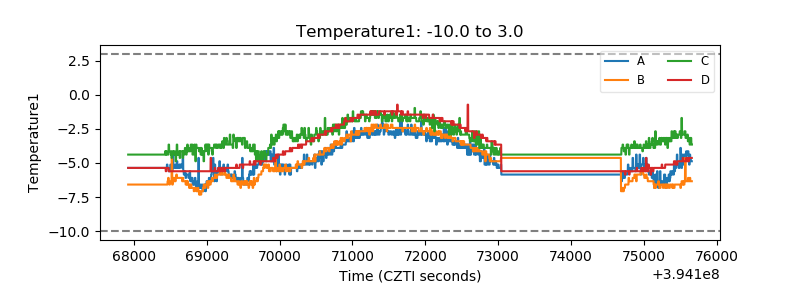 |
| Veto HV Monitor | 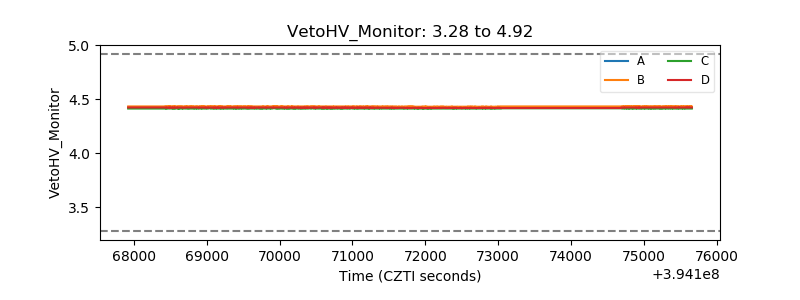 |
| Veto LLD | 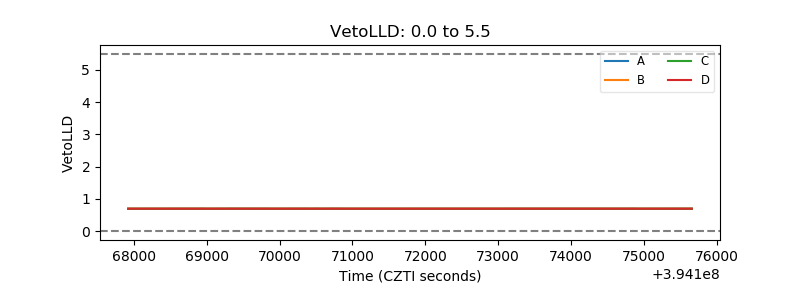 |
| Alpha Counter | 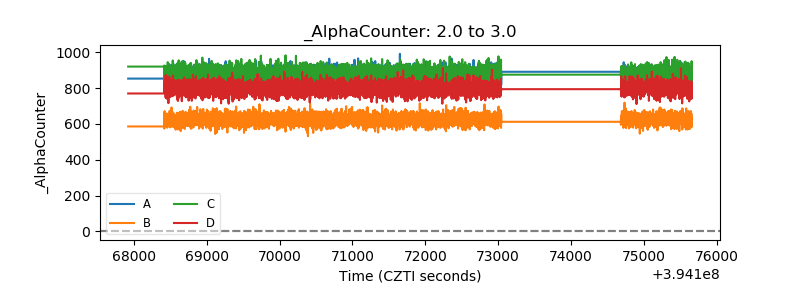 |
| _CPM_Rate | 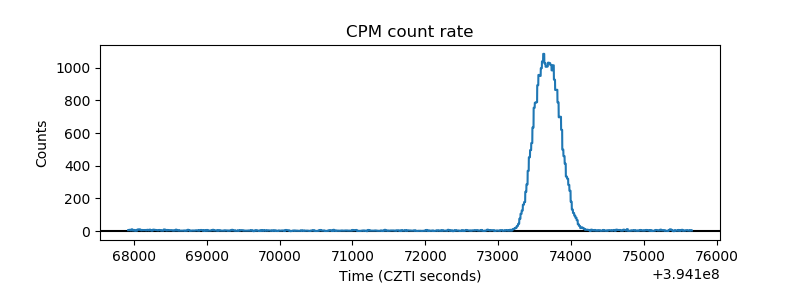 |
| CZT Counter | 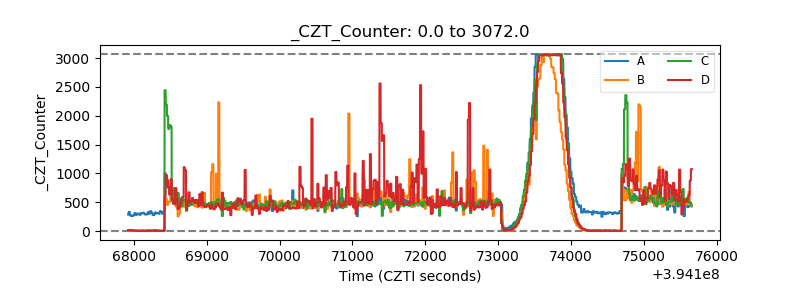 |
| +2.5 Volts monitor |  |
| +5 Volts monitor |  |
| _ROLL_ROT | 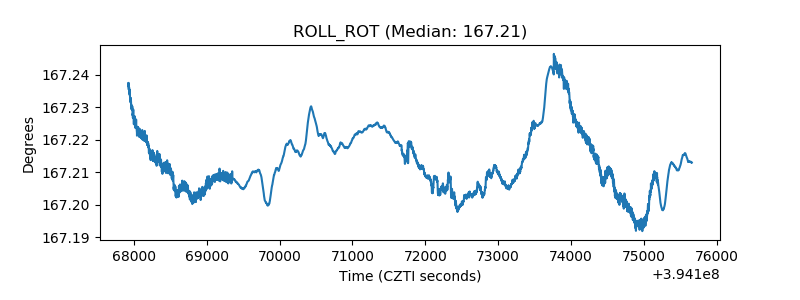 |
| _Roll_DEC | 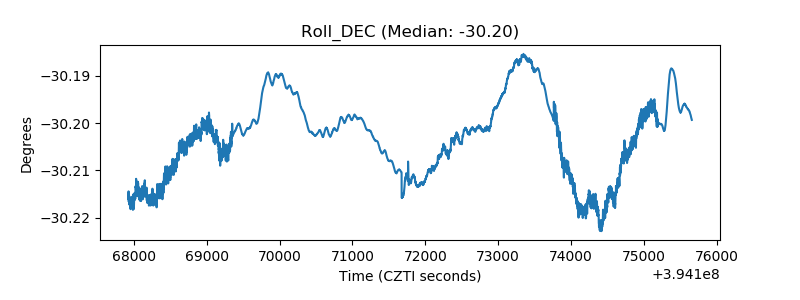 |
| _Roll_RA | 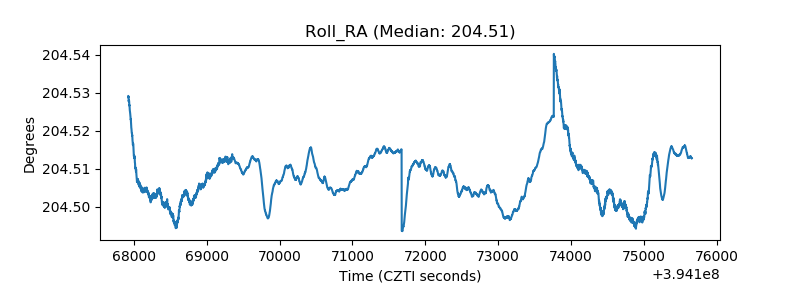 |
| Veto Counter |  |