| Param | Original file | Final file |
|---|---|---|
| Filename | modeM0/AS1T05_035T01_9000005214cztM0_level2.fits | modeM0/AS1T05_035T01_9000005214cztM0_level2_quad_clean.evt |
| Size (bytes) | 680,500,800 | 660,746,880 |
| Size | 649.0 MB | 630.1 MB |
| Events in quadrant A | 4,264,736 | 4,097,990 |
| Events in quadrant B | 4,009,578 | 3,992,351 |
| Events in quadrant C | 4,112,666 | 3,870,363 |
| Events in quadrant D | 3,409,748 | 3,239,225 |
| Mode M0 | |||
|---|---|---|---|
| Quadrant | BADHDUFLAG | Total packets | Discarded packets |
| A | 0 | 148936 | 0 |
| B | 0 | 168295 | 0 |
| C | 0 | 150968 | 0 |
| D | 0 | 228591 | 0 |
| Mode SS | |||
|---|---|---|---|
| Quadrant | BADHDUFLAG | Total packets | Discarded packets |
| A | 0 | 1434 | 0 |
| B | 0 | 1434 | 0 |
| C | 0 | 1434 | 0 |
| D | 0 | 1434 | 0 |
| Mode M9 | |||
|---|---|---|---|
| Quadrant | BADHDUFLAG | Total packets | Discarded packets |
| A | 0 | 281 | 0 |
| B | 0 | 281 | 0 |
| C | 0 | 281 | 0 |
| D | 0 | 281 | 0 |
| Quadrant | Total seconds | Saturated seconds | Saturation percentage |
|---|---|---|---|
| A | 70148 | 203 | 0.289388% |
| B | 70148 | 1335 | 1.903119% |
| C | 70148 | 528 | 0.752694% |
| D | 70148 | 6461 | 9.210526% |
Noise dominated data is calculated using 1-second bins in cleaned event files. If a bin has >2000 counts, and if more than 50% of those come from <1% of pixels, then it is considered to be noise-dominated and hence unusable.
| Quadrant | # 1 sec bins | Bins with >0 counts | Bins with >2000 counts | High rate bins dominated by noise | Noise dominated (total time) | Noise dominated (detector-on time) | Marked lightcurve |
|---|---|---|---|---|---|---|---|
| A | 98175 | 70148 | 0 | 0 | 0.00% | 0.00% | 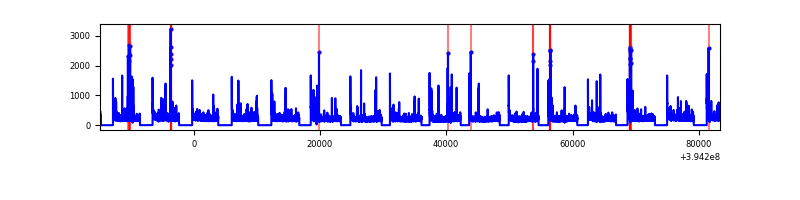 |
| B | 98175 | 70144 | 0 | 0 | 0.00% | 0.00% | 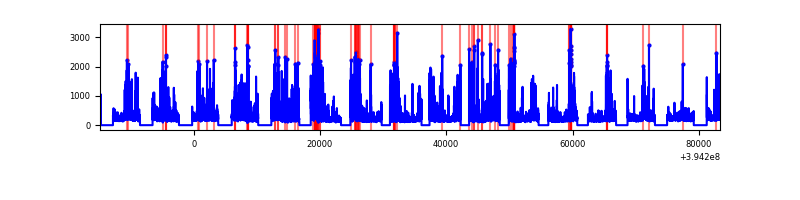 |
| C | 98175 | 70134 | 0 | 0 | 0.00% | 0.00% |  |
| D | 98175 | 70059 | 0 | 0 | 0.00% | 0.00% |  |
Top three noisy pixels from each quadrant. If the there are fewer than three noisy pixels in the level2.evt file, extra rows are filled as -1
| Pixel properties | Quadrant properties | ||||||
|---|---|---|---|---|---|---|---|
| Quadrant | DetID | PixID | Counts | Sigma | Mean | Median | Sigma |
| A | 7 | 110 | 3472 | 8.94 | 1113 | 1048 | 271.2 |
| A | 9 | 19 | 3340 | 8.45 | 1113 | 1048 | 271.2 |
| A | 0 | 29 | 3303 | 8.31 | 1113 | 1048 | 271.2 |
| B | 2 | 9 | 3450 | 11.79 | 1062 | 1016 | 206.5 |
| B | 3 | 80 | 2985 | 9.54 | 1062 | 1016 | 206.5 |
| B | 2 | 8 | 2823 | 8.75 | 1062 | 1016 | 206.5 |
| C | 1 | 81 | 3402 | 8.61 | 1085 | 1020 | 276.7 |
| C | 1 | 80 | 3254 | 8.07 | 1085 | 1020 | 276.7 |
| C | 3 | 203 | 3231 | 7.99 | 1085 | 1020 | 276.7 |
| D | 10 | 189 | 2570 | 6.6 | 977 | 894 | 253.9 |
| D | 7 | 3 | 2566 | 6.59 | 977 | 894 | 253.9 |
| D | 6 | 38 | 2493 | 6.3 | 977 | 894 | 253.9 |
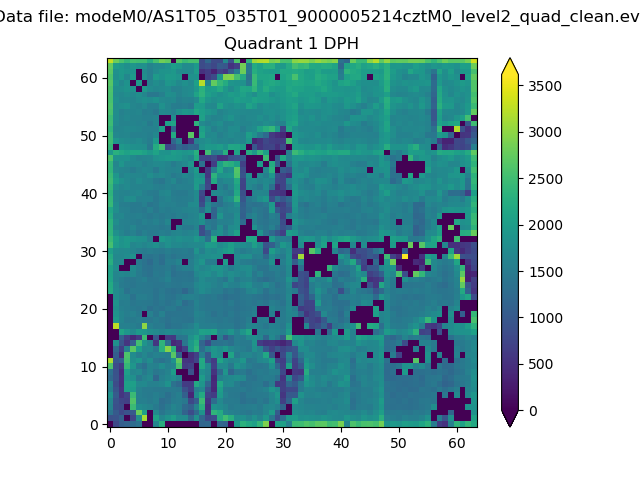
Histogram calculated using DETX and DETY for each event in the final _common_clean file
| Quadrant A |  |
 |
Quadrant B |
|---|---|---|---|
| Quadrant D | 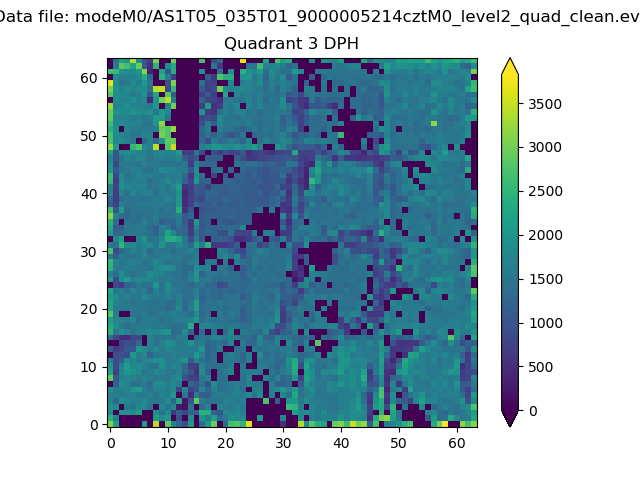 |
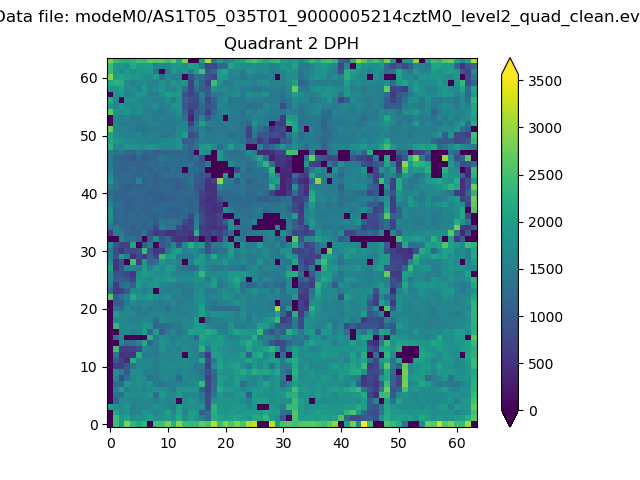 |
Quadrant C |
| Plot type | Count rate plots | Images |
|---|---|---|
| Comparison with Poisson distribution Blue bars denote a histogram of data divided into 1 sec bins. Red curve is a Poisson curve with rate = median count rate of data. |
 |
 |
| Quadrant-wise count rates Data is divided into 100 sec bins |
 |
|
| Module-wise count rates for Quadrant A Data is divided into 100 sec bins |
 |
 |
| Module-wise count rates for Quadrant B Data is divided into 100 sec bins |
 |
 |
| Module-wise count rates for Quadrant C Data is divided into 100 sec bins |
 |
 |
| Module-wise count rates for Quadrant D Data is divided into 100 sec bins |
 |
 |
| Parameter | Plot |
|---|---|
| CZT HV Monitor |  |
| D_VDD | 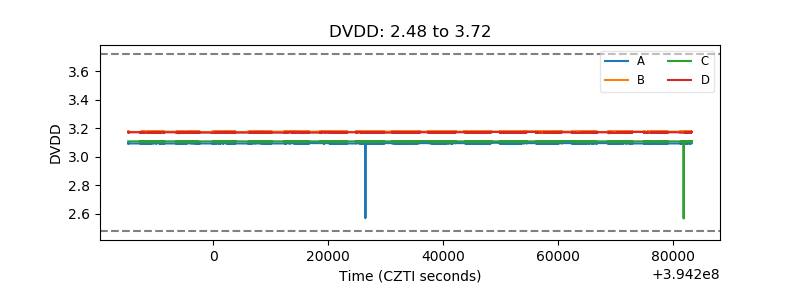 |
| Temperature 1 |  |
| Veto HV Monitor |  |
| Veto LLD |  |
| Alpha Counter |  |
| _CPM_Rate | 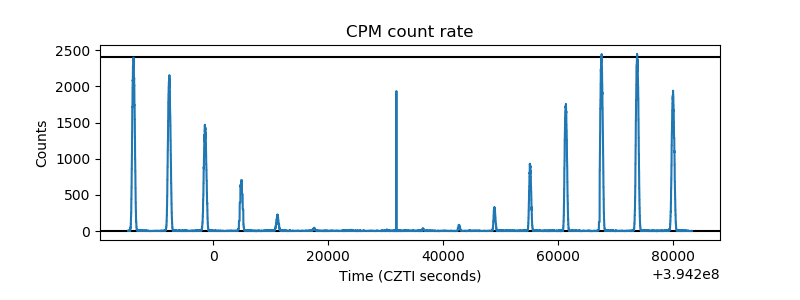 |
| CZT Counter |  |
| +2.5 Volts monitor |  |
| +5 Volts monitor |  |
| _ROLL_ROT | 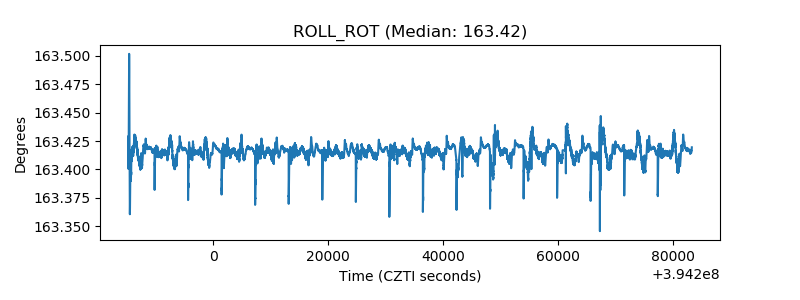 |
| _Roll_DEC |  |
| _Roll_RA | 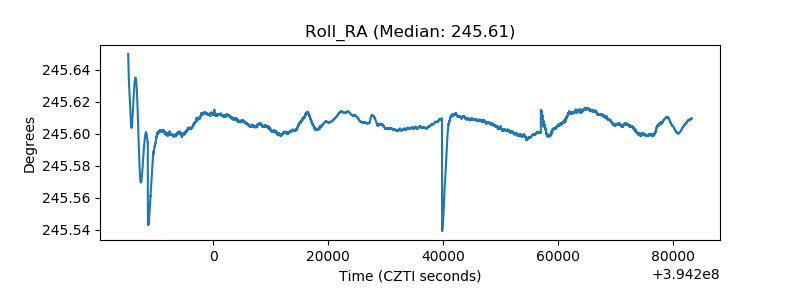 |
| Veto Counter |  |