| Param | Original file | Final file |
|---|---|---|
| Filename | modeM0/AS1T05_035T01_9000005214_36509cztM0_level2.evt | modeM0/AS1T05_035T01_9000005214_36509cztM0_level2_quad_clean.evt |
| Size (bytes) | 526,083,840 | 88,153,920 |
| Size | 501.7 MB | 84.1 MB |
| Events in quadrant A | 2,598,032 | 619,481 |
| Events in quadrant B | 3,359,677 | 612,865 |
| Events in quadrant C | 2,696,618 | 605,974 |
| Events in quadrant D | 6,942,620 | 483,363 |
| Mode M0 | |||
|---|---|---|---|
| Quadrant | BADHDUFLAG | Total packets | Discarded packets |
| A | 0 | 10724 | 3 |
| B | 0 | 13234 | 2 |
| C | 0 | 10833 | 2 |
| D | 0 | 24050 | 2 |
| Mode SS | |||
|---|---|---|---|
| Quadrant | BADHDUFLAG | Total packets | Discarded packets |
| A | 0 | 100 | 0 |
| B | 0 | 100 | 0 |
| C | 0 | 100 | 0 |
| D | 0 | 100 | 0 |
| Mode M9 | |||
|---|---|---|---|
| Quadrant | BADHDUFLAG | Total packets | Discarded packets |
| A | 0 | 23 | 0 |
| B | 0 | 23 | 0 |
| C | 0 | 23 | 0 |
| D | 0 | 24 | 0 |
| Quadrant | Total seconds | Saturated seconds | Saturation percentage |
|---|---|---|---|
| A | 4956 | 8 | 0.161421% |
| B | 4956 | 136 | 2.744149% |
| C | 4956 | 55 | 1.109766% |
| D | 4956 | 1349 | 27.219532% |
Noise dominated data is calculated using 1-second bins in cleaned event files. If a bin has >2000 counts, and if more than 50% of those come from <1% of pixels, then it is considered to be noise-dominated and hence unusable.
| Quadrant | # 1 sec bins | Bins with >0 counts | Bins with >2000 counts | High rate bins dominated by noise | Noise dominated (total time) | Noise dominated (detector-on time) | Marked lightcurve |
|---|---|---|---|---|---|---|---|
| A | 7050 | 4957 | 1 | 1 | 0.01% | 0.02% | 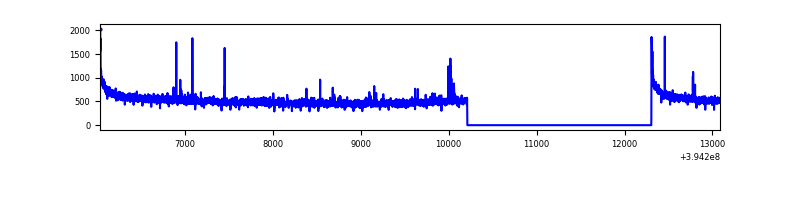 |
| B | 7050 | 4957 | 92 | 92 | 1.30% | 1.86% | 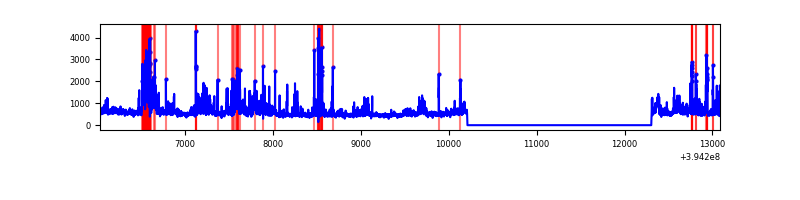 |
| C | 7050 | 4957 | 36 | 36 | 0.51% | 0.73% | 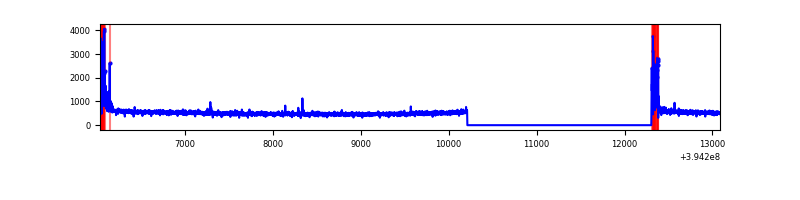 |
| D | 7050 | 4957 | 1185 | 1185 | 16.81% | 23.91% | 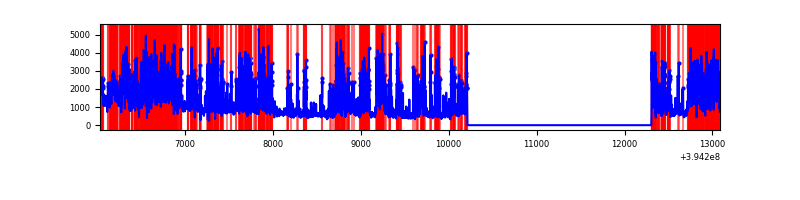 |
Top three noisy pixels from each quadrant. If the there are fewer than three noisy pixels in the level2.evt file, extra rows are filled as -1
| Pixel properties | Quadrant properties | ||||||
|---|---|---|---|---|---|---|---|
| Quadrant | DetID | PixID | Counts | Sigma | Mean | Median | Sigma |
| A | 10 | 83 | 194798 | 1581.34 | 609 | 600 | 122.8 |
| A | 7 | 3 | 16048 | 125.79 | 609 | 600 | 122.8 |
| A | 9 | 143 | 13919 | 108.46 | 609 | 600 | 122.8 |
| B | 5 | 172 | 518094 | 4630.75 | 590 | 576 | 111.8 |
| B | 4 | 171 | 213142 | 1902.04 | 590 | 576 | 111.8 |
| B | 5 | 255 | 80232 | 712.76 | 590 | 576 | 111.8 |
| C | 15 | 214 | 215547 | 1575.58 | 580 | 585 | 136.4 |
| C | 0 | 10 | 213038 | 1557.19 | 580 | 585 | 136.4 |
| C | 10 | 49 | 4907 | 31.68 | 580 | 585 | 136.4 |
| D | 12 | 227 | 3531838 | 27354.31 | 517 | 505 | 129.1 |
| D | 12 | 235 | 498685 | 3858.99 | 517 | 505 | 129.1 |
| D | 2 | 250 | 221761 | 1713.89 | 517 | 505 | 129.1 |
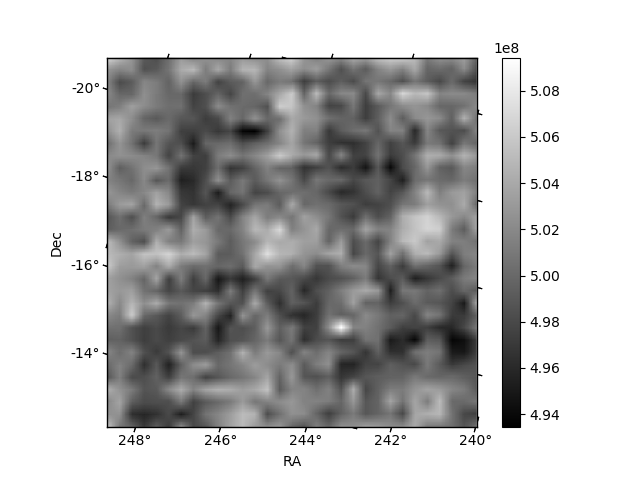
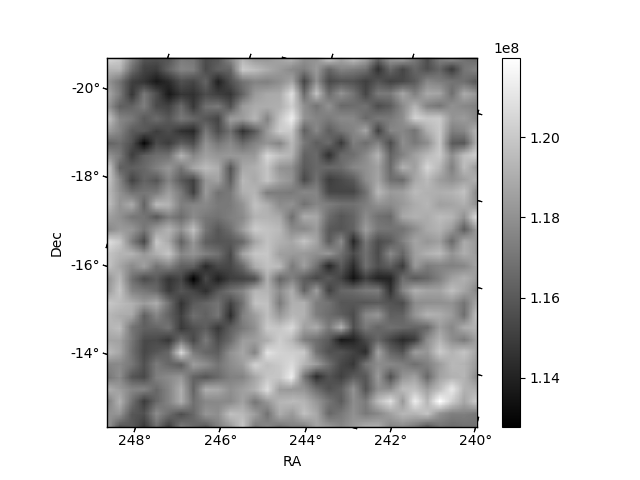
Histogram calculated using DETX and DETY for each event in the final _common_clean file
| Quadrant A | 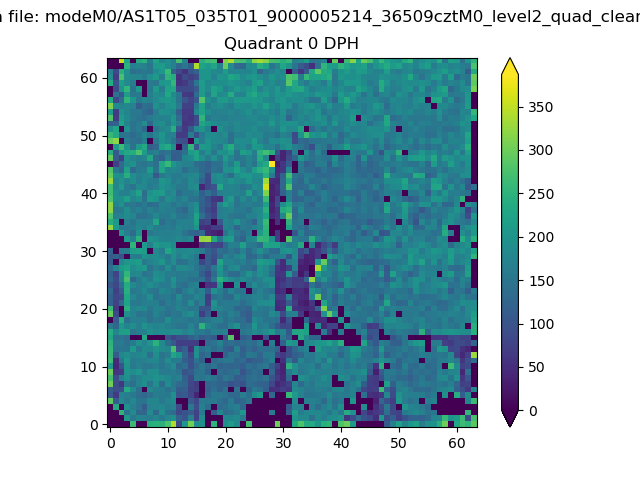 |
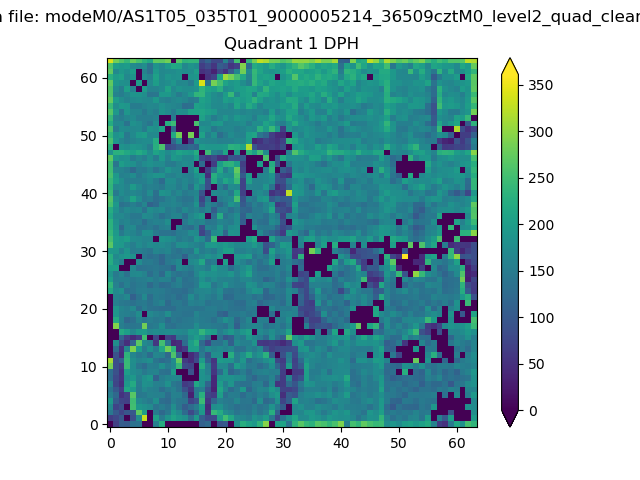 |
Quadrant B |
|---|---|---|---|
| Quadrant D | 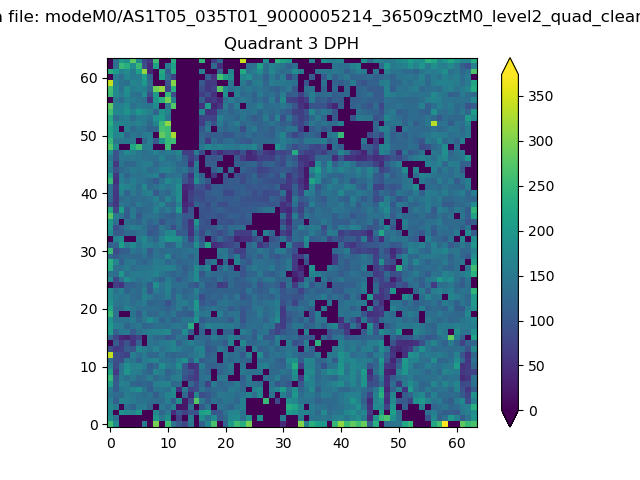 |
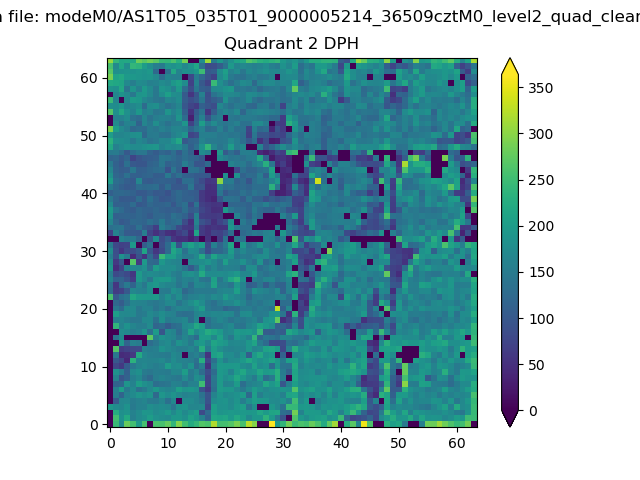 |
Quadrant C |
| Plot type | Count rate plots | Images |
|---|---|---|
| Comparison with Poisson distribution Blue bars denote a histogram of data divided into 1 sec bins. Red curve is a Poisson curve with rate = median count rate of data. |
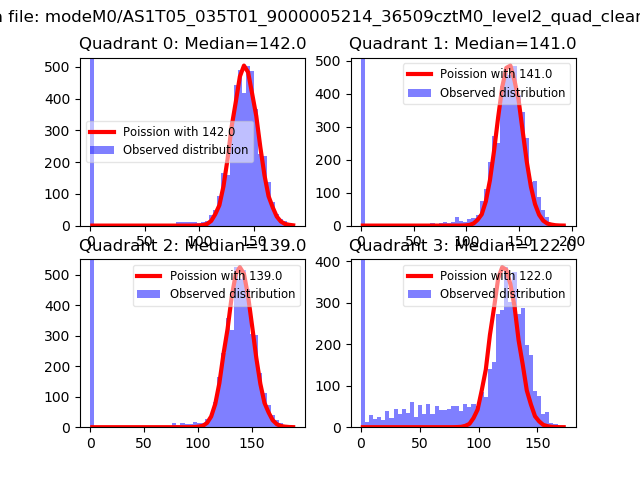 |
 |
| Quadrant-wise count rates Data is divided into 100 sec bins |
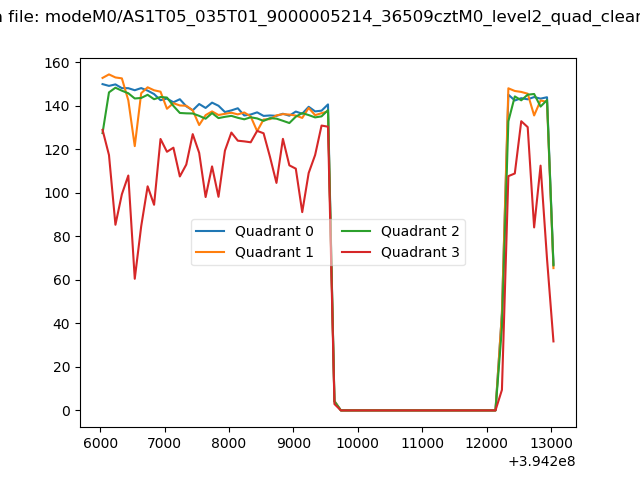 |
|
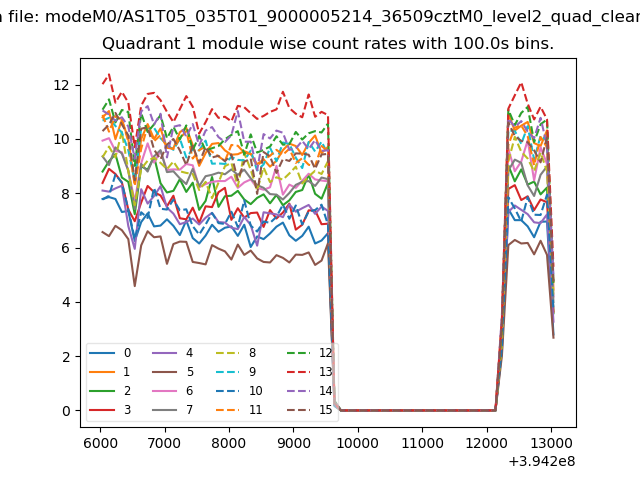
| Module-wise count rates for Quadrant A Data is divided into 100 sec bins |
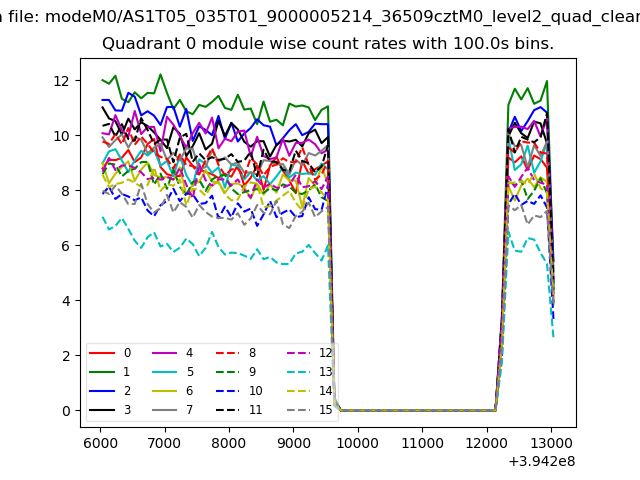 |
 |
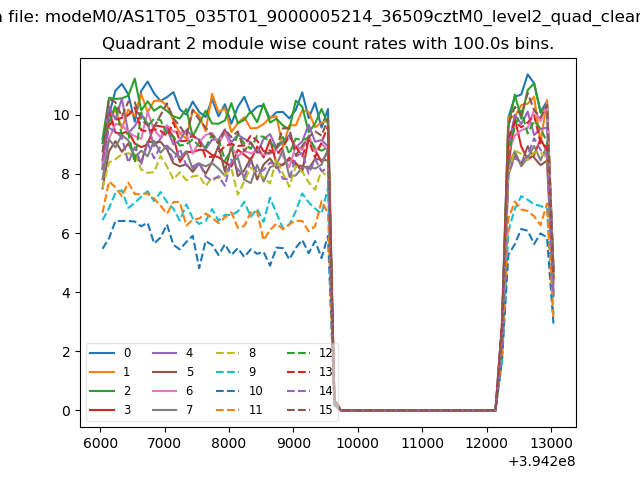
| Module-wise count rates for Quadrant B Data is divided into 100 sec bins |
 |
 |
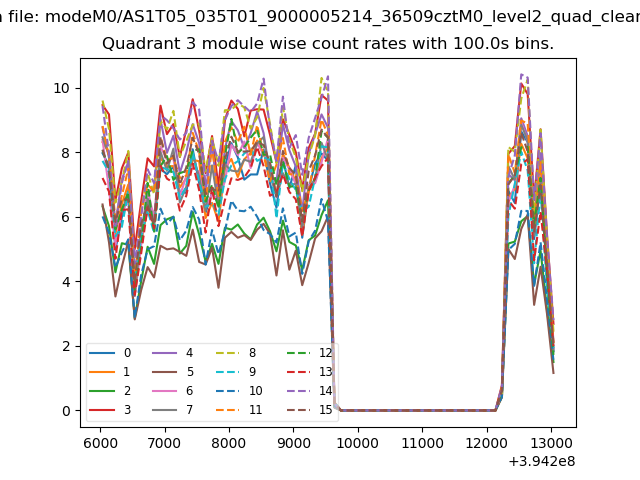
| Module-wise count rates for Quadrant C Data is divided into 100 sec bins |
 |
 |
| Module-wise count rates for Quadrant D Data is divided into 100 sec bins |
 |
 |
| Parameter | Plot |
|---|---|
| CZT HV Monitor | 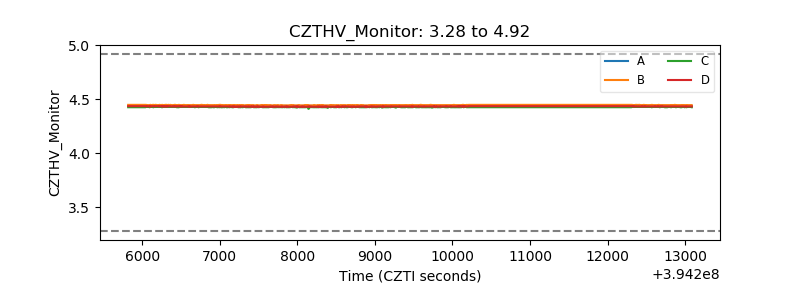 |
| D_VDD |  |
| Temperature 1 |  |
| Veto HV Monitor |  |
| Veto LLD | 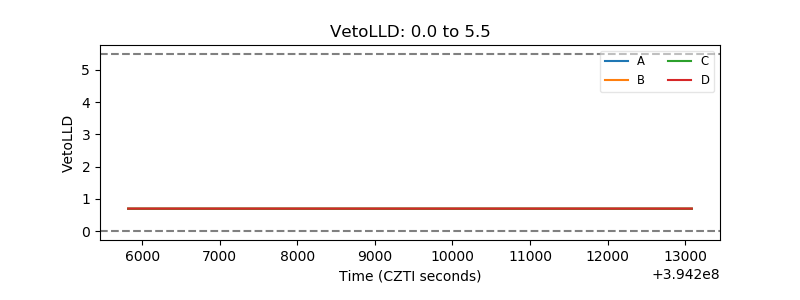 |
| Alpha Counter | 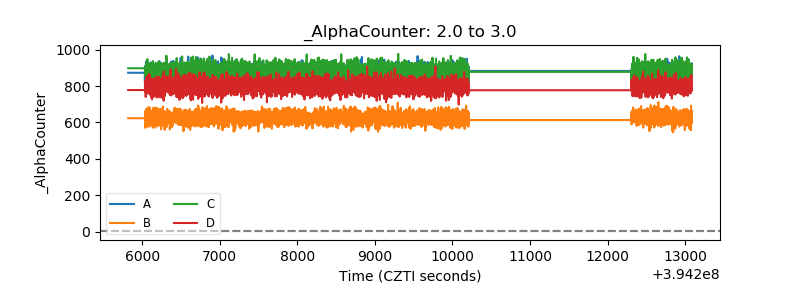 |
| _CPM_Rate | 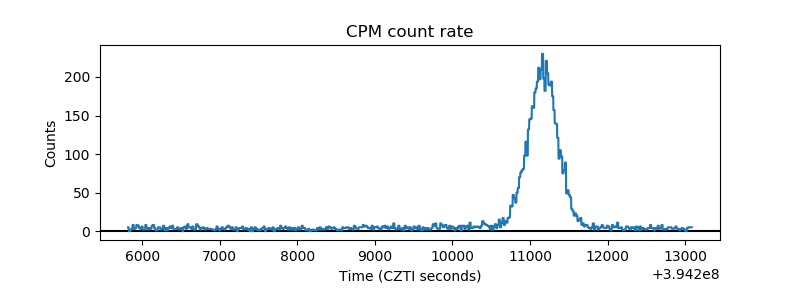 |
| CZT Counter | 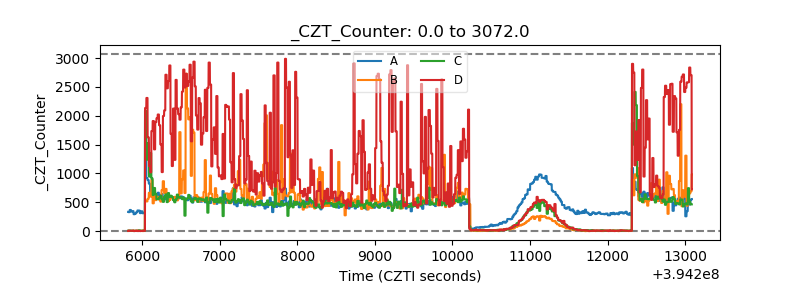 |
| +2.5 Volts monitor |  |
| +5 Volts monitor |  |
| _ROLL_ROT | 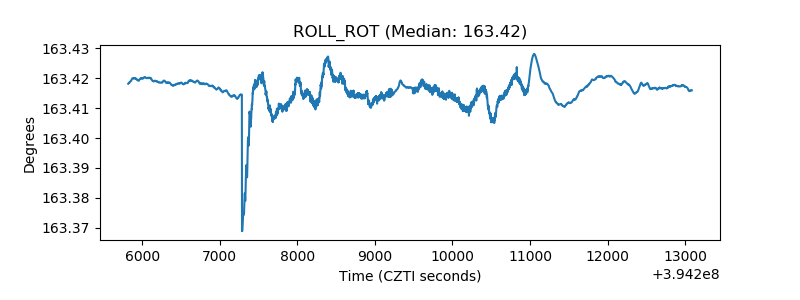 |
| _Roll_DEC |  |
| _Roll_RA | 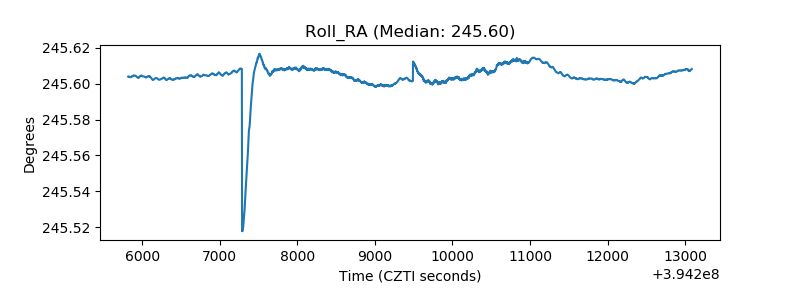 |
| Veto Counter | 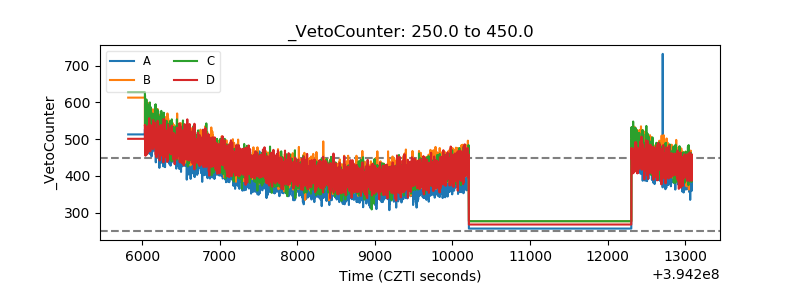 |