| Param | Original file | Final file |
|---|---|---|
| Filename | modeM0/AS1T05_035T01_9000005214_36512cztM0_level2.evt | modeM0/AS1T05_035T01_9000005214_36512cztM0_level2_quad_clean.evt |
| Size (bytes) | 525,029,760 | 74,439,360 |
| Size | 500.7 MB | 71.0 MB |
| Events in quadrant A | 3,053,214 | 474,483 |
| Events in quadrant B | 3,846,213 | 466,876 |
| Events in quadrant C | 3,167,443 | 466,135 |
| Events in quadrant D | 5,415,573 | 415,846 |
| Mode M0 | |||
|---|---|---|---|
| Quadrant | BADHDUFLAG | Total packets | Discarded packets |
| A | 0 | 13039 | 3 |
| B | 0 | 15378 | 2 |
| C | 0 | 13228 | 2 |
| D | 0 | 20150 | 2 |
| Mode SS | |||
|---|---|---|---|
| Quadrant | BADHDUFLAG | Total packets | Discarded packets |
| A | 0 | 128 | 0 |
| B | 0 | 128 | 0 |
| C | 0 | 128 | 0 |
| D | 0 | 128 | 0 |
| Mode M9 | |||
|---|---|---|---|
| Quadrant | BADHDUFLAG | Total packets | Discarded packets |
| A | 0 | 27 | 0 |
| B | 0 | 27 | 0 |
| C | 0 | 27 | 0 |
| D | 0 | 27 | 0 |
| Quadrant | Total seconds | Saturated seconds | Saturation percentage |
|---|---|---|---|
| A | 6165 | 19 | 0.308191% |
| B | 6165 | 129 | 2.092457% |
| C | 6165 | 53 | 0.859692% |
| D | 6165 | 583 | 9.456610% |
Noise dominated data is calculated using 1-second bins in cleaned event files. If a bin has >2000 counts, and if more than 50% of those come from <1% of pixels, then it is considered to be noise-dominated and hence unusable.
| Quadrant | # 1 sec bins | Bins with >0 counts | Bins with >2000 counts | High rate bins dominated by noise | Noise dominated (total time) | Noise dominated (detector-on time) | Marked lightcurve |
|---|---|---|---|---|---|---|---|
| A | 8969 | 6167 | 5 | 5 | 0.06% | 0.08% |  |
| B | 8969 | 6167 | 92 | 92 | 1.03% | 1.49% |  |
| C | 8969 | 6167 | 35 | 35 | 0.39% | 0.57% | 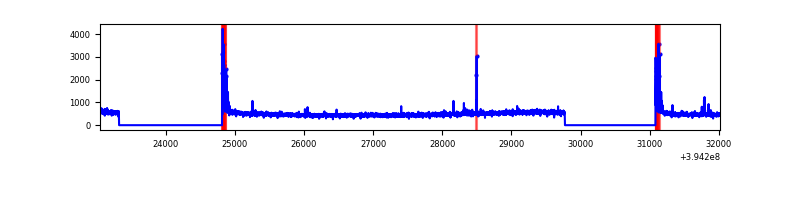 |
| D | 8969 | 6167 | 561 | 561 | 6.25% | 9.10% | 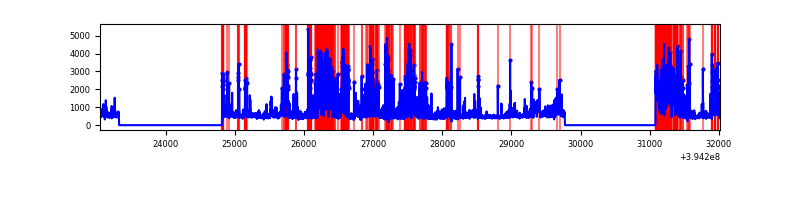 |
Top three noisy pixels from each quadrant. If the there are fewer than three noisy pixels in the level2.evt file, extra rows are filled as -1
| Pixel properties | Quadrant properties | ||||||
|---|---|---|---|---|---|---|---|
| Quadrant | DetID | PixID | Counts | Sigma | Mean | Median | Sigma |
| A | 10 | 83 | 219139 | 1516.86 | 716 | 703 | 144.0 |
| A | 15 | 223 | 28464 | 192.78 | 716 | 703 | 144.0 |
| A | 7 | 3 | 15865 | 105.29 | 716 | 703 | 144.0 |
| B | 4 | 171 | 525058 | 3832.65 | 708 | 689 | 136.8 |
| B | 0 | 229 | 192425 | 1401.41 | 708 | 689 | 136.8 |
| B | 5 | 172 | 137813 | 1002.25 | 708 | 689 | 136.8 |
| C | 15 | 214 | 263586 | 1616.05 | 692 | 696 | 162.7 |
| C | 0 | 10 | 179685 | 1100.29 | 692 | 696 | 162.7 |
| C | 6 | 255 | 14557 | 85.21 | 692 | 696 | 162.7 |
| D | 12 | 227 | 1196693 | 7225.24 | 670 | 652 | 165.5 |
| D | 2 | 250 | 367308 | 2214.96 | 670 | 652 | 165.5 |
| D | 13 | 249 | 237518 | 1430.9 | 670 | 652 | 165.5 |
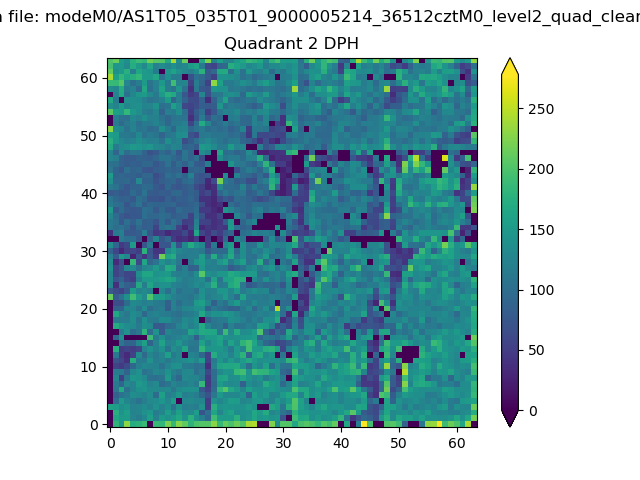
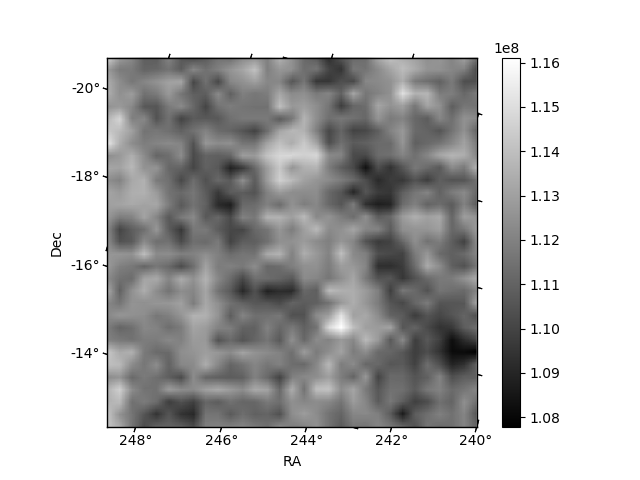
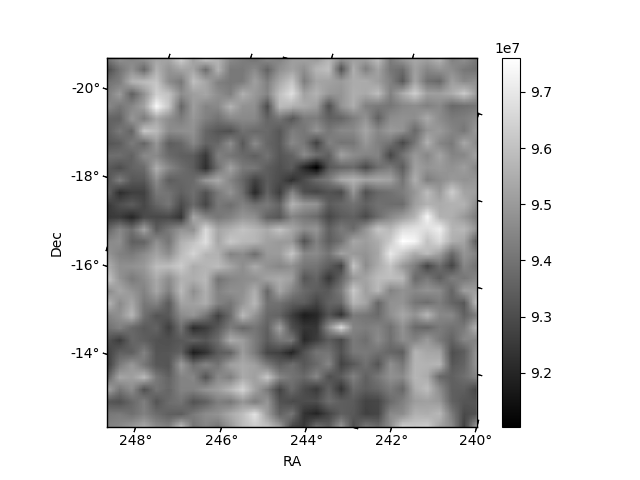
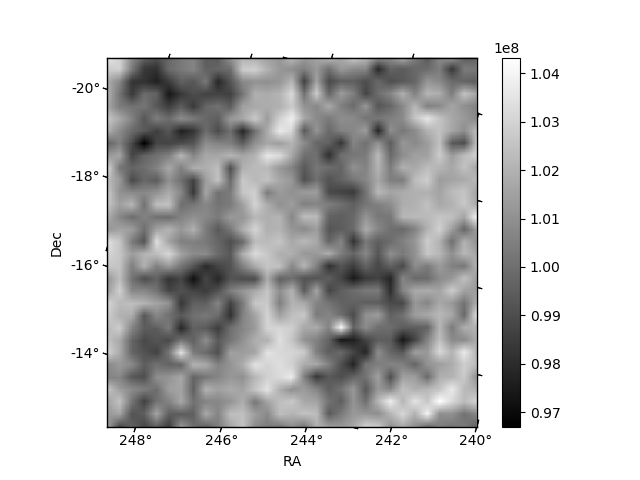
Histogram calculated using DETX and DETY for each event in the final _common_clean file
| Quadrant A | 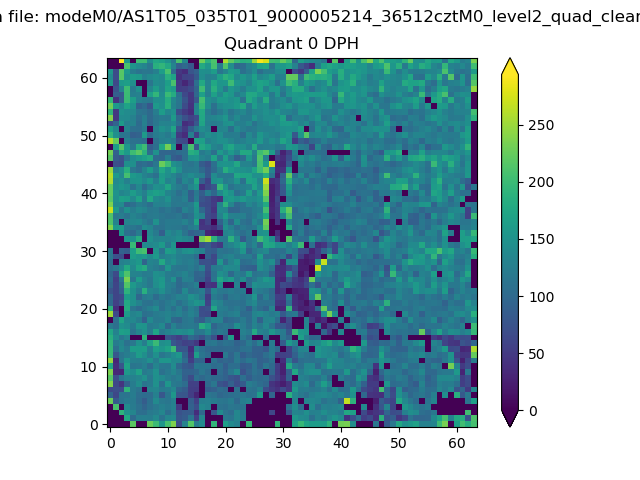 |
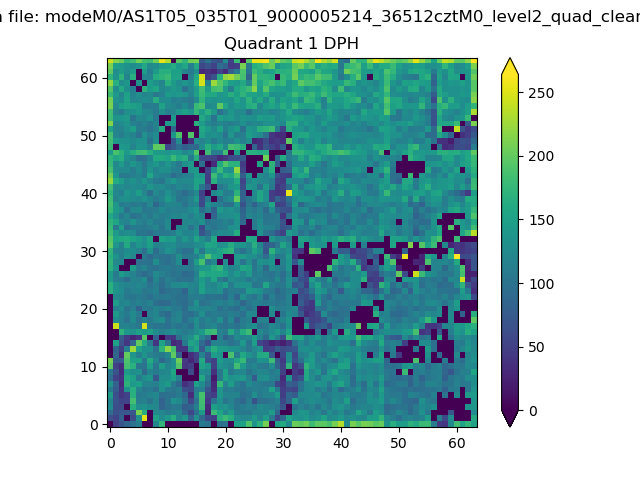 |
Quadrant B |
|---|---|---|---|
| Quadrant D | 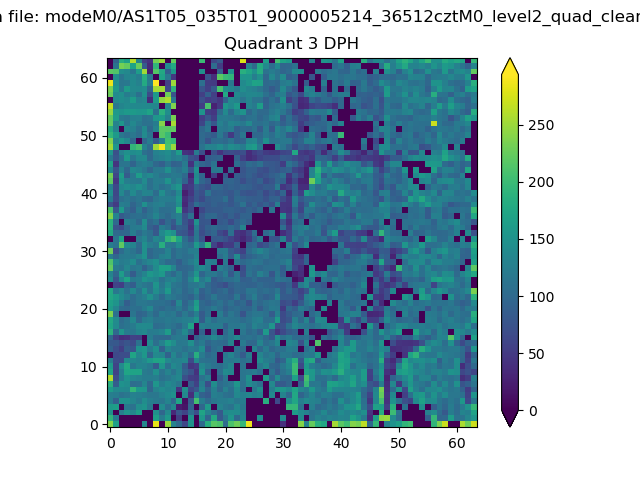 |
 |
Quadrant C |
| Plot type | Count rate plots | Images |
|---|---|---|
| Comparison with Poisson distribution Blue bars denote a histogram of data divided into 1 sec bins. Red curve is a Poisson curve with rate = median count rate of data. |
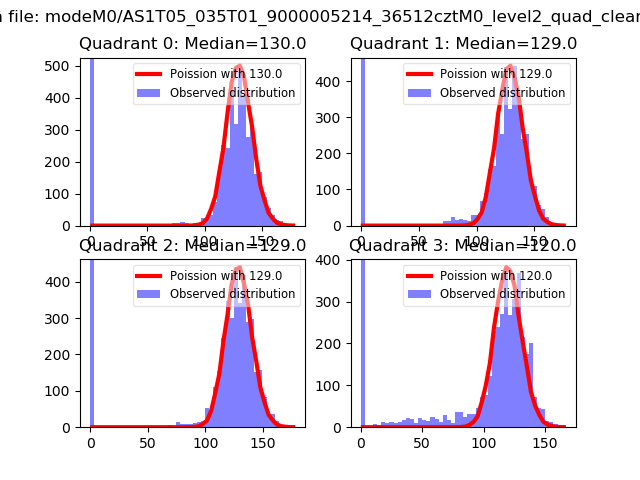 |
 |
| Quadrant-wise count rates Data is divided into 100 sec bins |
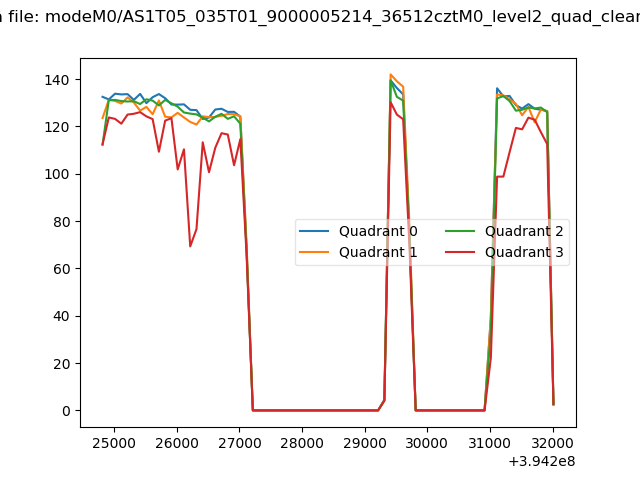 |
|
| Module-wise count rates for Quadrant A Data is divided into 100 sec bins |
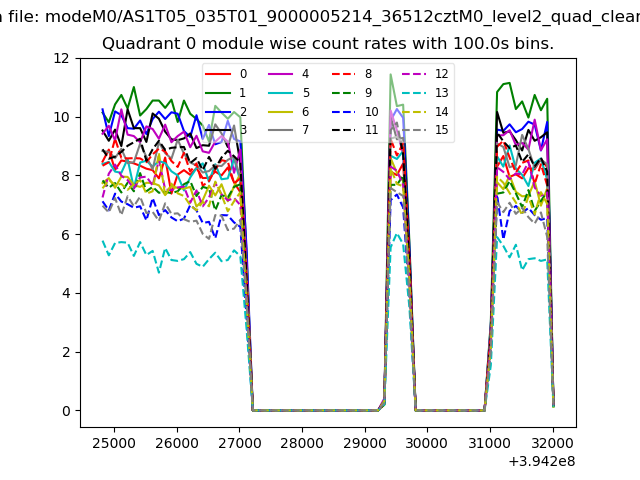 |
 |
| Module-wise count rates for Quadrant B Data is divided into 100 sec bins |
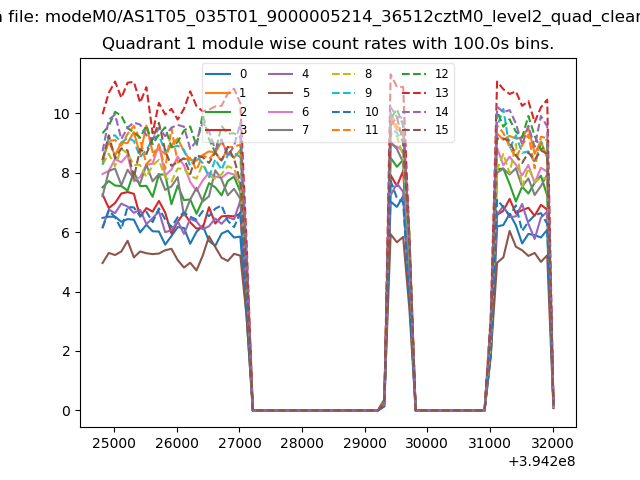 |
 |
| Module-wise count rates for Quadrant C Data is divided into 100 sec bins |
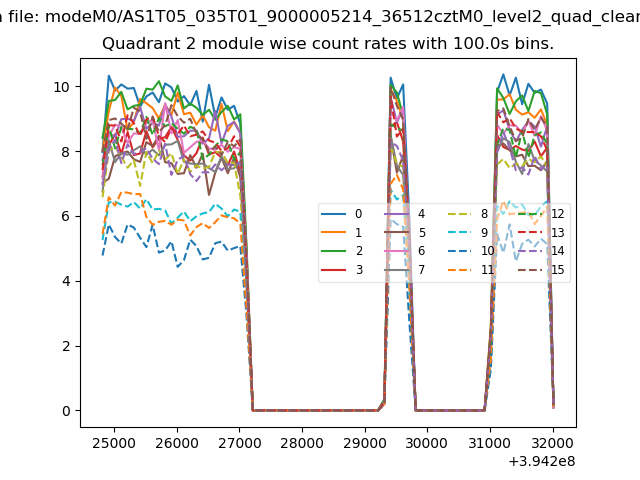 |
 |
| Module-wise count rates for Quadrant D Data is divided into 100 sec bins |
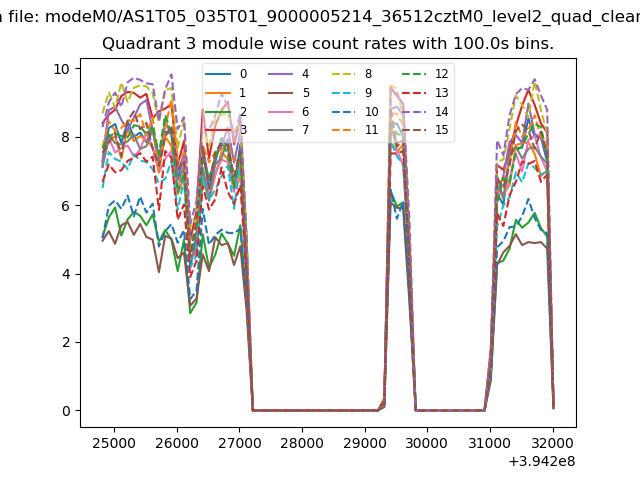 |
 |
| Parameter | Plot |
|---|---|
| CZT HV Monitor | 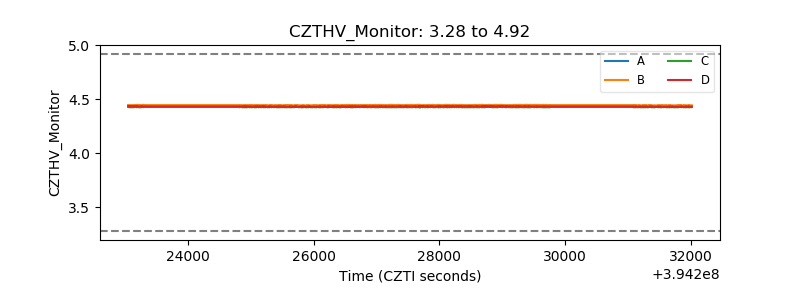 |
| D_VDD | 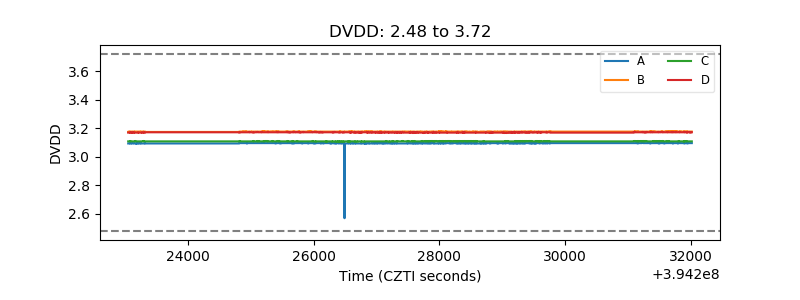 |
| Temperature 1 | 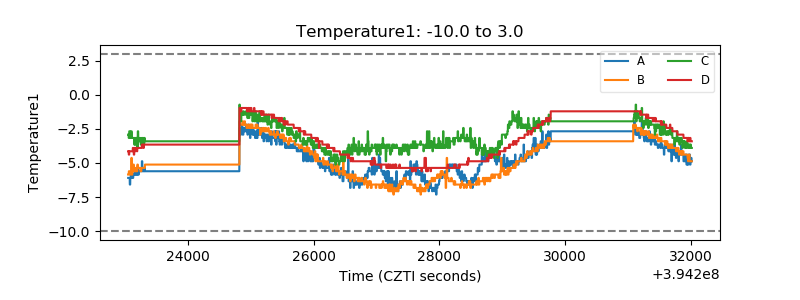 |
| Veto HV Monitor |  |
| Veto LLD | 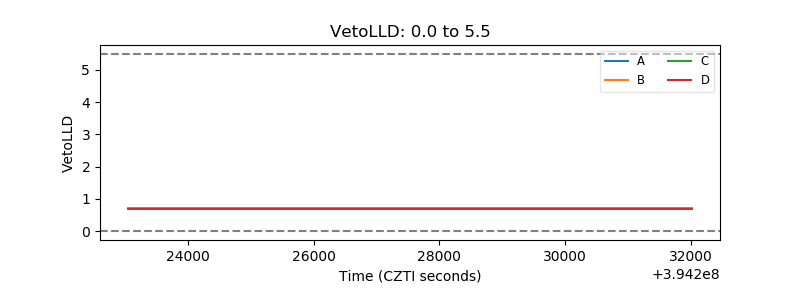 |
| Alpha Counter | 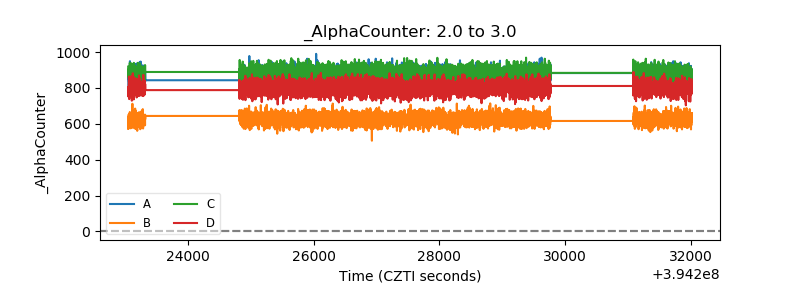 |
| _CPM_Rate | 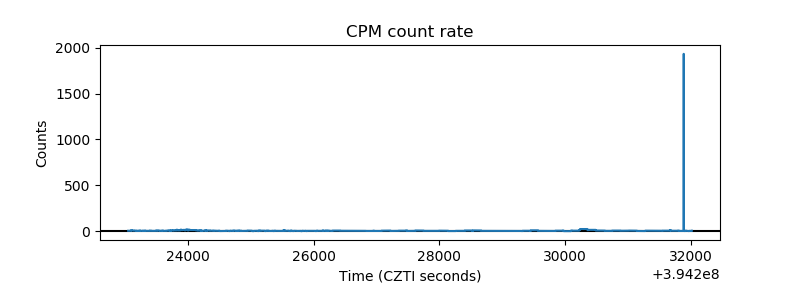 |
| CZT Counter | 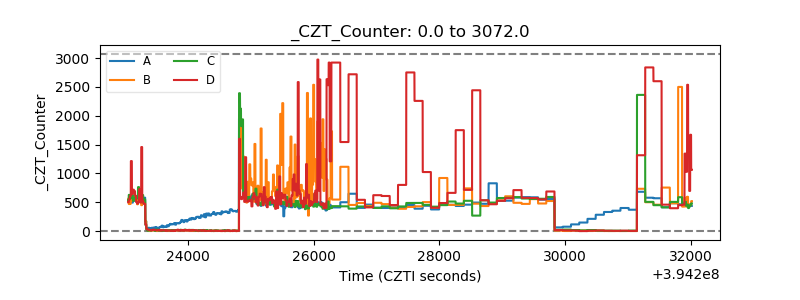 |
| +2.5 Volts monitor |  |
| +5 Volts monitor |  |
| _ROLL_ROT | 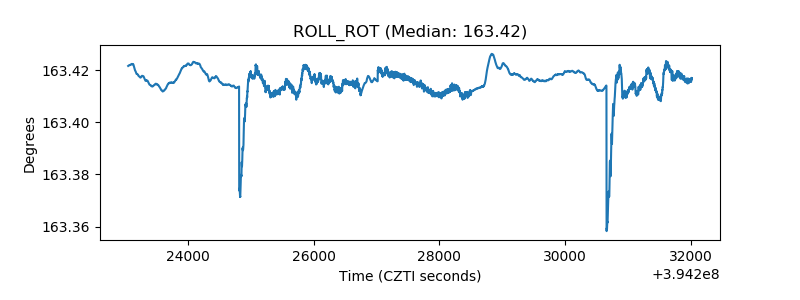 |
| _Roll_DEC | 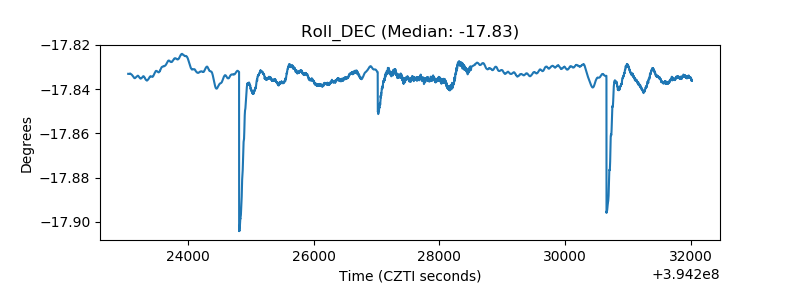 |
| _Roll_RA | 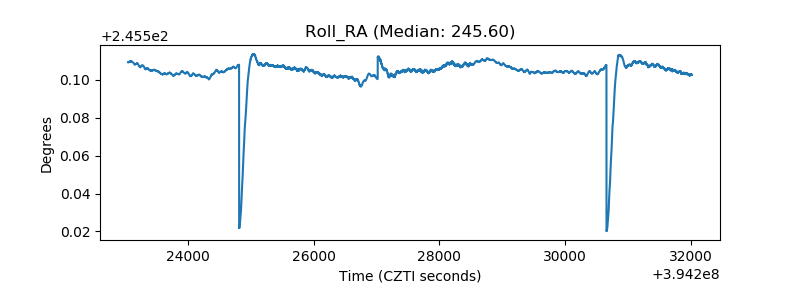 |
| Veto Counter | 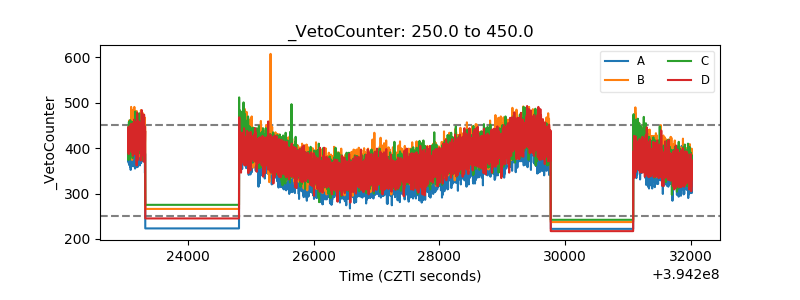 |