| Param | Original file | Final file |
|---|---|---|
| Filename | modeM0/AS1T05_035T01_9000005214_36519cztM0_level2.evt | modeM0/AS1T05_035T01_9000005214_36519cztM0_level2_quad_clean.evt |
| Size (bytes) | 418,622,400 | 55,143,360 |
| Size | 399.2 MB | 52.6 MB |
| Events in quadrant A | 2,893,482 | 329,939 |
| Events in quadrant B | 3,023,039 | 328,941 |
| Events in quadrant C | 2,956,532 | 325,930 |
| Events in quadrant D | 3,435,842 | 304,191 |
| Mode M0 | |||
|---|---|---|---|
| Quadrant | BADHDUFLAG | Total packets | Discarded packets |
| A | 0 | 11798 | 3 |
| B | 0 | 12207 | 2 |
| C | 0 | 11757 | 2 |
| D | 0 | 13770 | 2 |
| Mode SS | |||
|---|---|---|---|
| Quadrant | BADHDUFLAG | Total packets | Discarded packets |
| A | 0 | 110 | 0 |
| B | 0 | 110 | 0 |
| C | 0 | 110 | 0 |
| D | 0 | 110 | 0 |
| Mode M9 | |||
|---|---|---|---|
| Quadrant | BADHDUFLAG | Total packets | Discarded packets |
| A | 0 | 28 | 0 |
| B | 0 | 28 | 0 |
| C | 0 | 28 | 0 |
| D | 0 | 29 | 0 |
| Quadrant | Total seconds | Saturated seconds | Saturation percentage |
|---|---|---|---|
| A | 5436 | 32 | 0.588668% |
| B | 5436 | 80 | 1.471670% |
| C | 5436 | 76 | 1.398087% |
| D | 5436 | 108 | 1.986755% |
Noise dominated data is calculated using 1-second bins in cleaned event files. If a bin has >2000 counts, and if more than 50% of those come from <1% of pixels, then it is considered to be noise-dominated and hence unusable.
| Quadrant | # 1 sec bins | Bins with >0 counts | Bins with >2000 counts | High rate bins dominated by noise | Noise dominated (total time) | Noise dominated (detector-on time) | Marked lightcurve |
|---|---|---|---|---|---|---|---|
| A | 7259 | 5437 | 20 | 20 | 0.28% | 0.37% | 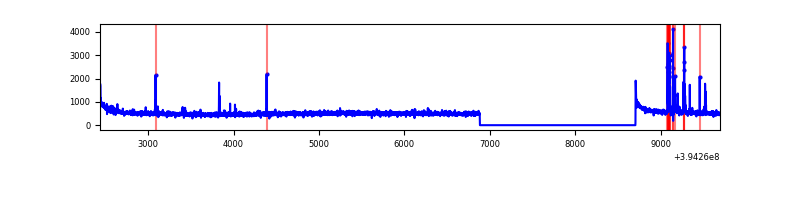 |
| B | 7259 | 5437 | 42 | 42 | 0.58% | 0.77% | 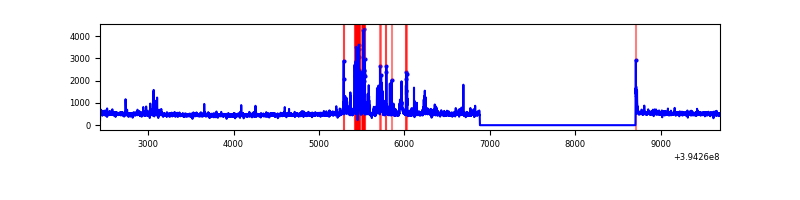 |
| C | 7259 | 5437 | 42 | 42 | 0.58% | 0.77% | 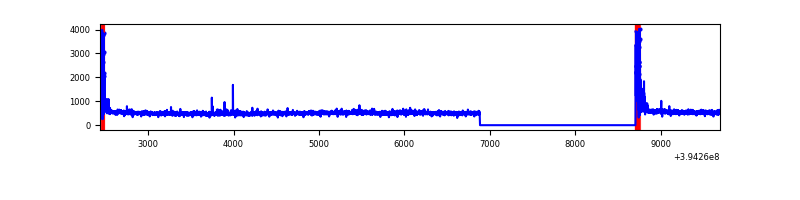 |
| D | 7259 | 5437 | 71 | 71 | 0.98% | 1.31% |  |
Top three noisy pixels from each quadrant. If the there are fewer than three noisy pixels in the level2.evt file, extra rows are filled as -1
| Pixel properties | Quadrant properties | ||||||
|---|---|---|---|---|---|---|---|
| Quadrant | DetID | PixID | Counts | Sigma | Mean | Median | Sigma |
| A | 10 | 83 | 197882 | 1485.0 | 666 | 654 | 132.8 |
| A | 9 | 143 | 100578 | 752.36 | 666 | 654 | 132.8 |
| A | 15 | 223 | 11180 | 79.25 | 666 | 654 | 132.8 |
| B | 5 | 172 | 251859 | 2001.24 | 661 | 645 | 125.5 |
| B | 5 | 255 | 84216 | 665.75 | 661 | 645 | 125.5 |
| B | 0 | 229 | 37152 | 290.83 | 661 | 645 | 125.5 |
| C | 15 | 214 | 232884 | 1573.6 | 639 | 643 | 147.6 |
| C | 0 | 10 | 222324 | 1502.05 | 639 | 643 | 147.6 |
| C | 12 | 249 | 8837 | 55.52 | 639 | 643 | 147.6 |
| D | 2 | 137 | 329313 | 2124.75 | 637 | 620 | 154.7 |
| D | 13 | 249 | 221671 | 1428.93 | 637 | 620 | 154.7 |
| D | 2 | 250 | 197416 | 1272.14 | 637 | 620 | 154.7 |
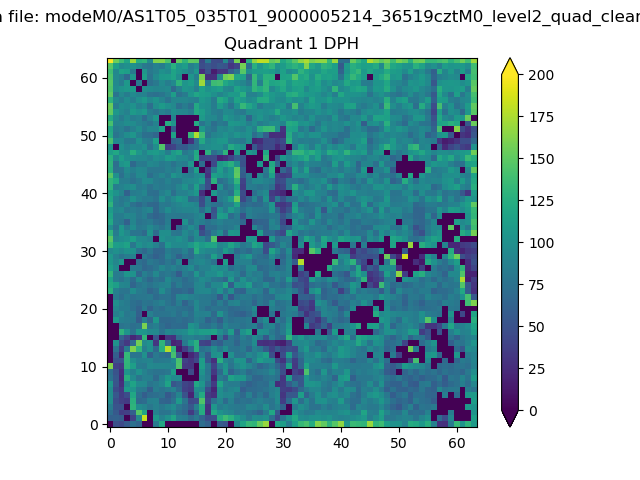
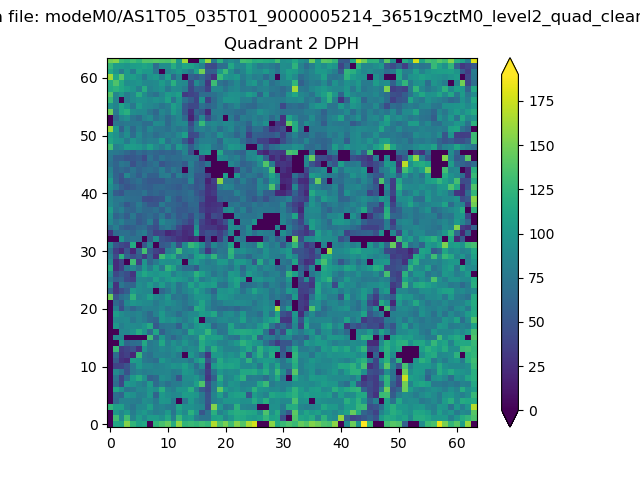
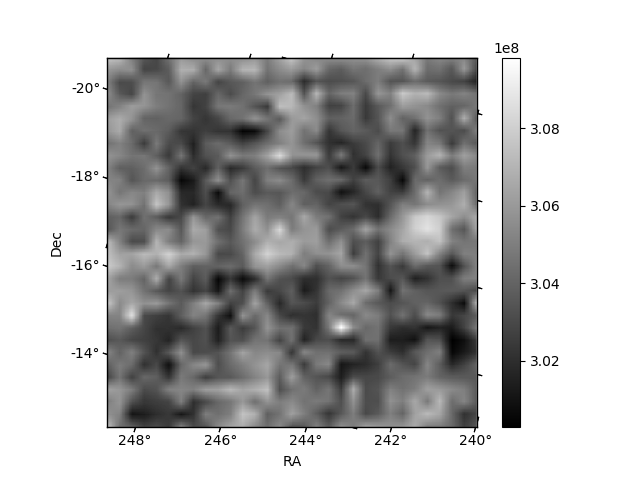
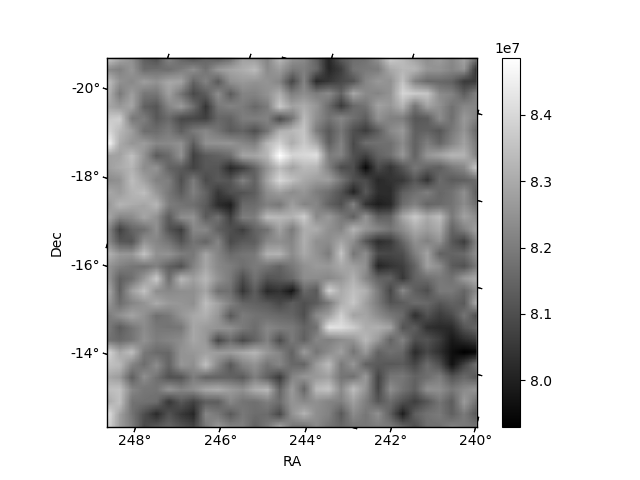
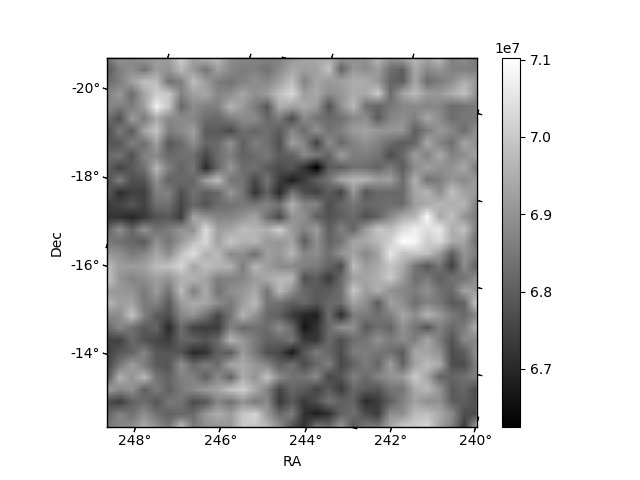
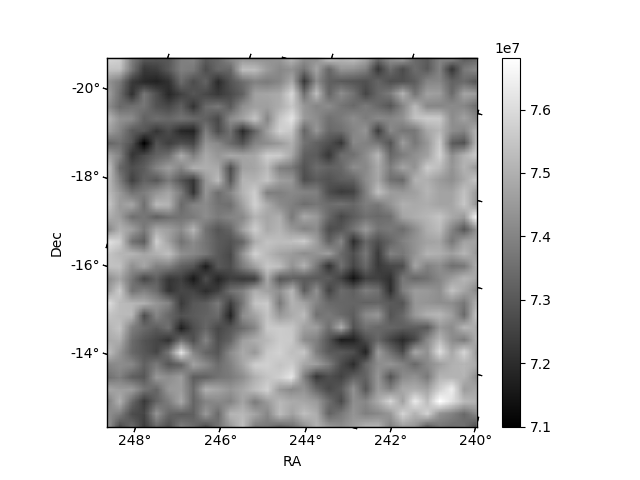
Histogram calculated using DETX and DETY for each event in the final _common_clean file
| Quadrant A | 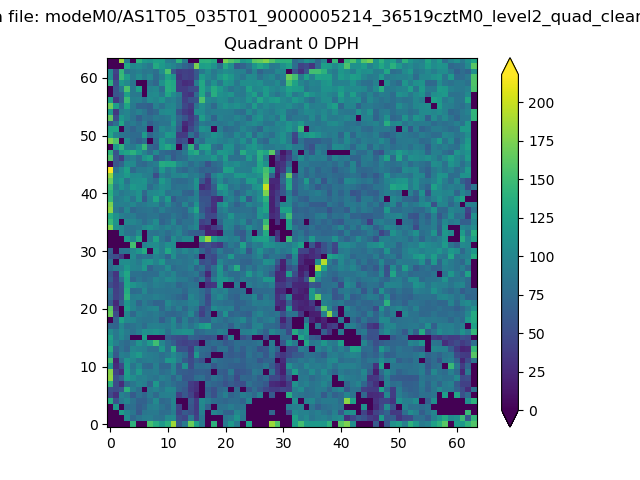 |
 |
Quadrant B |
|---|---|---|---|
| Quadrant D | 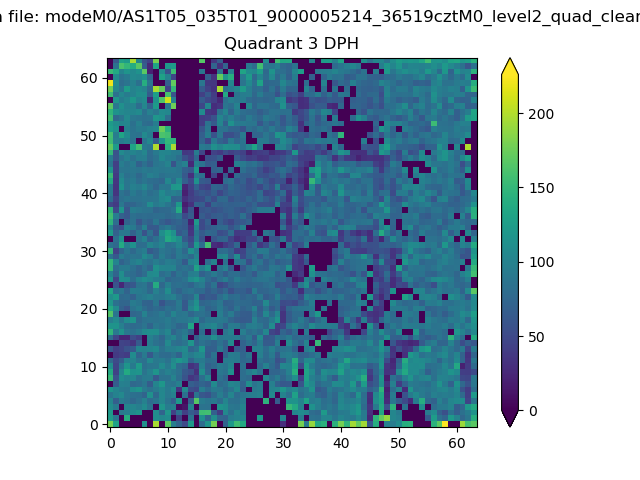 |
 |
Quadrant C |
| Plot type | Count rate plots | Images |
|---|---|---|
| Comparison with Poisson distribution Blue bars denote a histogram of data divided into 1 sec bins. Red curve is a Poisson curve with rate = median count rate of data. |
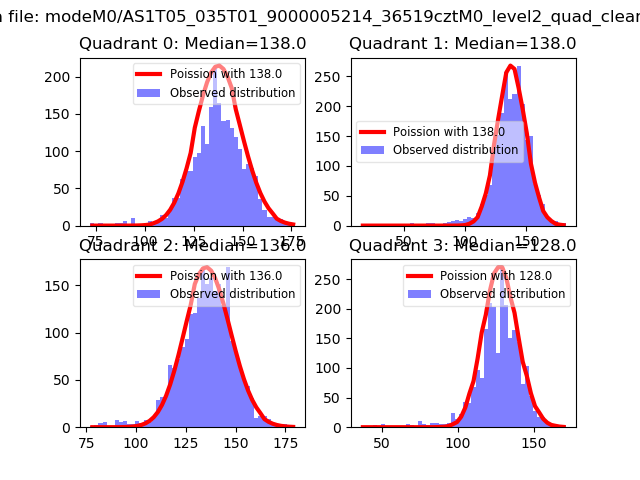 |
 |
| Quadrant-wise count rates Data is divided into 100 sec bins |
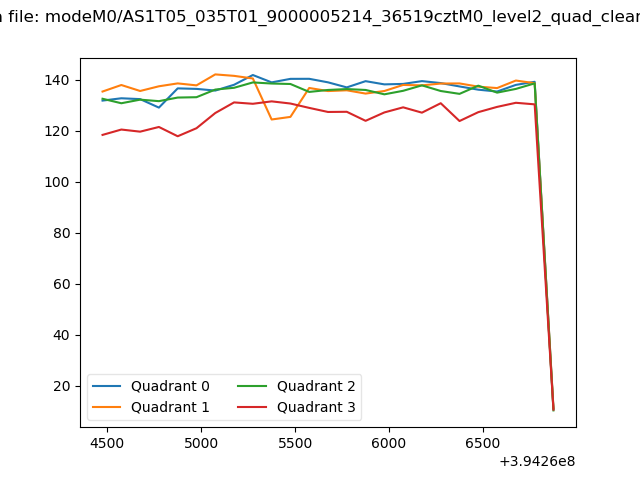 |
|
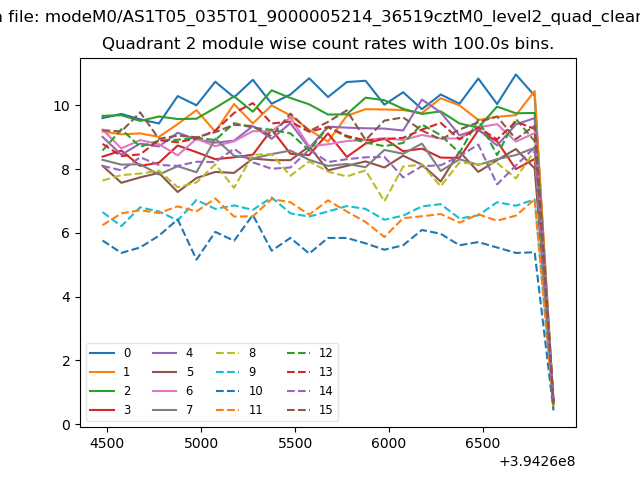
| Module-wise count rates for Quadrant A Data is divided into 100 sec bins |
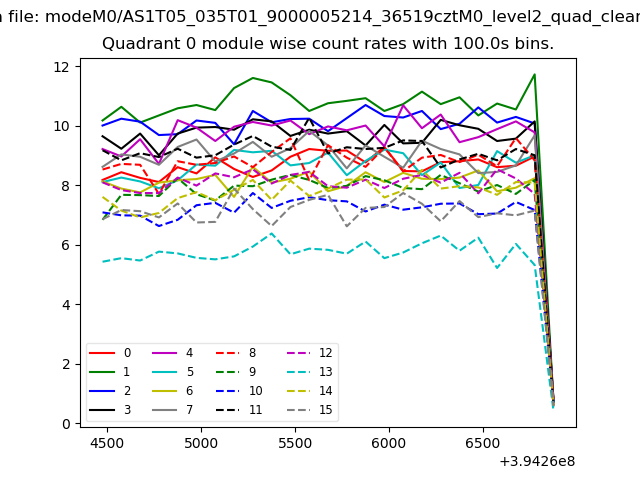 |
 |
| Module-wise count rates for Quadrant B Data is divided into 100 sec bins |
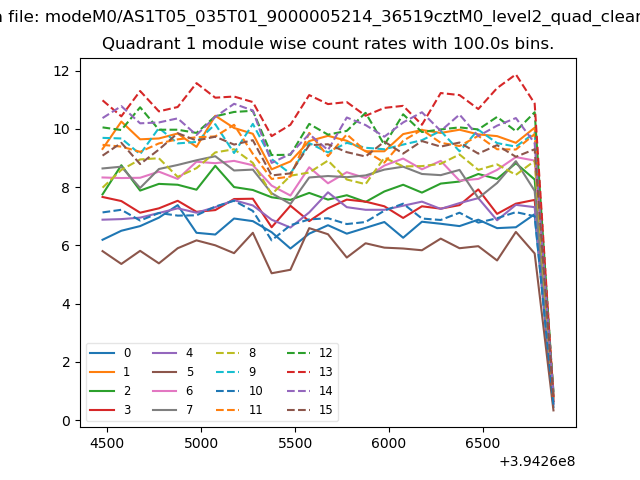 |
 |
| Module-wise count rates for Quadrant C Data is divided into 100 sec bins |
 |
 |
| Module-wise count rates for Quadrant D Data is divided into 100 sec bins |
 |
 |
| Parameter | Plot |
|---|---|
| CZT HV Monitor | 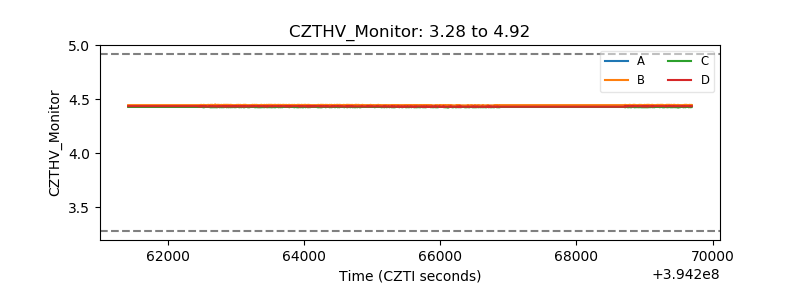 |
| D_VDD | 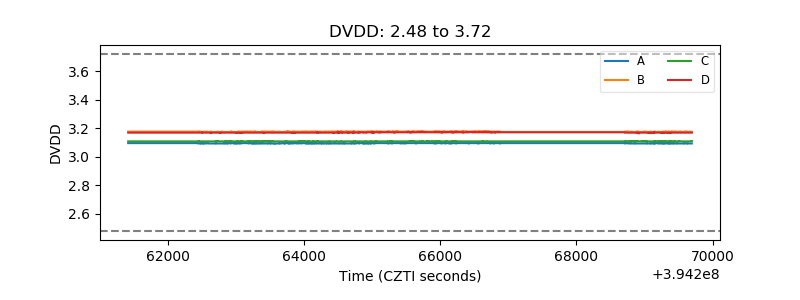 |
| Temperature 1 | 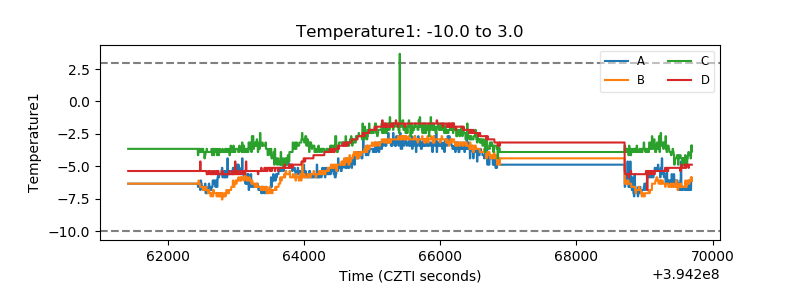 |
| Veto HV Monitor | 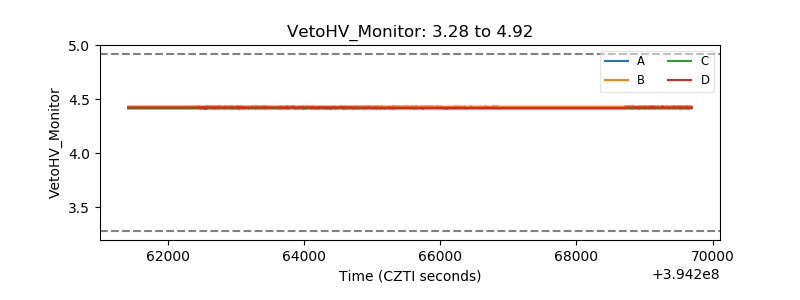 |
| Veto LLD | 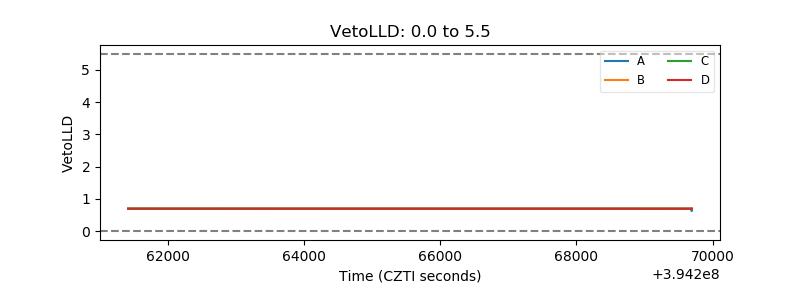 |
| Alpha Counter | 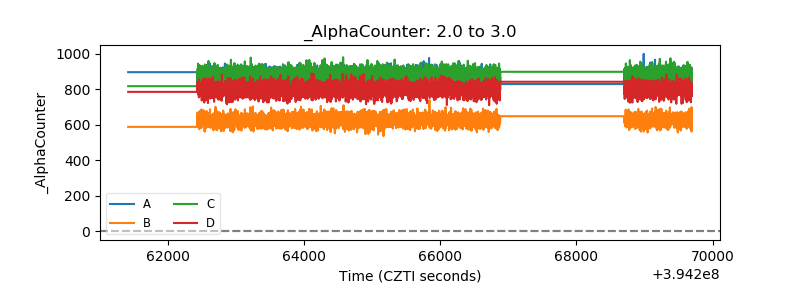 |
| _CPM_Rate | 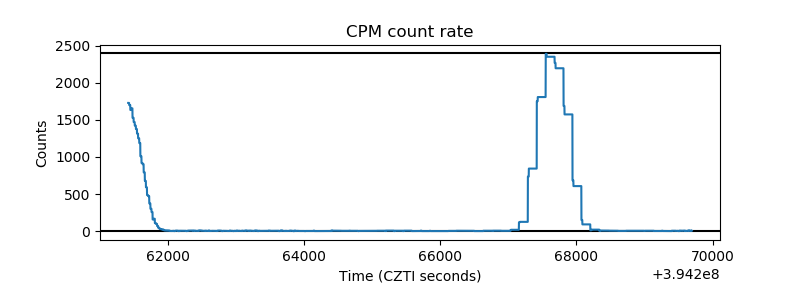 |
| CZT Counter | 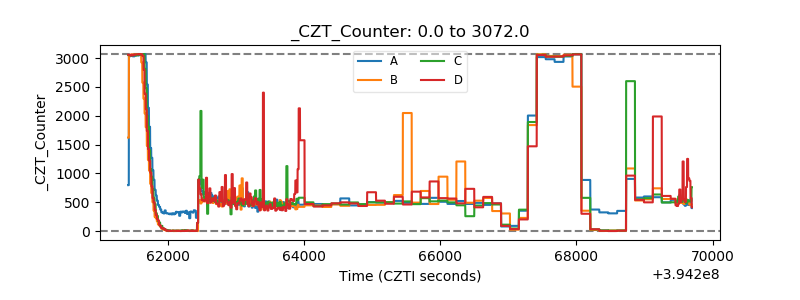 |
| +2.5 Volts monitor |  |
| +5 Volts monitor |  |
| _ROLL_ROT | 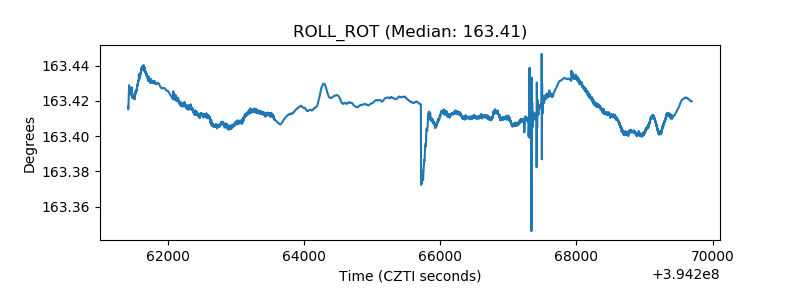 |
| _Roll_DEC |  |
| _Roll_RA | 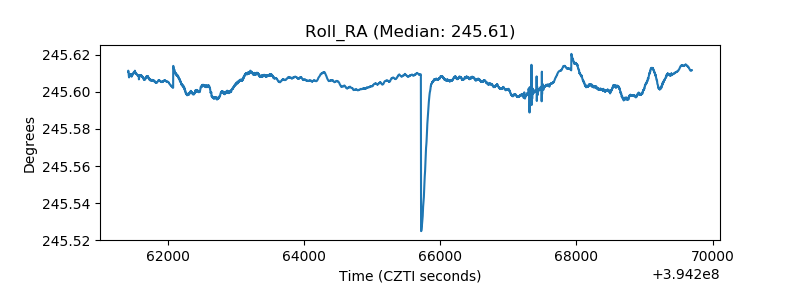 |
| Veto Counter |  |