| Param | Original file | Final file |
|---|---|---|
| Filename | modeM0/AS1T05_035T01_9000005214_36521cztM0_level2.evt | modeM0/AS1T05_035T01_9000005214_36521cztM0_level2_quad_clean.evt |
| Size (bytes) | 436,230,720 | 69,019,200 |
| Size | 416.0 MB | 65.8 MB |
| Events in quadrant A | 2,791,984 | 446,702 |
| Events in quadrant B | 2,685,675 | 452,385 |
| Events in quadrant C | 2,958,621 | 438,015 |
| Events in quadrant D | 4,438,595 | 405,183 |
| Mode M0 | |||
|---|---|---|---|
| Quadrant | BADHDUFLAG | Total packets | Discarded packets |
| A | 0 | 11150 | 3 |
| B | 0 | 10717 | 2 |
| C | 0 | 11592 | 2 |
| D | 0 | 16359 | 2 |
| Mode SS | |||
|---|---|---|---|
| Quadrant | BADHDUFLAG | Total packets | Discarded packets |
| A | 0 | 100 | 0 |
| B | 0 | 100 | 0 |
| C | 0 | 100 | 0 |
| D | 0 | 100 | 0 |
| Mode M9 | |||
|---|---|---|---|
| Quadrant | BADHDUFLAG | Total packets | Discarded packets |
| A | 0 | 37 | 0 |
| B | 0 | 37 | 0 |
| C | 0 | 37 | 0 |
| D | 0 | 38 | 0 |
| Quadrant | Total seconds | Saturated seconds | Saturation percentage |
|---|---|---|---|
| A | 4959 | 17 | 0.342811% |
| B | 4959 | 9 | 0.181488% |
| C | 4959 | 104 | 2.097197% |
| D | 4959 | 504 | 10.163339% |
Noise dominated data is calculated using 1-second bins in cleaned event files. If a bin has >2000 counts, and if more than 50% of those come from <1% of pixels, then it is considered to be noise-dominated and hence unusable.
| Quadrant | # 1 sec bins | Bins with >0 counts | Bins with >2000 counts | High rate bins dominated by noise | Noise dominated (total time) | Noise dominated (detector-on time) | Marked lightcurve |
|---|---|---|---|---|---|---|---|
| A | 7023 | 4960 | 3 | 3 | 0.04% | 0.06% | 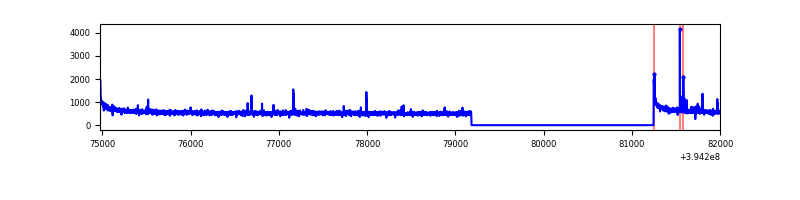 |
| B | 7023 | 4960 | 1 | 1 | 0.01% | 0.02% | 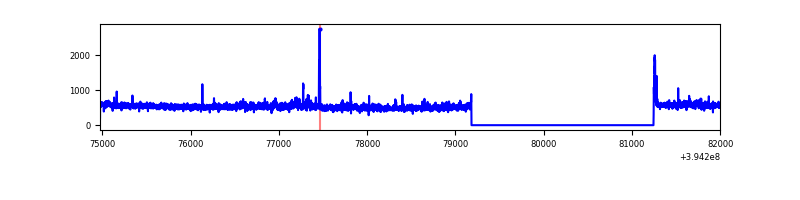 |
| C | 7023 | 4960 | 59 | 59 | 0.84% | 1.19% | 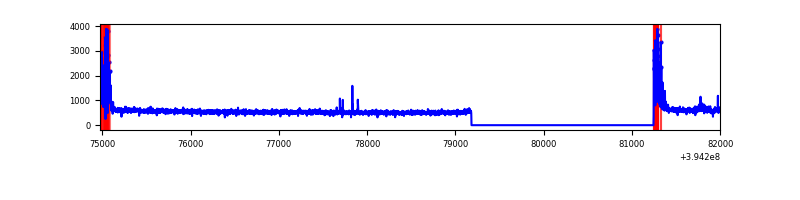 |
| D | 7023 | 4960 | 436 | 436 | 6.21% | 8.79% | 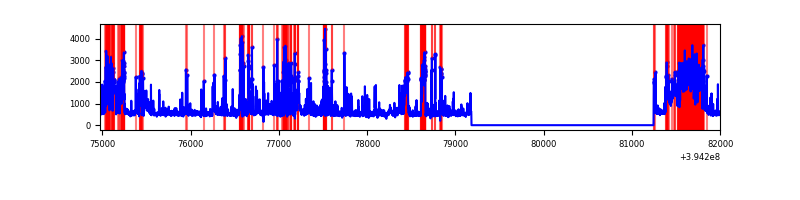 |
Top three noisy pixels from each quadrant. If the there are fewer than three noisy pixels in the level2.evt file, extra rows are filled as -1
| Pixel properties | Quadrant properties | ||||||
|---|---|---|---|---|---|---|---|
| Quadrant | DetID | PixID | Counts | Sigma | Mean | Median | Sigma |
| A | 10 | 83 | 188932 | 1438.87 | 657 | 648 | 130.9 |
| A | 9 | 143 | 46943 | 353.79 | 657 | 648 | 130.9 |
| A | 13 | 6 | 10050 | 71.85 | 657 | 648 | 130.9 |
| B | 5 | 172 | 30272 | 243.05 | 648 | 634 | 121.9 |
| B | 0 | 189 | 29636 | 237.83 | 648 | 634 | 121.9 |
| B | 4 | 81 | 26481 | 211.96 | 648 | 634 | 121.9 |
| C | 0 | 10 | 306272 | 2139.79 | 625 | 632 | 142.8 |
| C | 15 | 214 | 212930 | 1486.3 | 625 | 632 | 142.8 |
| C | 13 | 61 | 4283 | 25.56 | 625 | 632 | 142.8 |
| D | 2 | 250 | 852781 | 5706.26 | 615 | 601 | 149.3 |
| D | 13 | 171 | 357360 | 2388.89 | 615 | 601 | 149.3 |
| D | 13 | 249 | 255507 | 1706.87 | 615 | 601 | 149.3 |
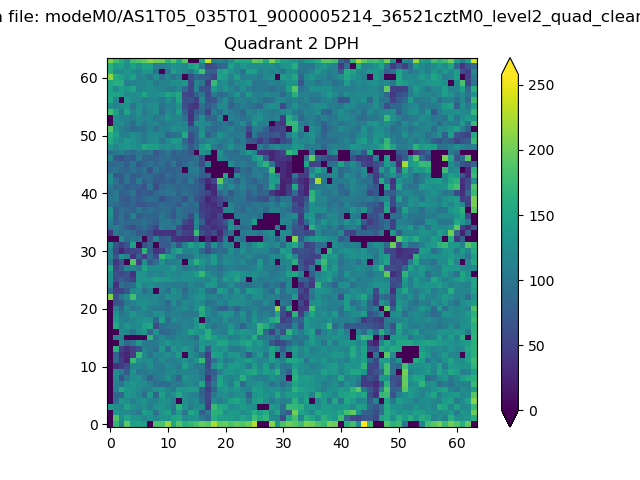
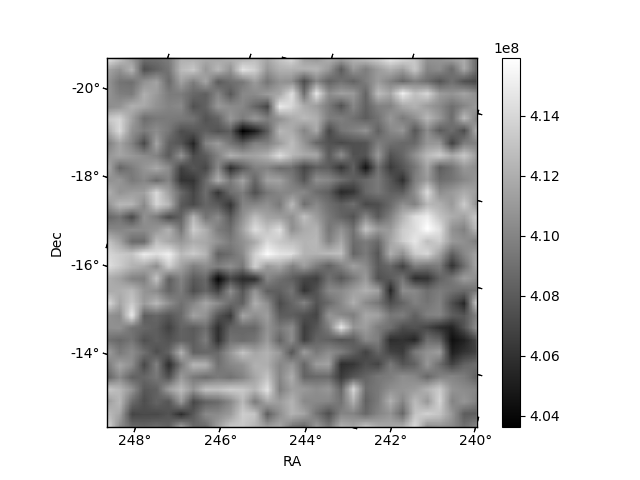
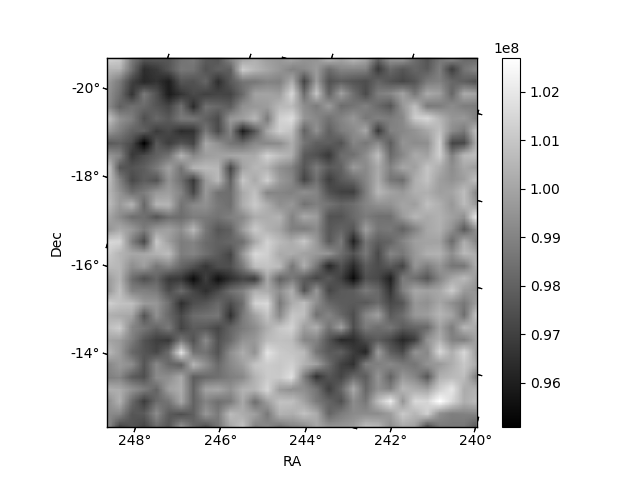
Histogram calculated using DETX and DETY for each event in the final _common_clean file
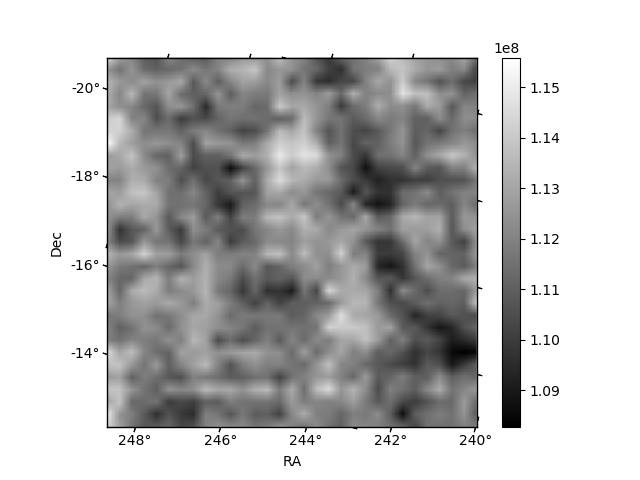
| Quadrant A | 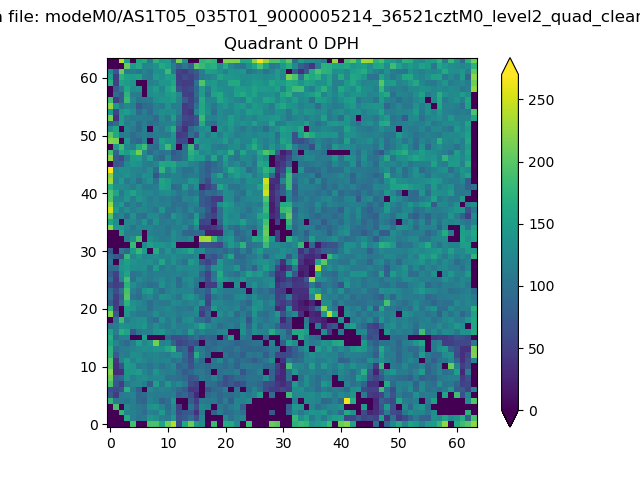 |
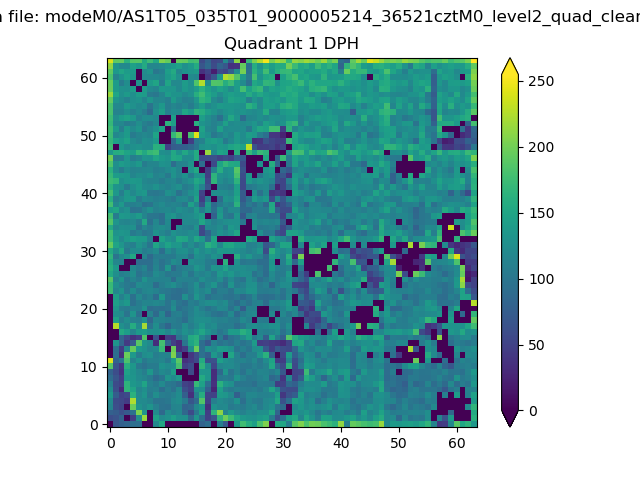 |
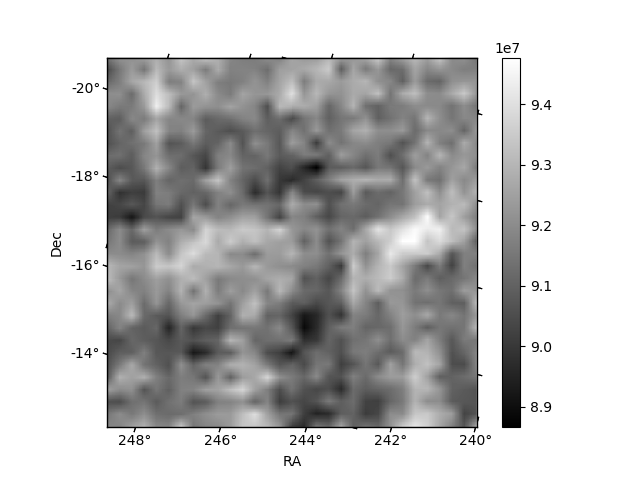
Quadrant B |
|---|---|---|---|
| Quadrant D | 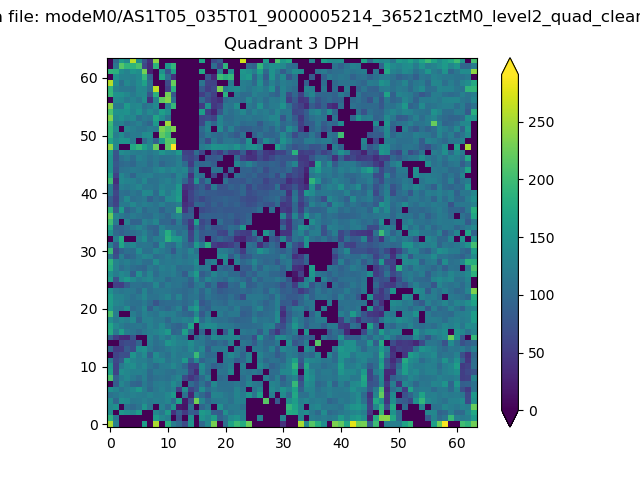 |
 |
Quadrant C |
| Plot type | Count rate plots | Images |
|---|---|---|
| Comparison with Poisson distribution Blue bars denote a histogram of data divided into 1 sec bins. Red curve is a Poisson curve with rate = median count rate of data. |
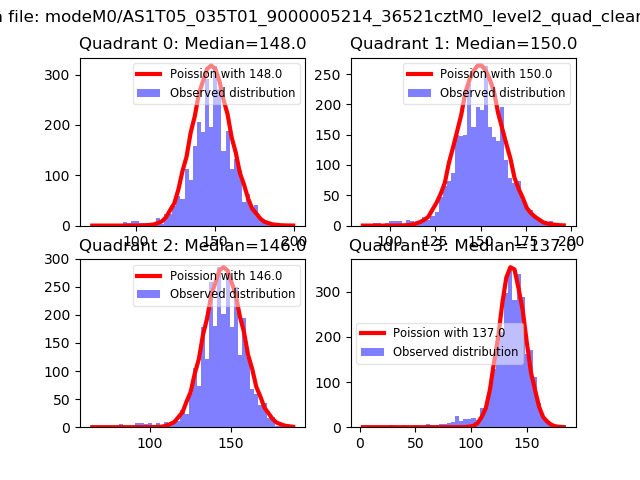 |
 |
| Quadrant-wise count rates Data is divided into 100 sec bins |
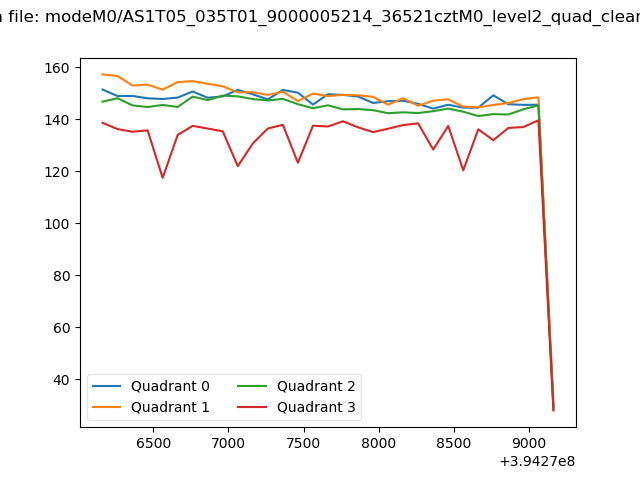 |
|
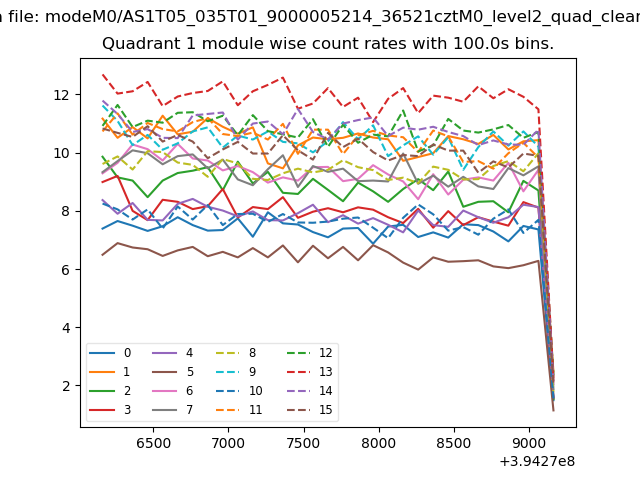
| Module-wise count rates for Quadrant A Data is divided into 100 sec bins |
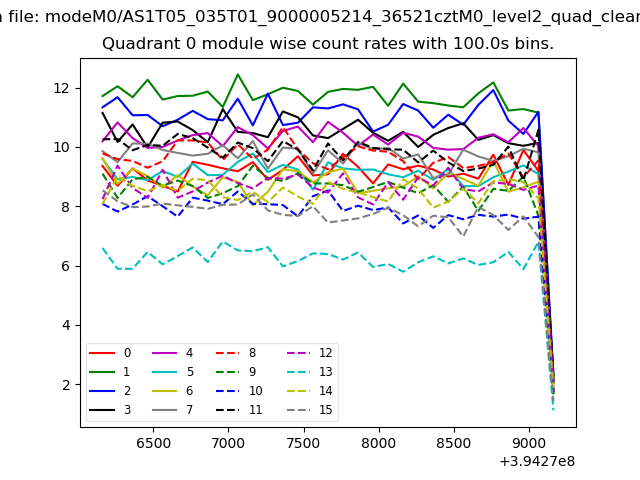 |
 |
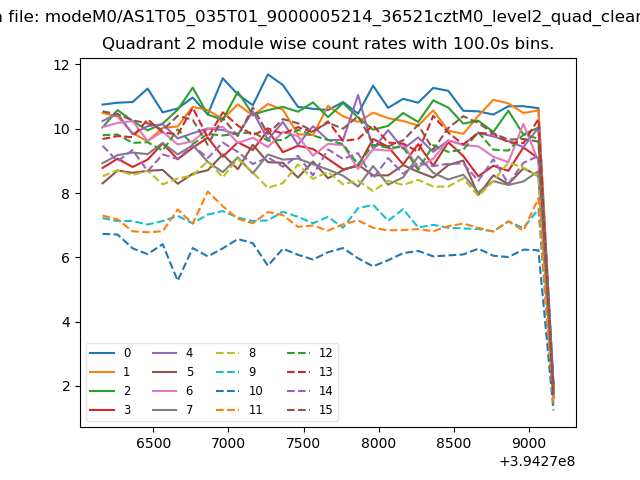
| Module-wise count rates for Quadrant B Data is divided into 100 sec bins |
 |
 |
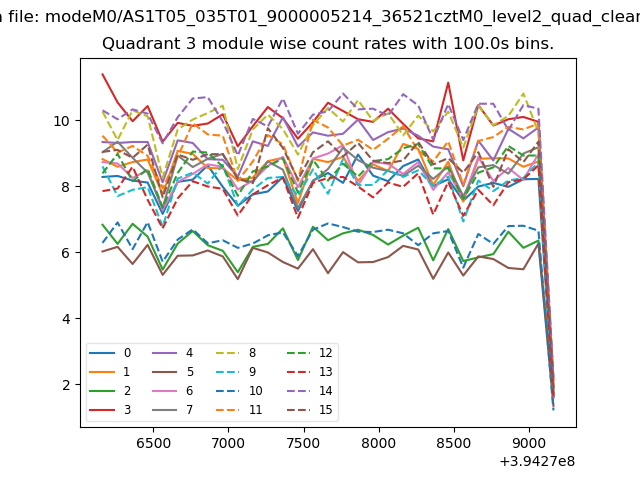
| Module-wise count rates for Quadrant C Data is divided into 100 sec bins |
 |
 |
| Module-wise count rates for Quadrant D Data is divided into 100 sec bins |
 |
 |
| Parameter | Plot |
|---|---|
| CZT HV Monitor | 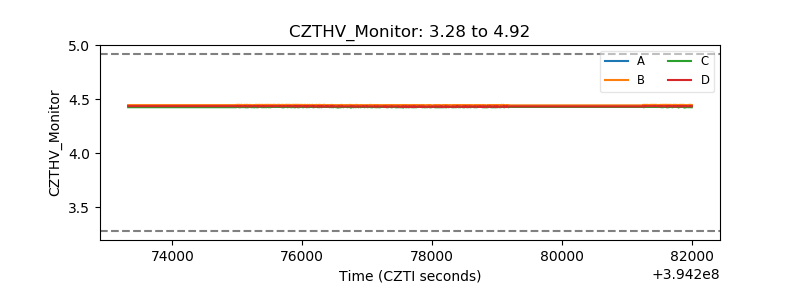 |
| D_VDD | 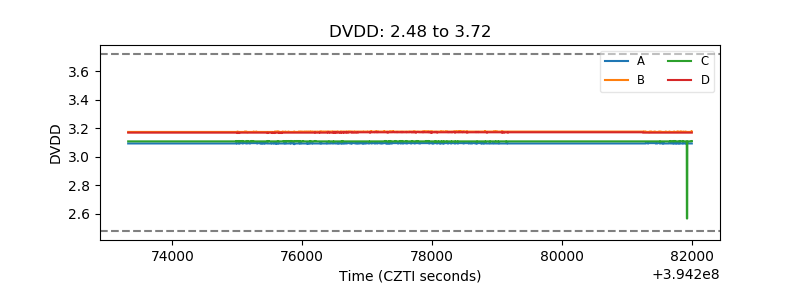 |
| Temperature 1 | 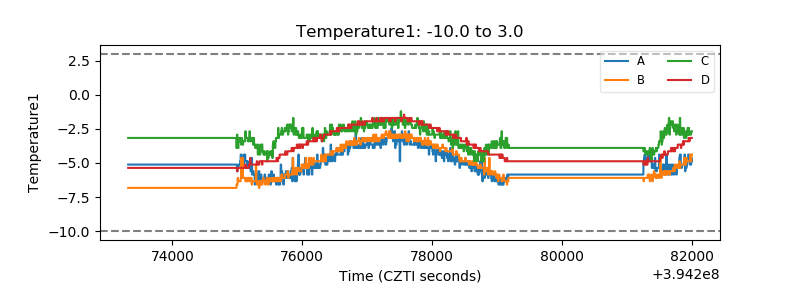 |
| Veto HV Monitor | 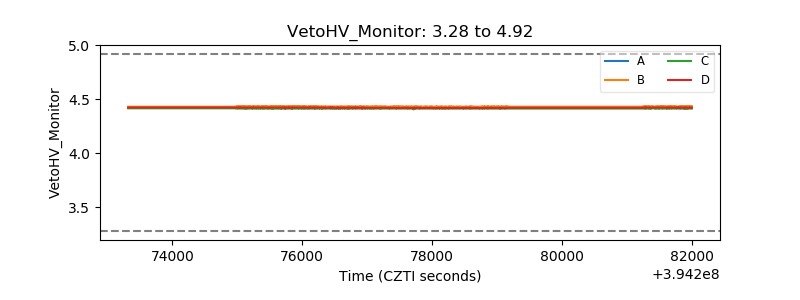 |
| Veto LLD | 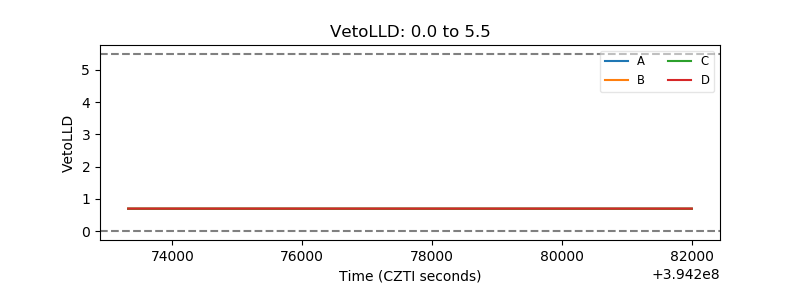 |
| Alpha Counter | 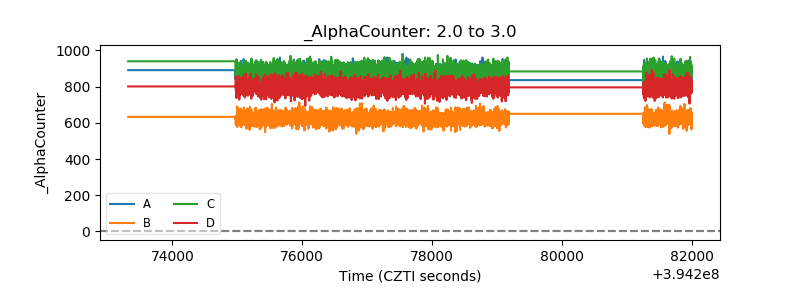 |
| _CPM_Rate | 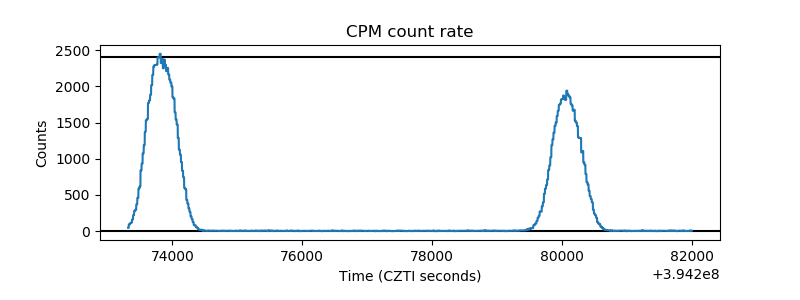 |
| CZT Counter | 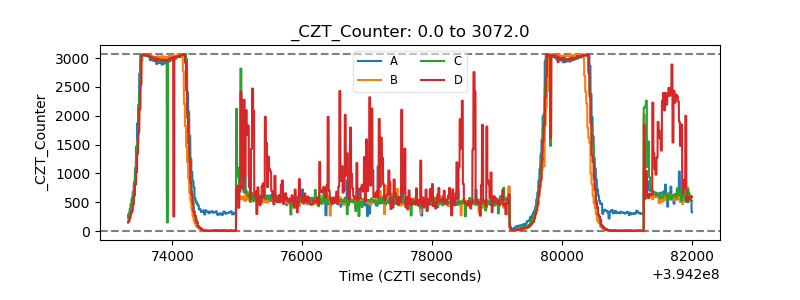 |
| +2.5 Volts monitor |  |
| +5 Volts monitor | 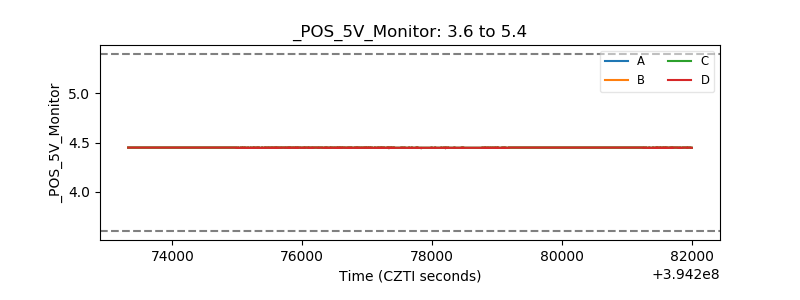 |
| _ROLL_ROT | 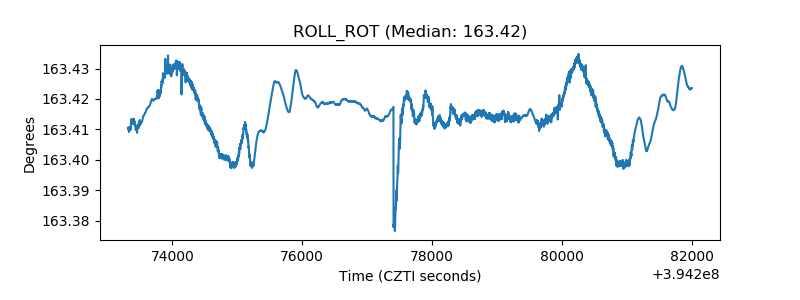 |
| _Roll_DEC |  |
| _Roll_RA | 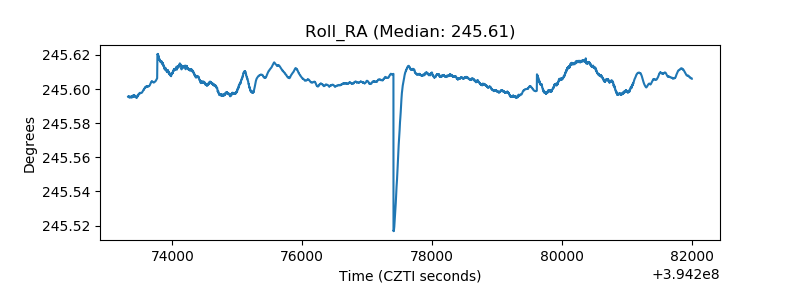 |
| Veto Counter | 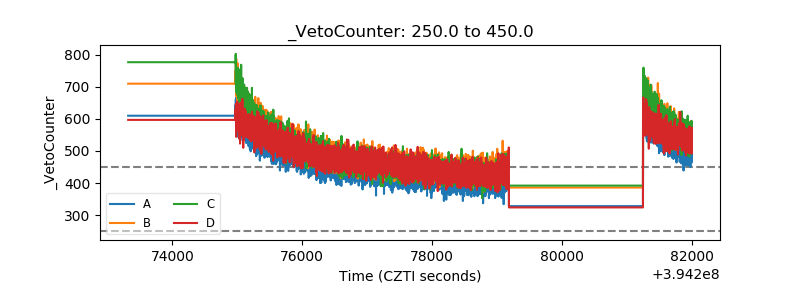 |