| Param | Original file | Final file |
|---|---|---|
| Filename | modeM0/AS1T05_035T01_9000005214_36522cztM0_level2.evt | modeM0/AS1T05_035T01_9000005214_36522cztM0_level2_quad_clean.evt |
| Size (bytes) | 199,517,760 | 31,420,800 |
| Size | 190.3 MB | 30.0 MB |
| Events in quadrant A | 1,224,192 | 203,812 |
| Events in quadrant B | 1,249,865 | 207,878 |
| Events in quadrant C | 1,329,631 | 201,277 |
| Events in quadrant D | 2,093,782 | 185,599 |
| Mode M0 | |||
|---|---|---|---|
| Quadrant | BADHDUFLAG | Total packets | Discarded packets |
| A | 0 | 4865 | 1 |
| B | 0 | 4891 | 1 |
| C | 0 | 5270 | 1 |
| D | 0 | 7596 | 1 |
| Mode SS | |||
|---|---|---|---|
| Quadrant | BADHDUFLAG | Total packets | Discarded packets |
| A | 0 | 42 | 0 |
| B | 0 | 42 | 0 |
| C | 0 | 42 | 0 |
| D | 0 | 42 | 0 |
| Mode M9 | |||
|---|---|---|---|
| Quadrant | BADHDUFLAG | Total packets | Discarded packets |
| A | 0 | 12 | 0 |
| B | 0 | 12 | 0 |
| C | 0 | 12 | 0 |
| D | 0 | 13 | 0 |
| Quadrant | Total seconds | Saturated seconds | Saturation percentage |
|---|---|---|---|
| A | 2103 | 13 | 0.618165% |
| B | 2103 | 11 | 0.523062% |
| C | 2103 | 47 | 2.234903% |
| D | 2103 | 304 | 14.455540% |
Noise dominated data is calculated using 1-second bins in cleaned event files. If a bin has >2000 counts, and if more than 50% of those come from <1% of pixels, then it is considered to be noise-dominated and hence unusable.
| Quadrant | # 1 sec bins | Bins with >0 counts | Bins with >2000 counts | High rate bins dominated by noise | Noise dominated (total time) | Noise dominated (detector-on time) | Marked lightcurve |
|---|---|---|---|---|---|---|---|
| A | 2103 | 2103 | 3 | 3 | 0.14% | 0.14% | 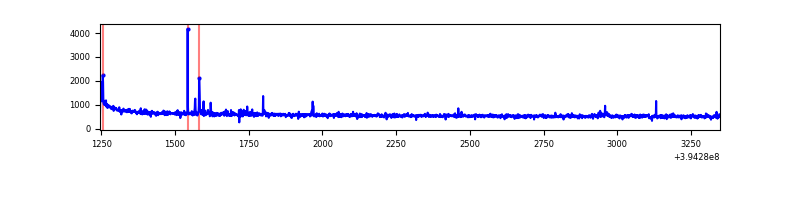 |
| B | 2103 | 2103 | 5 | 5 | 0.24% | 0.24% | 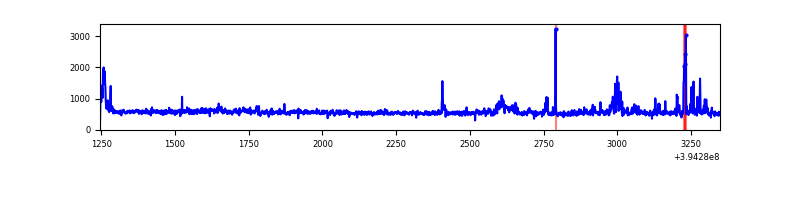 |
| C | 2103 | 2103 | 27 | 27 | 1.28% | 1.28% | 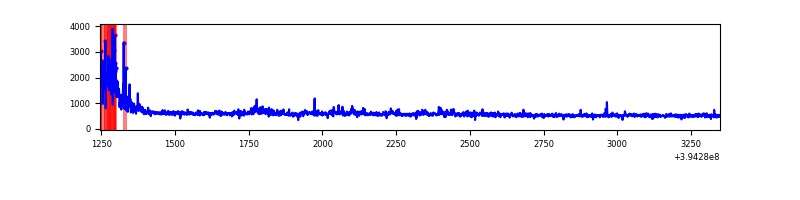 |
| D | 2103 | 2103 | 260 | 260 | 12.36% | 12.36% | 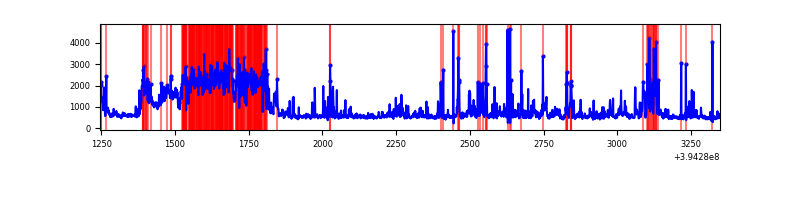 |
Top three noisy pixels from each quadrant. If the there are fewer than three noisy pixels in the level2.evt file, extra rows are filled as -1
| Pixel properties | Quadrant properties | ||||||
|---|---|---|---|---|---|---|---|
| Quadrant | DetID | PixID | Counts | Sigma | Mean | Median | Sigma |
| A | 10 | 83 | 88664 | 1539.95 | 285 | 281 | 57.4 |
| A | 9 | 143 | 27937 | 481.87 | 285 | 281 | 57.4 |
| A | 10 | 255 | 4288 | 69.82 | 285 | 281 | 57.4 |
| B | 5 | 172 | 47258 | 866.16 | 280 | 273 | 54.2 |
| B | 0 | 189 | 37059 | 678.14 | 280 | 273 | 54.2 |
| B | 15 | 85 | 29033 | 530.18 | 280 | 273 | 54.2 |
| C | 0 | 10 | 173448 | 2731.73 | 272 | 275 | 63.4 |
| C | 15 | 214 | 91780 | 1443.45 | 272 | 275 | 63.4 |
| C | 13 | 61 | 1782 | 23.77 | 272 | 275 | 63.4 |
| D | 2 | 250 | 589959 | 9020.07 | 266 | 260 | 65.4 |
| D | 2 | 137 | 95285 | 1453.51 | 266 | 260 | 65.4 |
| D | 2 | 153 | 86172 | 1314.12 | 266 | 260 | 65.4 |
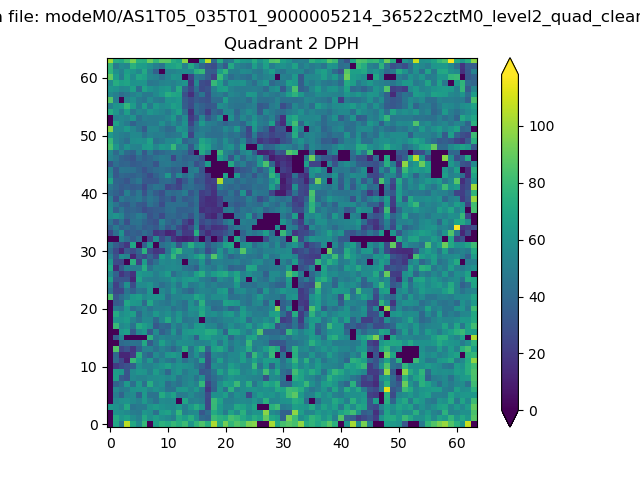
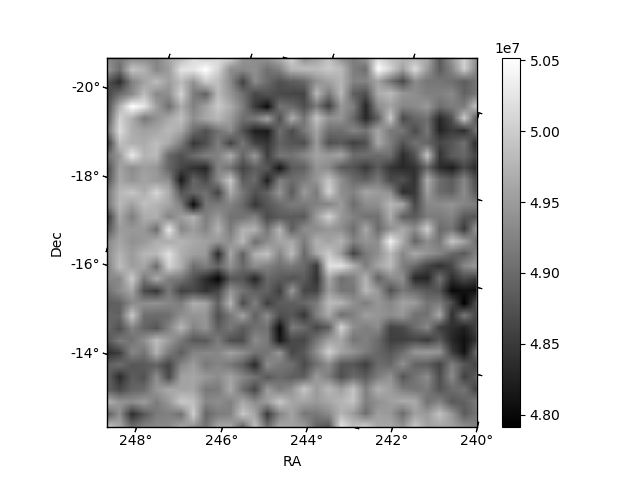
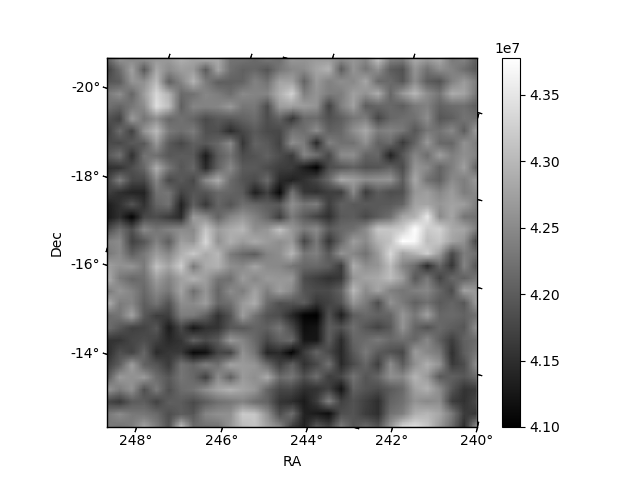
Histogram calculated using DETX and DETY for each event in the final _common_clean file
| Quadrant A | 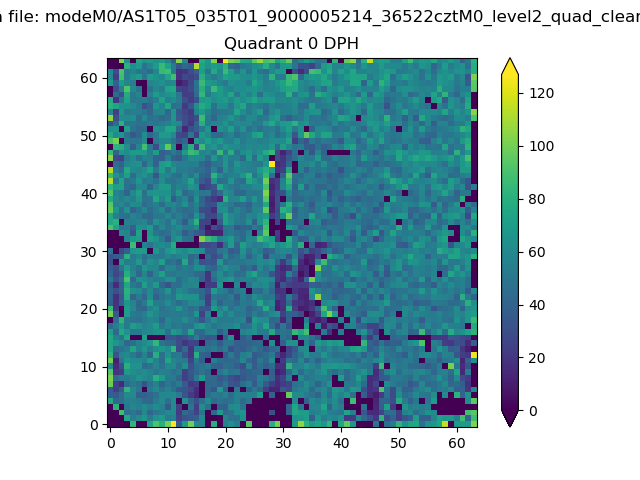 |
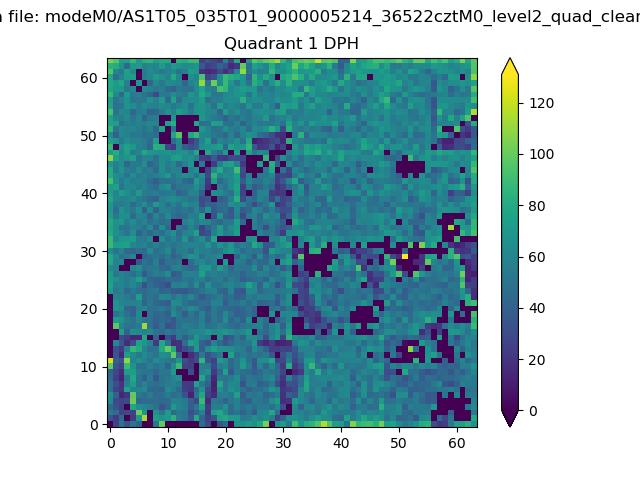 |
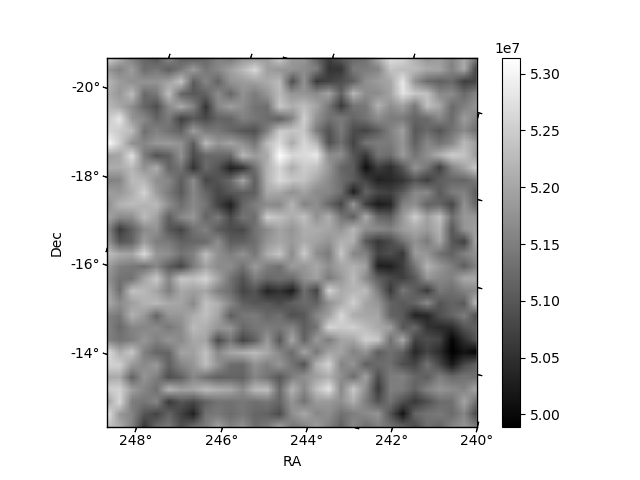
Quadrant B |
|---|---|---|---|
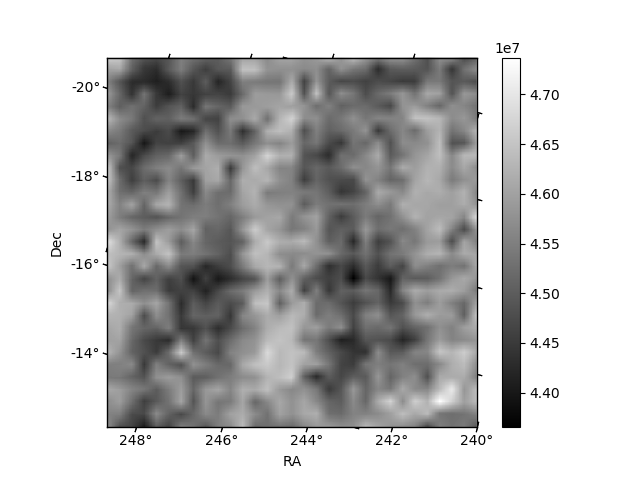
| Quadrant D | 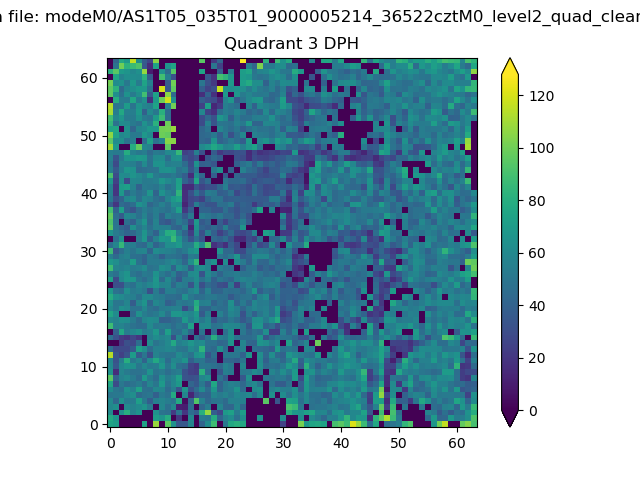 |
 |
Quadrant C |
| Plot type | Count rate plots | Images |
|---|---|---|
| Comparison with Poisson distribution Blue bars denote a histogram of data divided into 1 sec bins. Red curve is a Poisson curve with rate = median count rate of data. |
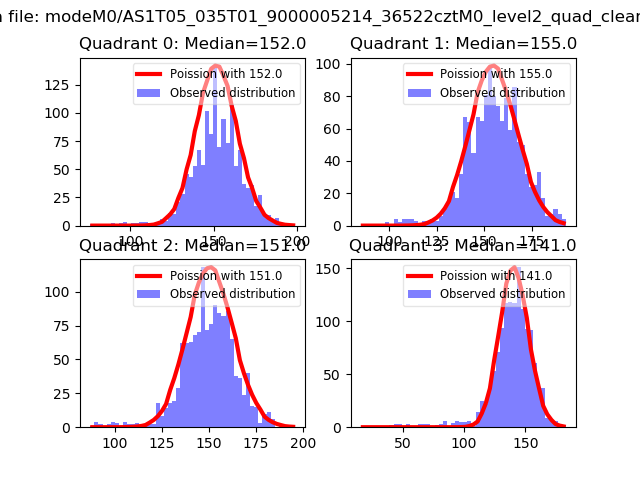 |
 |
| Quadrant-wise count rates Data is divided into 100 sec bins |
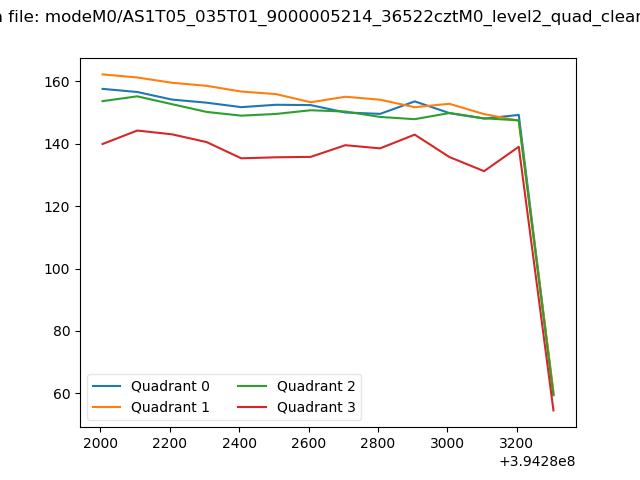 |
|
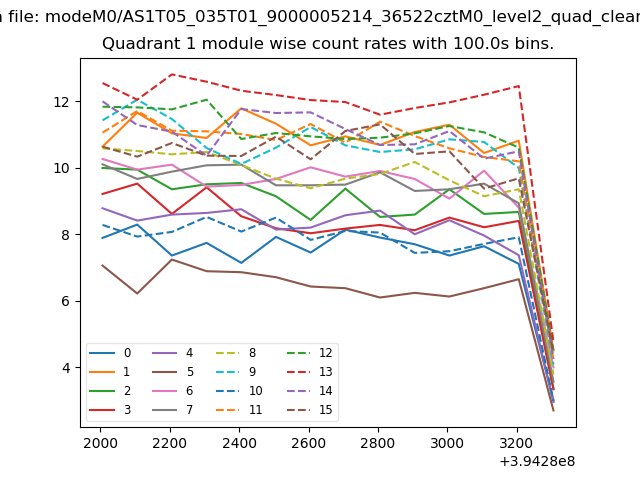
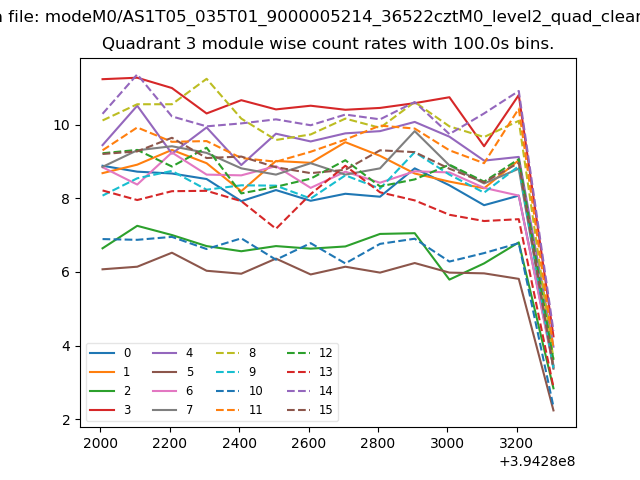
| Module-wise count rates for Quadrant A Data is divided into 100 sec bins |
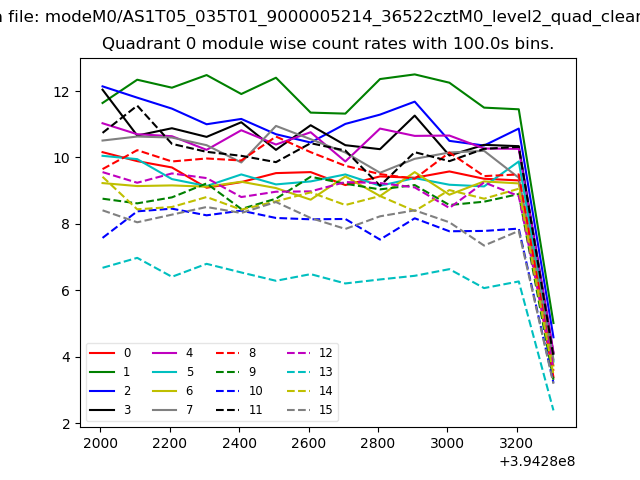 |
 |
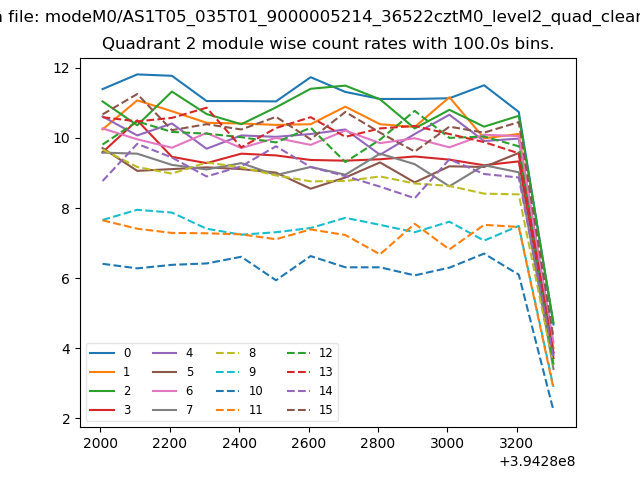
| Module-wise count rates for Quadrant B Data is divided into 100 sec bins |
 |
 |
| Module-wise count rates for Quadrant C Data is divided into 100 sec bins |
 |
 |
| Module-wise count rates for Quadrant D Data is divided into 100 sec bins |
 |
 |
| Parameter | Plot |
|---|---|
| CZT HV Monitor | 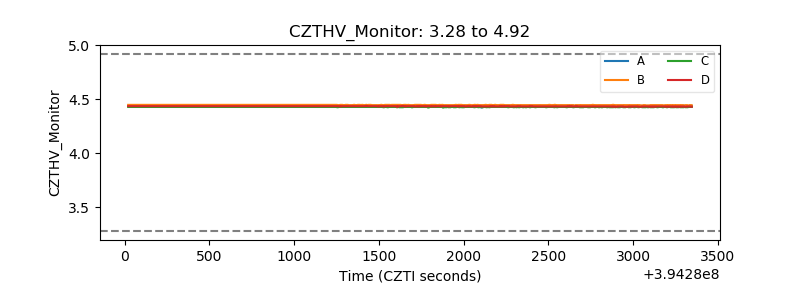 |
| D_VDD |  |
| Temperature 1 | 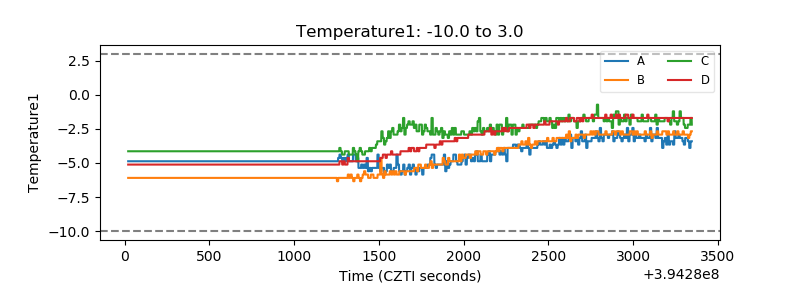 |
| Veto HV Monitor | 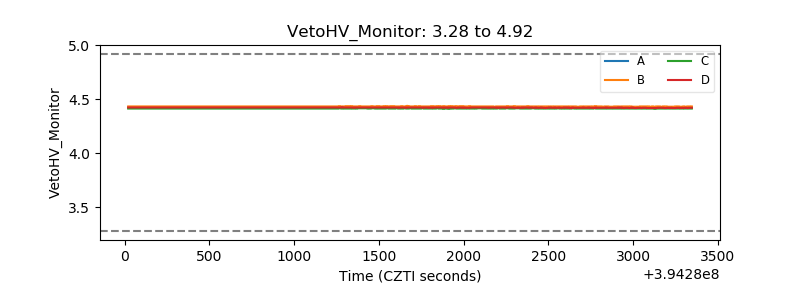 |
| Veto LLD | 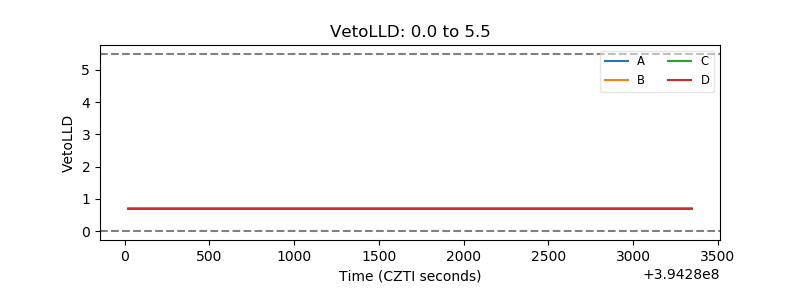 |
| Alpha Counter | 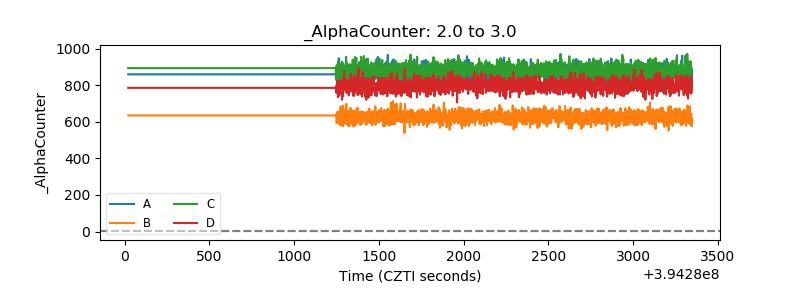 |
| _CPM_Rate | 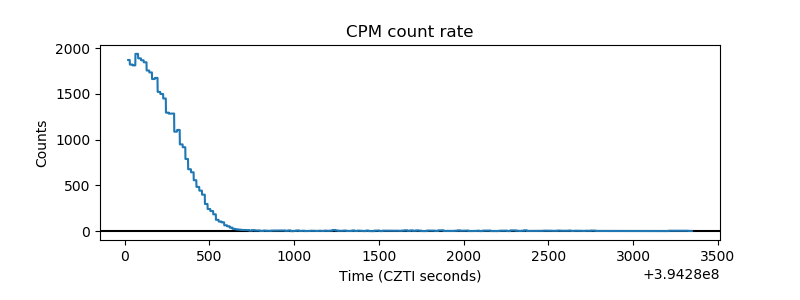 |
| CZT Counter | 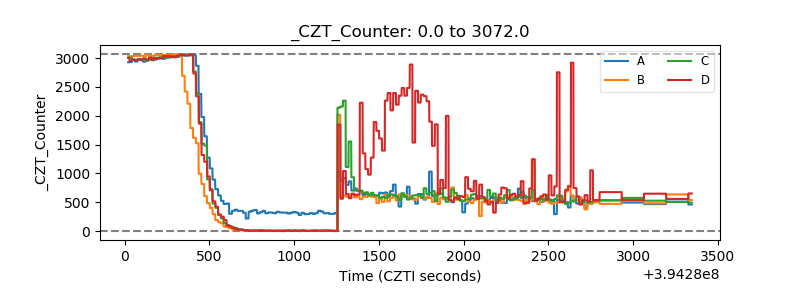 |
| +2.5 Volts monitor |  |
| +5 Volts monitor |  |
| _ROLL_ROT | 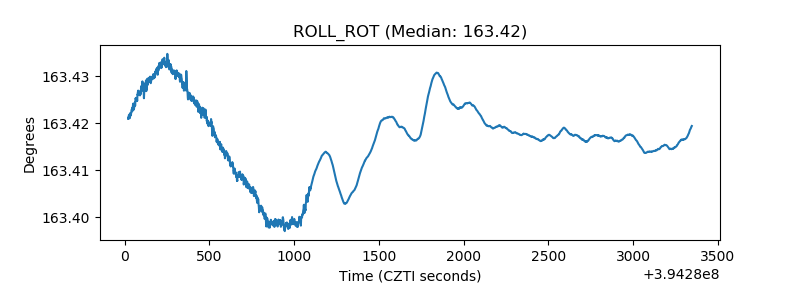 |
| _Roll_DEC |  |
| _Roll_RA | 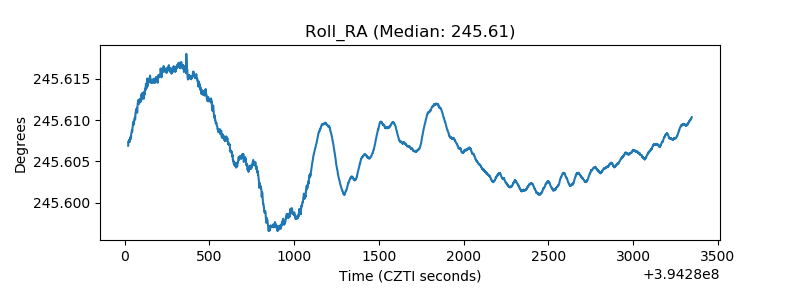 |
| Veto Counter | 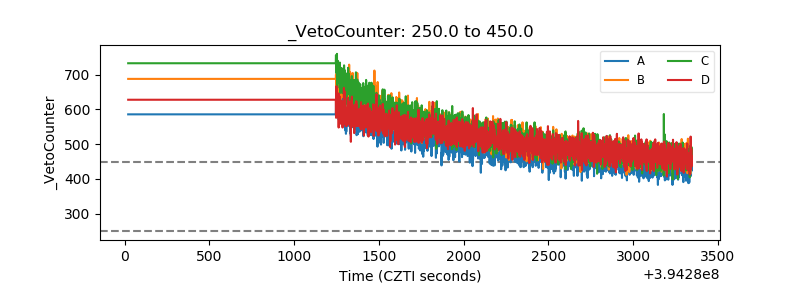 |