| Param | Original file | Final file |
|---|---|---|
| Filename | modeM0/AS1A11_089T02_9000005216cztM0_level2.fits | modeM0/AS1A11_089T02_9000005216cztM0_level2_quad_clean.evt |
| Size (bytes) | 1,244,692,800 | 1,235,358,720 |
| Size | 1.2 GB | 1.2 GB |
| Events in quadrant A | 7,752,630 | 7,674,240 |
| Events in quadrant B | 7,307,438 | 7,445,807 |
| Events in quadrant C | 7,345,362 | 7,038,411 |
| Events in quadrant D | 6,364,134 | 6,331,353 |
| Mode M9 | |||
|---|---|---|---|
| Quadrant | BADHDUFLAG | Total packets | Discarded packets |
| A | 0 | 507 | 0 |
| B | 0 | 507 | 0 |
| C | 0 | 507 | 0 |
| D | 0 | 507 | 0 |
| Mode M0 | |||
|---|---|---|---|
| Quadrant | BADHDUFLAG | Total packets | Discarded packets |
| A | 0 | 281751 | 0 |
| B | 0 | 302797 | 0 |
| C | 0 | 310502 | 0 |
| D | 0 | 373285 | 0 |
| Mode SS | |||
|---|---|---|---|
| Quadrant | BADHDUFLAG | Total packets | Discarded packets |
| A | 0 | 2664 | 0 |
| B | 0 | 2664 | 0 |
| C | 0 | 2664 | 0 |
| D | 0 | 2664 | 0 |
| Quadrant | Total seconds | Saturated seconds | Saturation percentage |
|---|---|---|---|
| A | 130223 | 856 | 0.657334% |
| B | 130223 | 1917 | 1.472090% |
| C | 130223 | 3592 | 2.758345% |
| D | 130223 | 6210 | 4.768743% |
Noise dominated data is calculated using 1-second bins in cleaned event files. If a bin has >2000 counts, and if more than 50% of those come from <1% of pixels, then it is considered to be noise-dominated and hence unusable.
| Quadrant | # 1 sec bins | Bins with >0 counts | Bins with >2000 counts | High rate bins dominated by noise | Noise dominated (total time) | Noise dominated (detector-on time) | Marked lightcurve |
|---|---|---|---|---|---|---|---|
| A | 180931 | 130198 | 0 | 0 | 0.00% | 0.00% |  |
| B | 180930 | 130208 | 0 | 0 | 0.00% | 0.00% |  |
| C | 180931 | 130105 | 0 | 0 | 0.00% | 0.00% |  |
| D | 180931 | 130129 | 0 | 0 | 0.00% | 0.00% |  |
Top three noisy pixels from each quadrant. If the there are fewer than three noisy pixels in the level2.evt file, extra rows are filled as -1
| Pixel properties | Quadrant properties | ||||||
|---|---|---|---|---|---|---|---|
| Quadrant | DetID | PixID | Counts | Sigma | Mean | Median | Sigma |
| A | 7 | 110 | 6280 | 8.87 | 2025 | 1908 | 492.6 |
| A | 9 | 19 | 6244 | 8.8 | 2025 | 1908 | 492.6 |
| A | 0 | 29 | 6132 | 8.57 | 2025 | 1908 | 492.6 |
| B | 2 | 9 | 6055 | 11.23 | 1936 | 1851 | 374.4 |
| B | 3 | 80 | 5718 | 10.33 | 1936 | 1851 | 374.4 |
| B | 5 | 128 | 5058 | 8.56 | 1936 | 1851 | 374.4 |
| C | 1 | 81 | 5978 | 8.39 | 1943 | 1826 | 494.7 |
| C | 1 | 80 | 5847 | 8.13 | 1943 | 1826 | 494.7 |
| C | 3 | 203 | 5784 | 8.0 | 1943 | 1826 | 494.7 |
| D | 7 | 3 | 4823 | 6.58 | 1827 | 1671 | 478.8 |
| D | 4 | 160 | 4749 | 6.43 | 1827 | 1671 | 478.8 |
| D | 10 | 113 | 4660 | 6.24 | 1827 | 1671 | 478.8 |
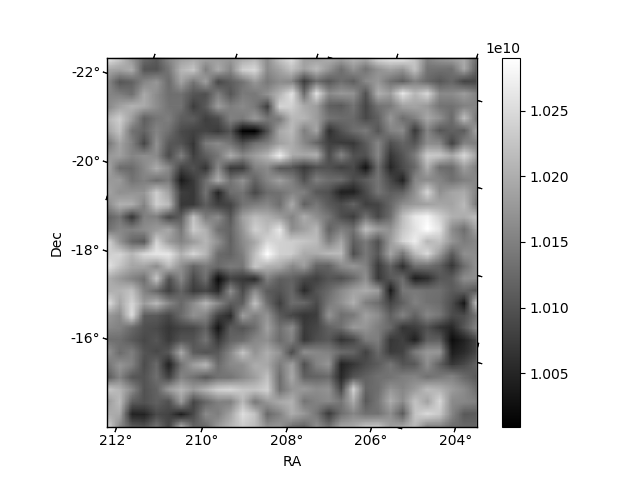
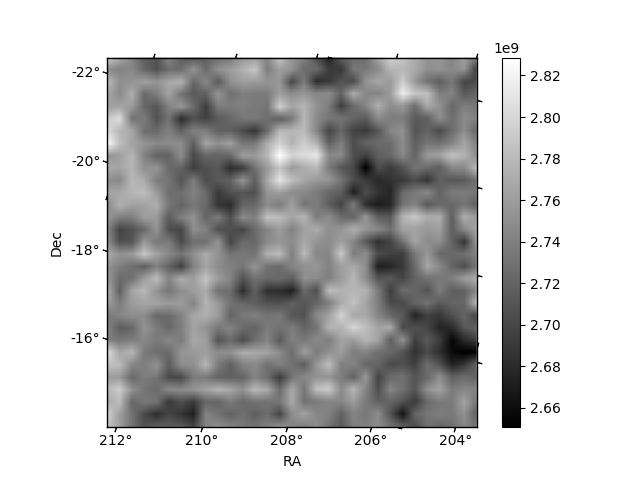
Histogram calculated using DETX and DETY for each event in the final _common_clean file
| Quadrant A | 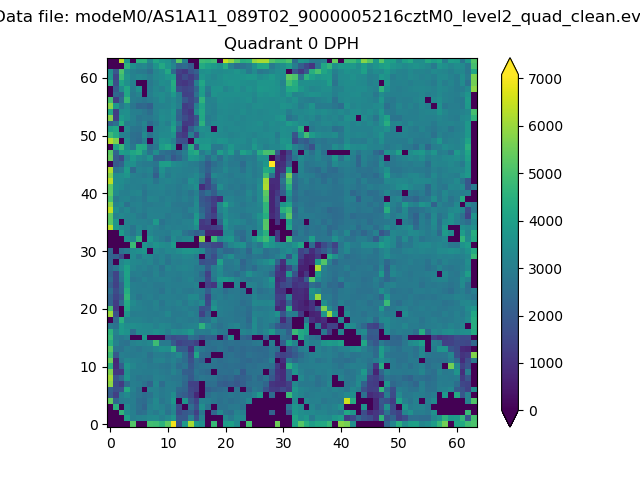 |
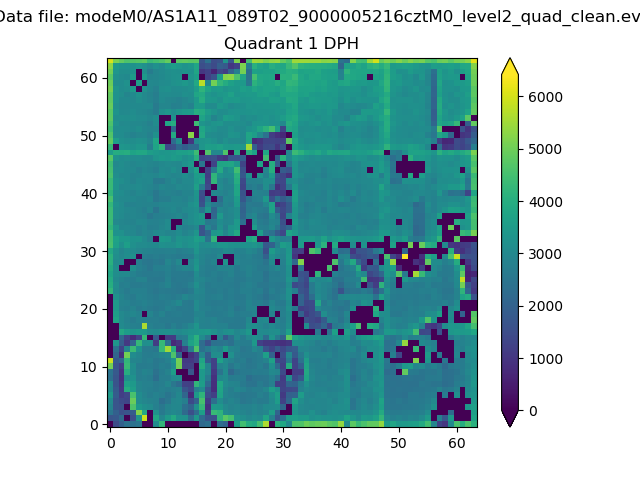 |
Quadrant B |
|---|---|---|---|
| Quadrant D | 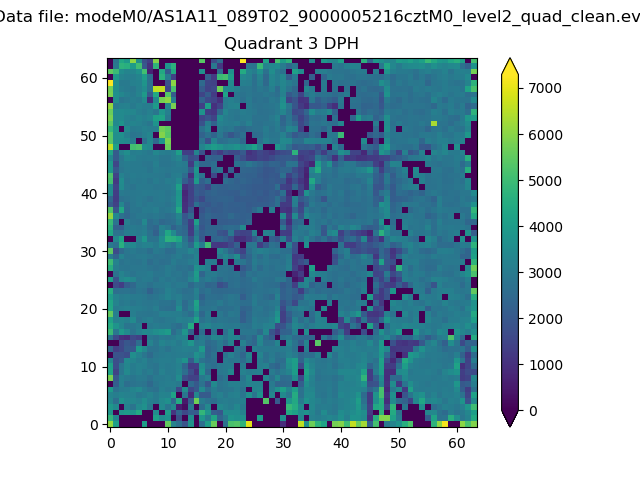 |
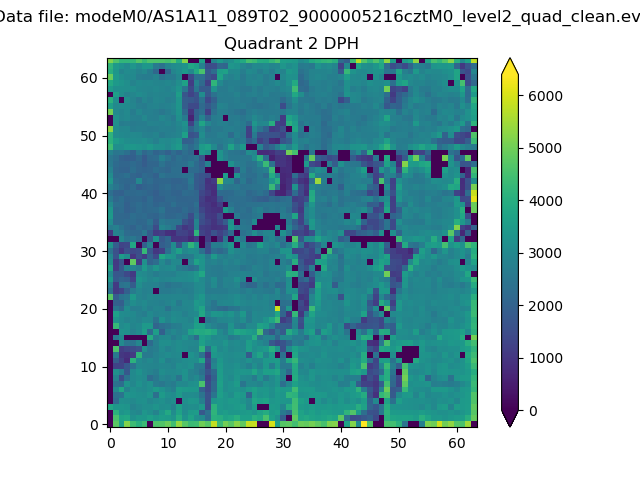 |
Quadrant C |
| Plot type | Count rate plots | Images |
|---|---|---|
| Comparison with Poisson distribution Blue bars denote a histogram of data divided into 1 sec bins. Red curve is a Poisson curve with rate = median count rate of data. |
 |
 |
| Quadrant-wise count rates Data is divided into 100 sec bins |
 |
|
| Module-wise count rates for Quadrant A Data is divided into 100 sec bins |
 |
 |
| Module-wise count rates for Quadrant B Data is divided into 100 sec bins |
 |
 |
| Module-wise count rates for Quadrant C Data is divided into 100 sec bins |
 |
 |
| Module-wise count rates for Quadrant D Data is divided into 100 sec bins |
 |
 |
| Parameter | Plot |
|---|---|
| CZT HV Monitor | 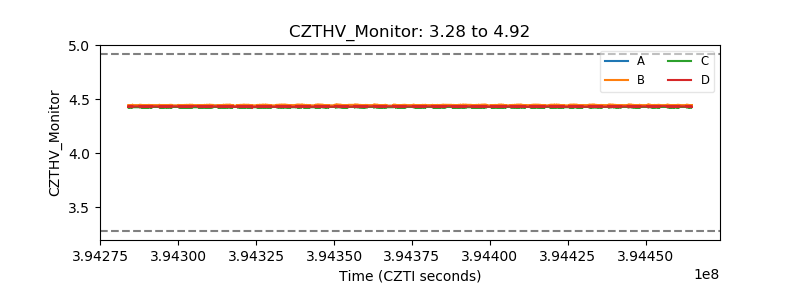 |
| D_VDD |  |
| Temperature 1 |  |
| Veto HV Monitor | 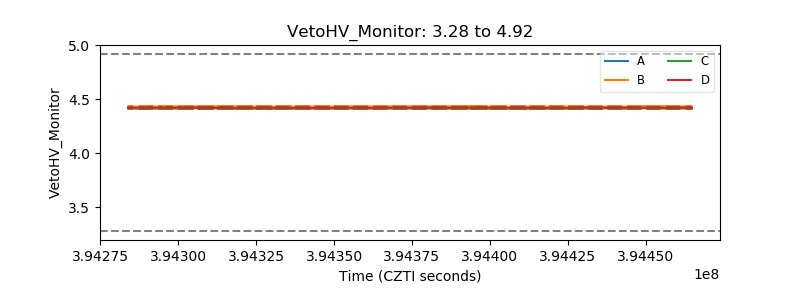 |
| Veto LLD | 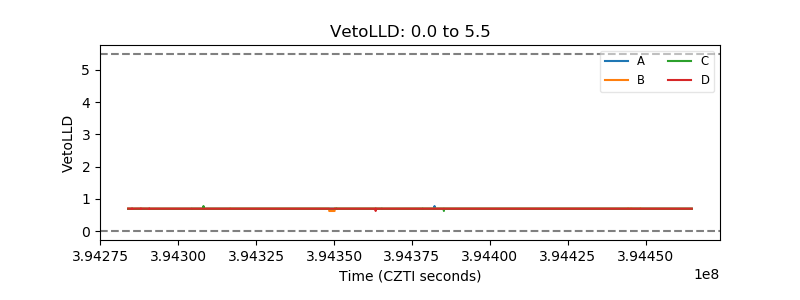 |
| Alpha Counter |  |
| _CPM_Rate |  |
| CZT Counter |  |
| +2.5 Volts monitor | 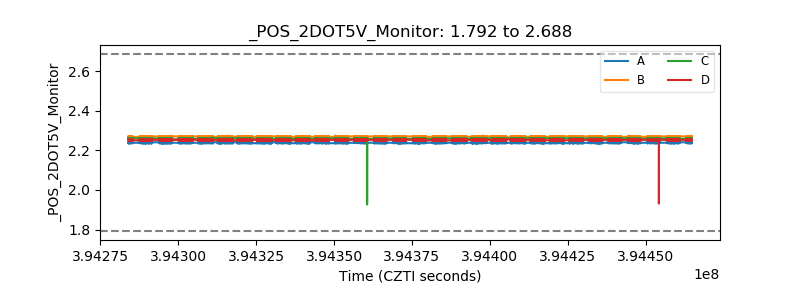 |
| +5 Volts monitor | 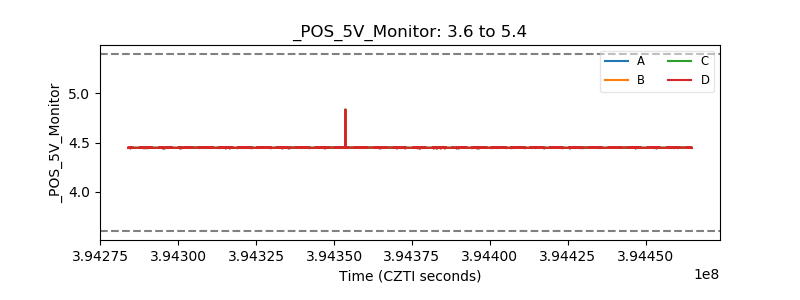 |
| _ROLL_ROT |  |
| _Roll_DEC |  |
| _Roll_RA | 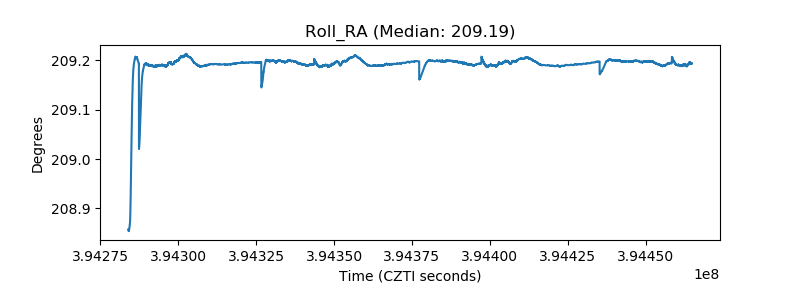 |
| Veto Counter |  |