| Param | Original file | Final file |
|---|---|---|
| Filename | modeM0/AS1A11_089T02_9000005216_36522cztM0_level2.evt | modeM0/AS1A11_089T02_9000005216_36522cztM0_level2_quad_clean.evt |
| Size (bytes) | 256,809,600 | 39,300,480 |
| Size | 244.9 MB | 37.5 MB |
| Events in quadrant A | 1,219,050 | 273,897 |
| Events in quadrant B | 1,293,587 | 272,881 |
| Events in quadrant C | 1,379,089 | 262,301 |
| Events in quadrant D | 3,731,543 | 218,219 |
| Mode M9 | |||
|---|---|---|---|
| Quadrant | BADHDUFLAG | Total packets | Discarded packets |
| A | 0 | 21 | 0 |
| B | 0 | 21 | 0 |
| C | 0 | 21 | 0 |
| D | 0 | 21 | 0 |
| Mode M0 | |||
|---|---|---|---|
| Quadrant | BADHDUFLAG | Total packets | Discarded packets |
| A | 0 | 5003 | 2 |
| B | 0 | 5236 | 1 |
| C | 0 | 5410 | 1 |
| D | 0 | 12648 | 1 |
| Mode SS | |||
|---|---|---|---|
| Quadrant | BADHDUFLAG | Total packets | Discarded packets |
| A | 0 | 48 | 0 |
| B | 0 | 48 | 0 |
| C | 0 | 48 | 0 |
| D | 0 | 48 | 0 |
| Quadrant | Total seconds | Saturated seconds | Saturation percentage |
|---|---|---|---|
| A | 2243 | 6 | 0.267499% |
| B | 2243 | 30 | 1.337494% |
| C | 2243 | 75 | 3.343736% |
| D | 2243 | 826 | 36.825680% |
Noise dominated data is calculated using 1-second bins in cleaned event files. If a bin has >2000 counts, and if more than 50% of those come from <1% of pixels, then it is considered to be noise-dominated and hence unusable.
| Quadrant | # 1 sec bins | Bins with >0 counts | Bins with >2000 counts | High rate bins dominated by noise | Noise dominated (total time) | Noise dominated (detector-on time) | Marked lightcurve |
|---|---|---|---|---|---|---|---|
| A | 4366 | 2244 | 4 | 4 | 0.09% | 0.18% | 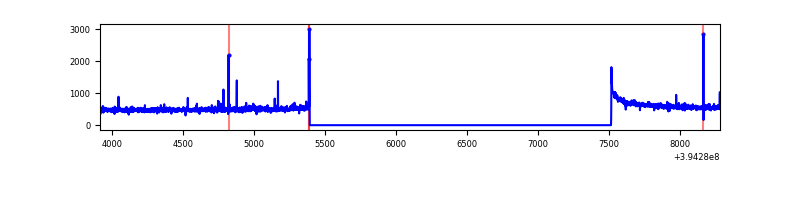 |
| B | 4366 | 2244 | 14 | 14 | 0.32% | 0.62% | 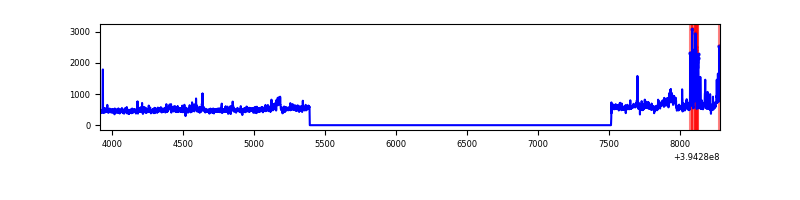 |
| C | 4366 | 2244 | 47 | 47 | 1.08% | 2.09% | 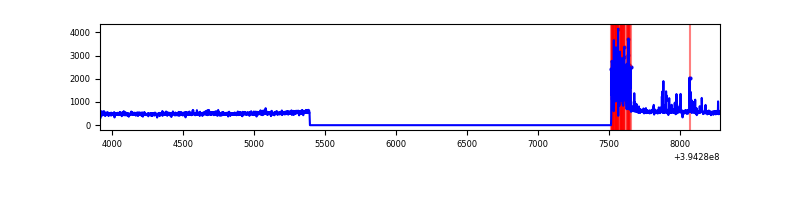 |
| D | 4366 | 2244 | 852 | 852 | 19.51% | 37.97% | 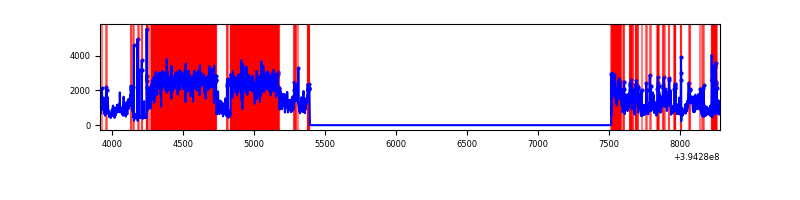 |
Top three noisy pixels from each quadrant. If the there are fewer than three noisy pixels in the level2.evt file, extra rows are filled as -1
| Pixel properties | Quadrant properties | ||||||
|---|---|---|---|---|---|---|---|
| Quadrant | DetID | PixID | Counts | Sigma | Mean | Median | Sigma |
| A | 10 | 83 | 91757 | 1555.86 | 285 | 281 | 58.8 |
| A | 9 | 143 | 21152 | 354.98 | 285 | 281 | 58.8 |
| A | 13 | 254 | 3889 | 61.37 | 285 | 281 | 58.8 |
| B | 5 | 172 | 74498 | 1350.8 | 279 | 273 | 54.9 |
| B | 0 | 189 | 58694 | 1063.19 | 279 | 273 | 54.9 |
| B | 0 | 190 | 18178 | 325.85 | 279 | 273 | 54.9 |
| C | 0 | 10 | 231632 | 3645.95 | 269 | 272 | 63.5 |
| C | 15 | 214 | 96101 | 1510.15 | 269 | 272 | 63.5 |
| C | 13 | 61 | 1785 | 23.84 | 269 | 272 | 63.5 |
| D | 12 | 227 | 2335466 | 37759.03 | 246 | 240 | 61.8 |
| D | 13 | 249 | 92235 | 1487.5 | 246 | 240 | 61.8 |
| D | 12 | 235 | 77260 | 1245.36 | 246 | 240 | 61.8 |
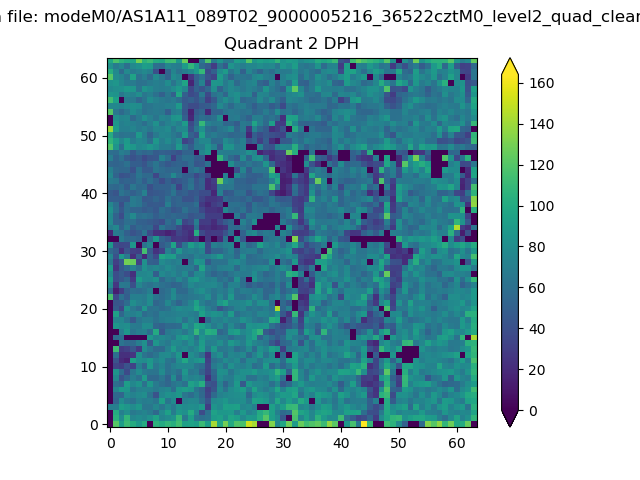
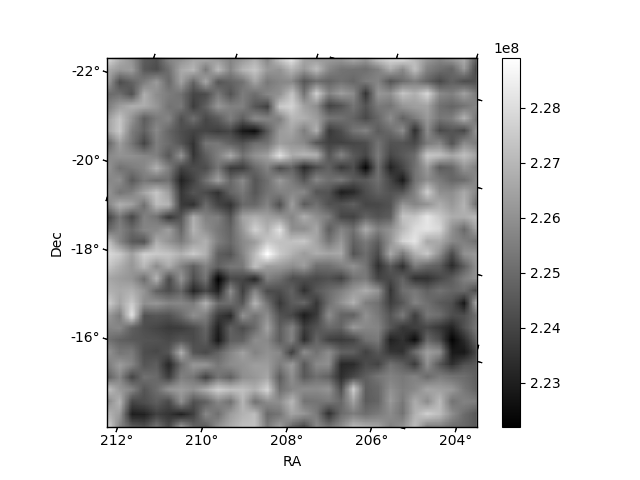
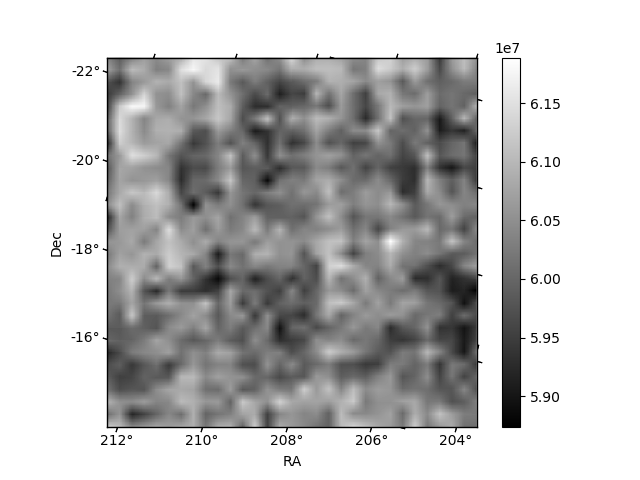
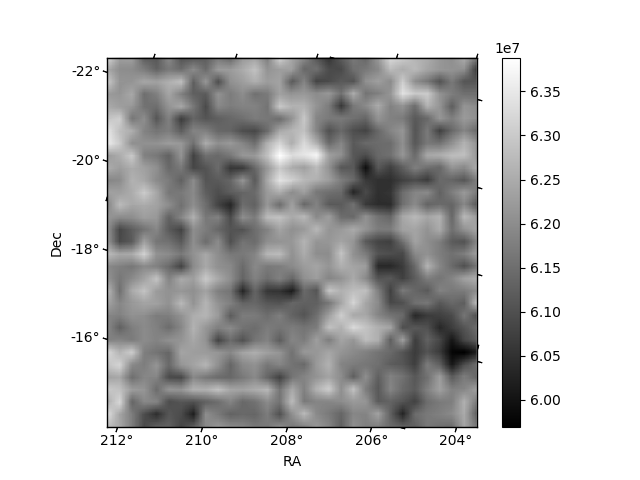
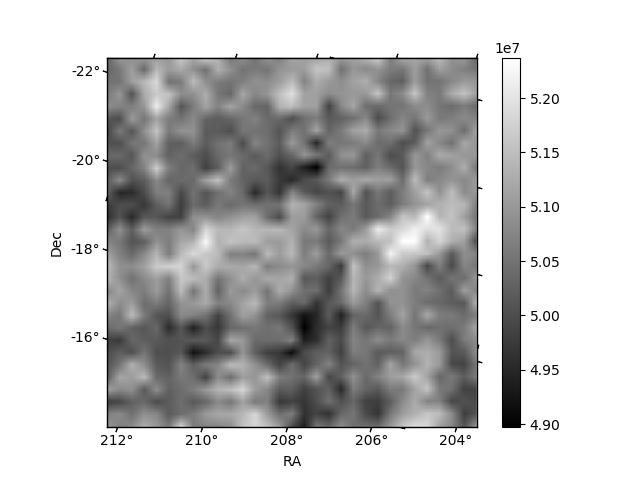
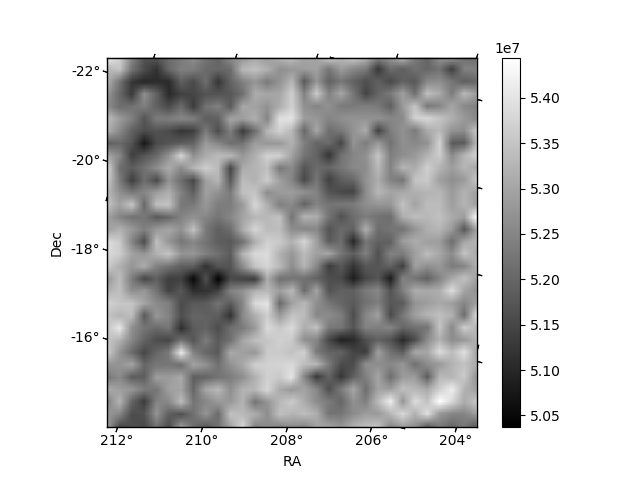
Histogram calculated using DETX and DETY for each event in the final _common_clean file
| Quadrant A | 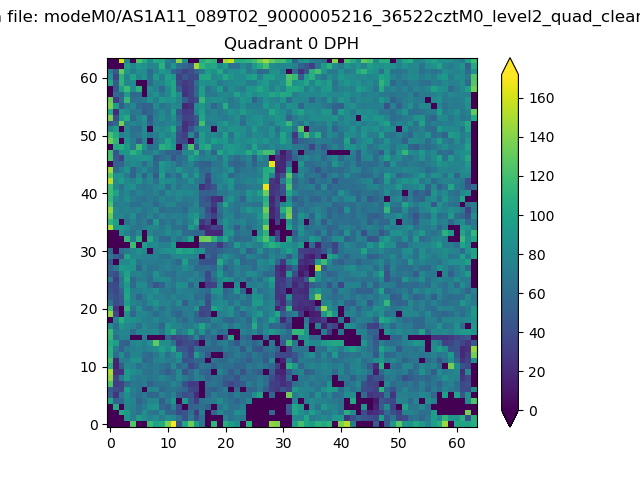 |
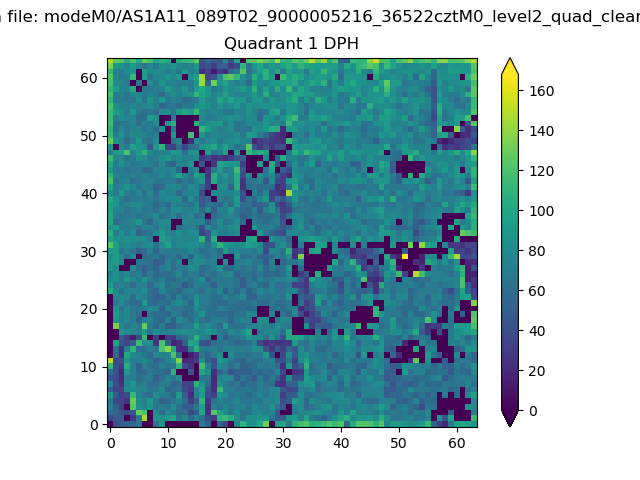 |
Quadrant B |
|---|---|---|---|
| Quadrant D | 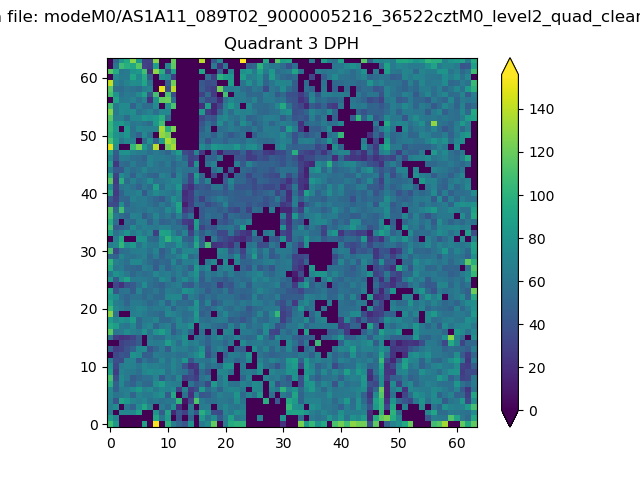 |
 |
Quadrant C |
| Plot type | Count rate plots | Images |
|---|---|---|
| Comparison with Poisson distribution Blue bars denote a histogram of data divided into 1 sec bins. Red curve is a Poisson curve with rate = median count rate of data. |
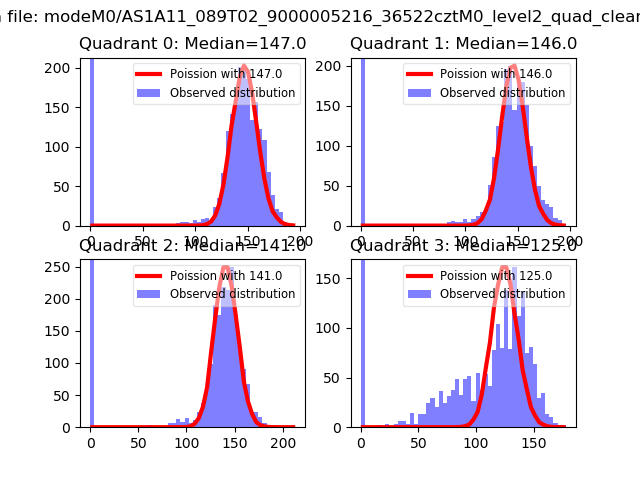 |
 |
| Quadrant-wise count rates Data is divided into 100 sec bins |
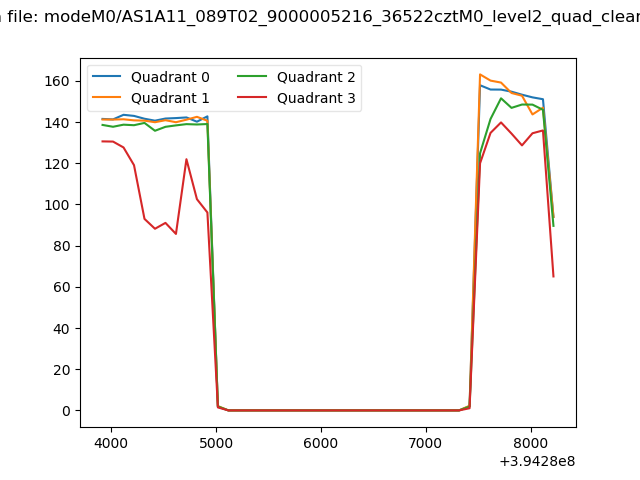 |
|
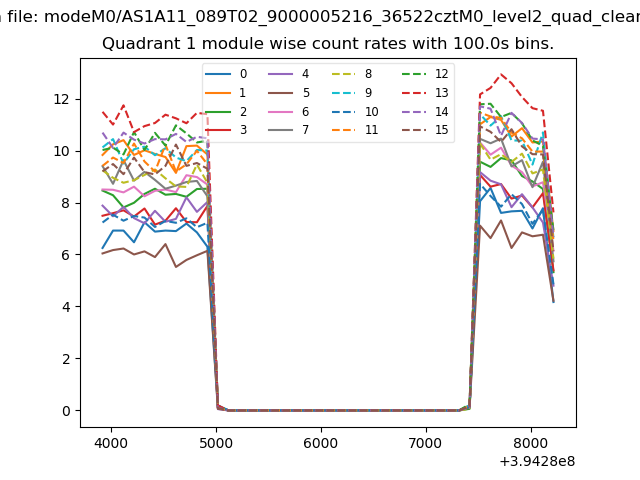
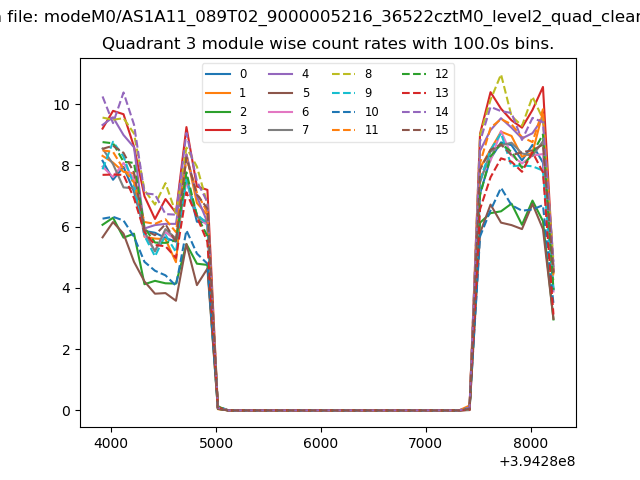
| Module-wise count rates for Quadrant A Data is divided into 100 sec bins |
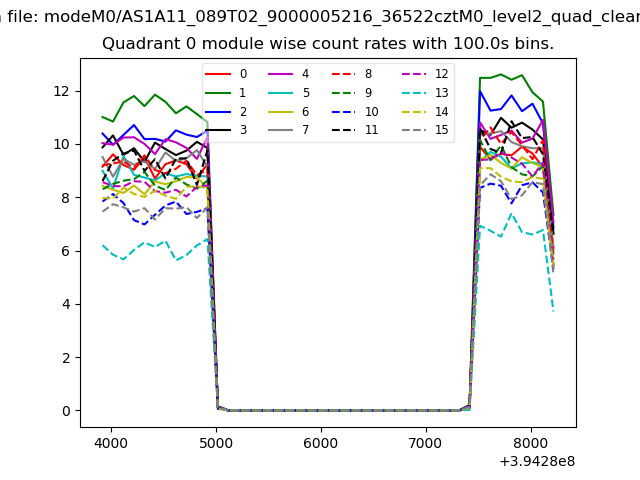 |
 |
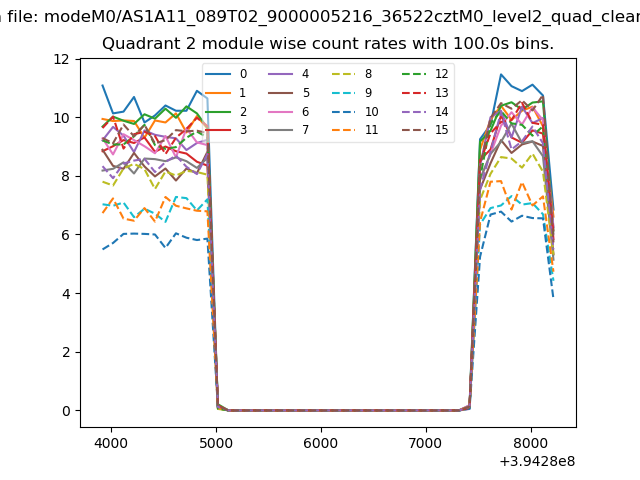
| Module-wise count rates for Quadrant B Data is divided into 100 sec bins |
 |
 |
| Module-wise count rates for Quadrant C Data is divided into 100 sec bins |
 |
 |
| Module-wise count rates for Quadrant D Data is divided into 100 sec bins |
 |
 |
| Parameter | Plot |
|---|---|
| CZT HV Monitor | 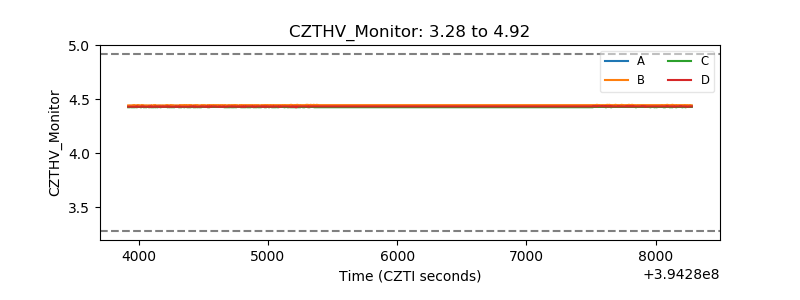 |
| D_VDD | 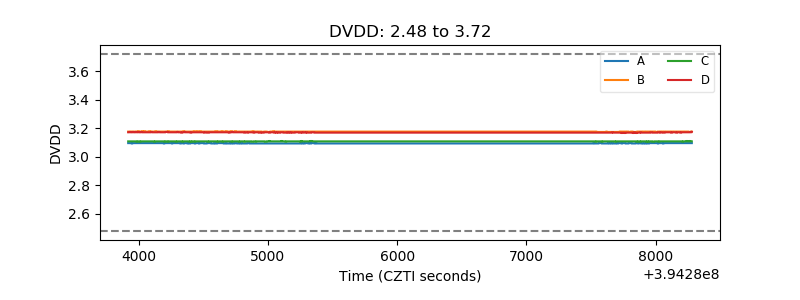 |
| Temperature 1 | 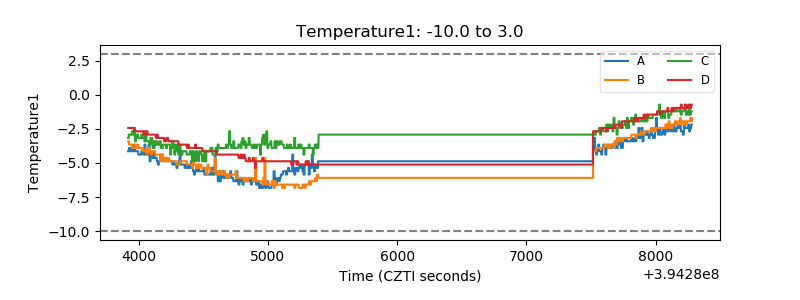 |
| Veto HV Monitor | 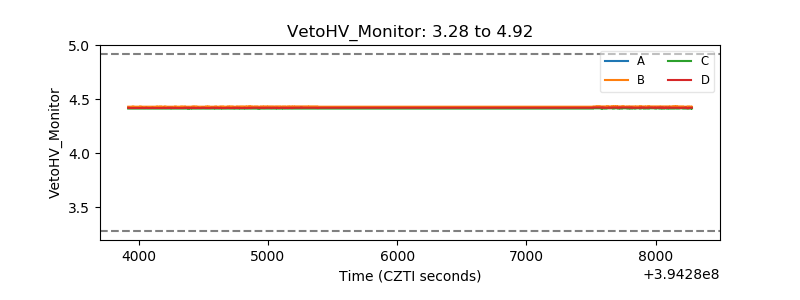 |
| Veto LLD | 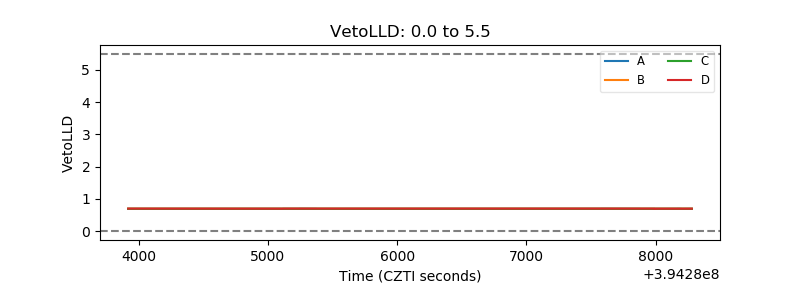 |
| Alpha Counter | 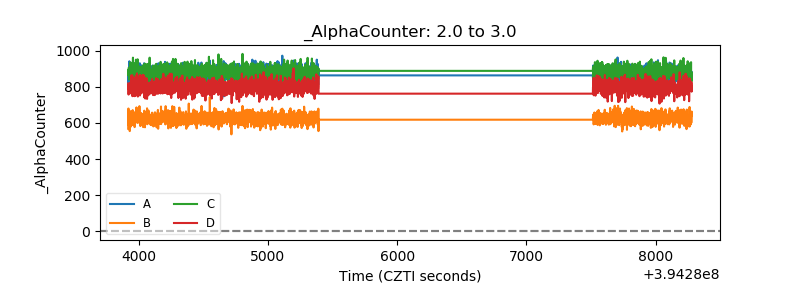 |
| _CPM_Rate | 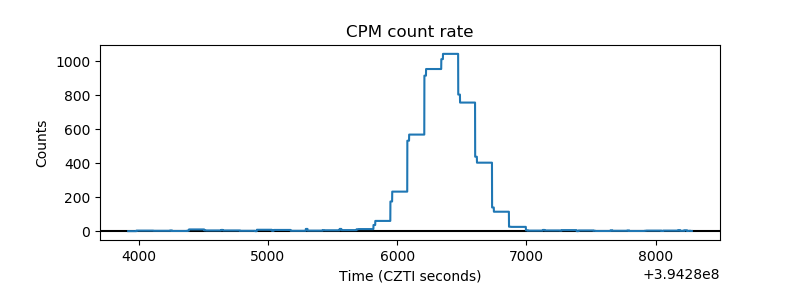 |
| CZT Counter | 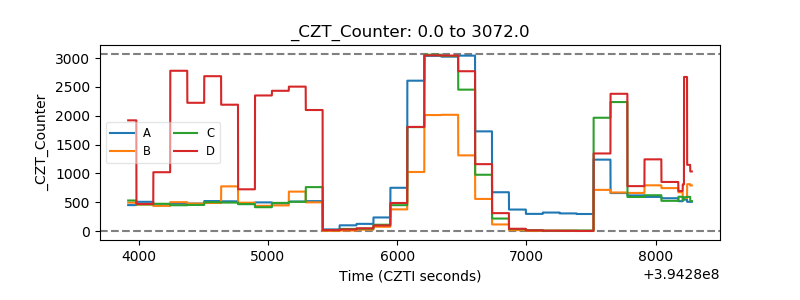 |
| +2.5 Volts monitor |  |
| +5 Volts monitor |  |
| _ROLL_ROT | 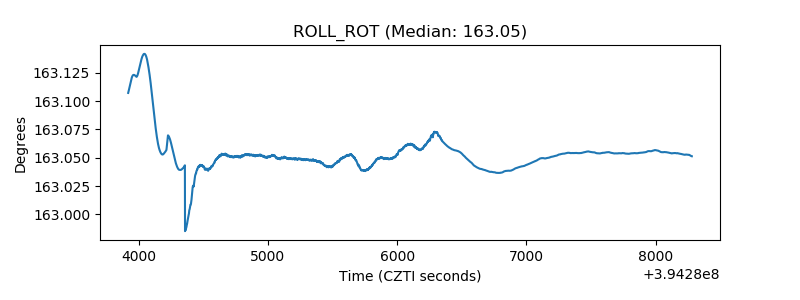 |
| _Roll_DEC | 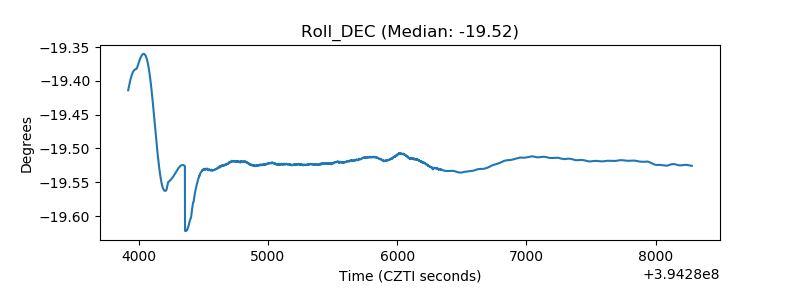 |
| _Roll_RA | 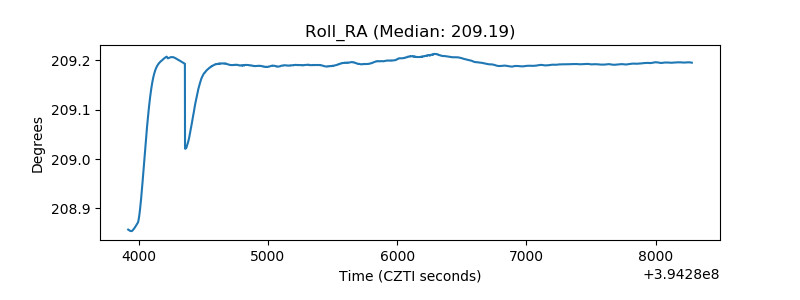 |
| Veto Counter | 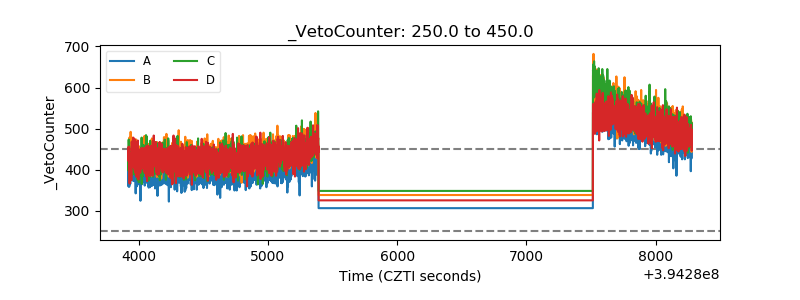 |