| Param | Original file | Final file |
|---|---|---|
| Filename | modeM0/AS1A11_089T02_9000005216_36523cztM0_level2.evt | modeM0/AS1A11_089T02_9000005216_36523cztM0_level2_quad_clean.evt |
| Size (bytes) | 461,566,080 | 89,066,880 |
| Size | 440.2 MB | 84.9 MB |
| Events in quadrant A | 2,691,006 | 613,233 |
| Events in quadrant B | 3,234,663 | 601,818 |
| Events in quadrant C | 2,938,191 | 584,389 |
| Events in quadrant D | 4,767,964 | 539,476 |
| Mode M9 | |||
|---|---|---|---|
| Quadrant | BADHDUFLAG | Total packets | Discarded packets |
| A | 0 | 21 | 0 |
| B | 0 | 21 | 0 |
| C | 0 | 21 | 0 |
| D | 0 | 22 | 0 |
| Mode M0 | |||
|---|---|---|---|
| Quadrant | BADHDUFLAG | Total packets | Discarded packets |
| A | 0 | 11091 | 3 |
| B | 0 | 12942 | 2 |
| C | 0 | 11763 | 2 |
| D | 0 | 17599 | 2 |
| Mode SS | |||
|---|---|---|---|
| Quadrant | BADHDUFLAG | Total packets | Discarded packets |
| A | 0 | 106 | 0 |
| B | 0 | 106 | 0 |
| C | 0 | 106 | 0 |
| D | 0 | 106 | 0 |
| Quadrant | Total seconds | Saturated seconds | Saturation percentage |
|---|---|---|---|
| A | 5106 | 10 | 0.195848% |
| B | 5106 | 102 | 1.997650% |
| C | 5106 | 126 | 2.467685% |
| D | 5106 | 545 | 10.673717% |
Noise dominated data is calculated using 1-second bins in cleaned event files. If a bin has >2000 counts, and if more than 50% of those come from <1% of pixels, then it is considered to be noise-dominated and hence unusable.
| Quadrant | # 1 sec bins | Bins with >0 counts | Bins with >2000 counts | High rate bins dominated by noise | Noise dominated (total time) | Noise dominated (detector-on time) | Marked lightcurve |
|---|---|---|---|---|---|---|---|
| A | 7229 | 5107 | 2 | 2 | 0.03% | 0.04% | 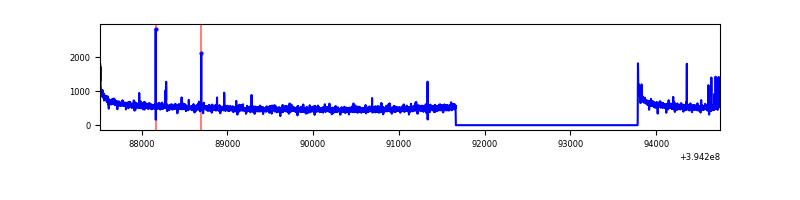 |
| B | 7229 | 5107 | 67 | 67 | 0.93% | 1.31% | 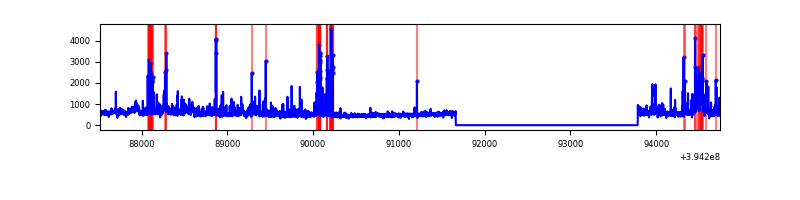 |
| C | 7229 | 5107 | 79 | 79 | 1.09% | 1.55% | 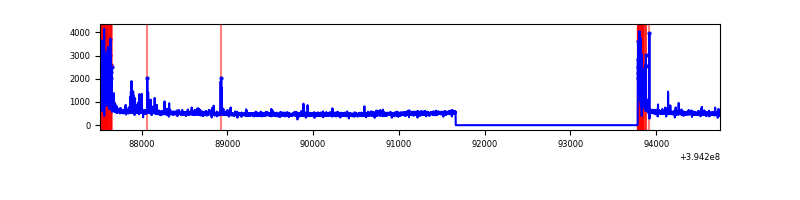 |
| D | 7229 | 5107 | 458 | 458 | 6.34% | 8.97% | 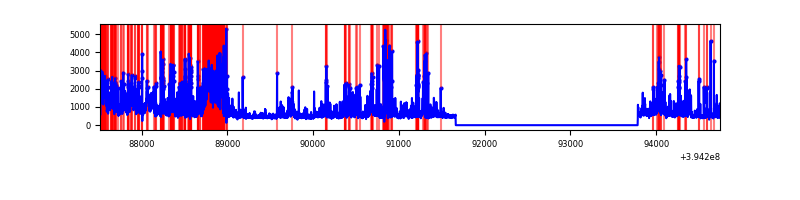 |
Top three noisy pixels from each quadrant. If the there are fewer than three noisy pixels in the level2.evt file, extra rows are filled as -1
| Pixel properties | Quadrant properties | ||||||
|---|---|---|---|---|---|---|---|
| Quadrant | DetID | PixID | Counts | Sigma | Mean | Median | Sigma |
| A | 10 | 83 | 202409 | 1587.92 | 632 | 621 | 127.1 |
| A | 9 | 143 | 26040 | 200.03 | 632 | 621 | 127.1 |
| A | 14 | 254 | 13001 | 97.42 | 632 | 621 | 127.1 |
| B | 5 | 172 | 268382 | 2295.86 | 611 | 598 | 116.6 |
| B | 5 | 255 | 242479 | 2073.78 | 611 | 598 | 116.6 |
| B | 0 | 189 | 144947 | 1237.59 | 611 | 598 | 116.6 |
| C | 0 | 10 | 390092 | 2855.84 | 592 | 598 | 136.4 |
| C | 15 | 214 | 217476 | 1590.19 | 592 | 598 | 136.4 |
| C | 15 | 159 | 16892 | 119.47 | 592 | 598 | 136.4 |
| D | 12 | 227 | 895418 | 6242.69 | 585 | 572 | 143.3 |
| D | 13 | 249 | 284635 | 1981.7 | 585 | 572 | 143.3 |
| D | 12 | 16 | 272901 | 1899.84 | 585 | 572 | 143.3 |
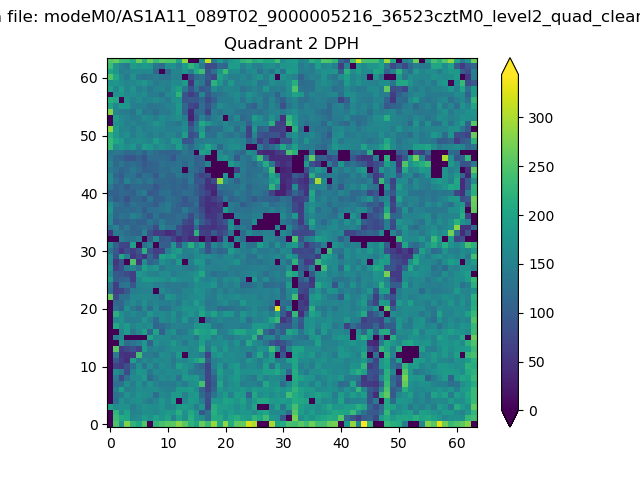
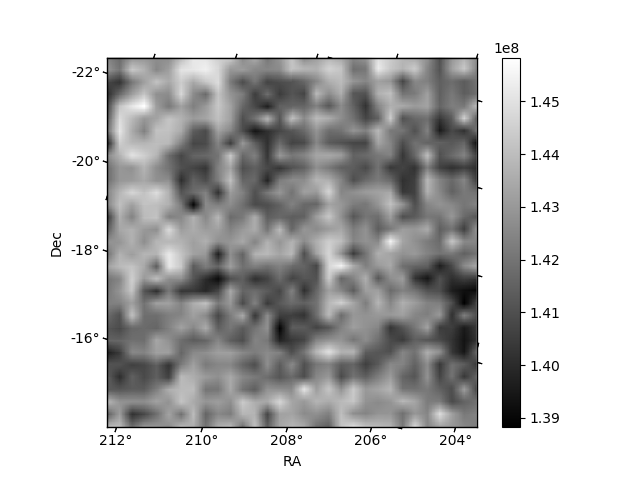
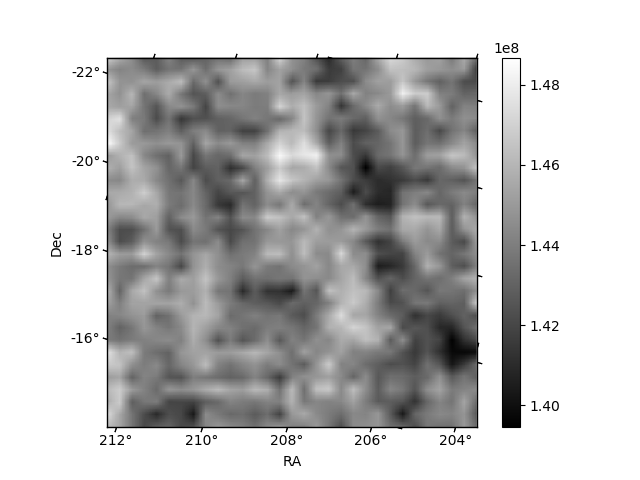
Histogram calculated using DETX and DETY for each event in the final _common_clean file
| Quadrant A |  |
 |
Quadrant B |
|---|---|---|---|
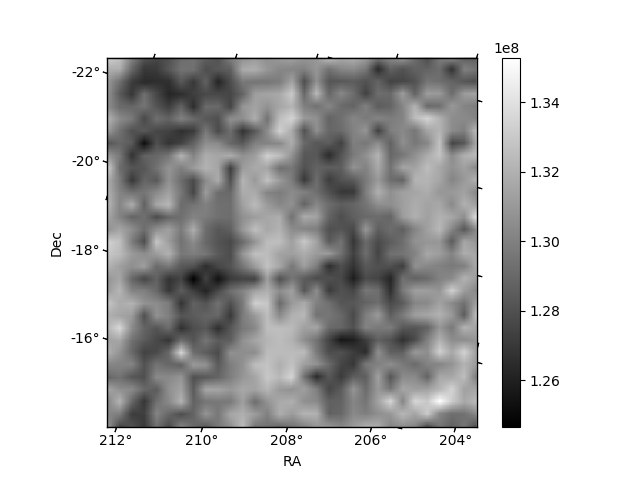
| Quadrant D |  |
 |
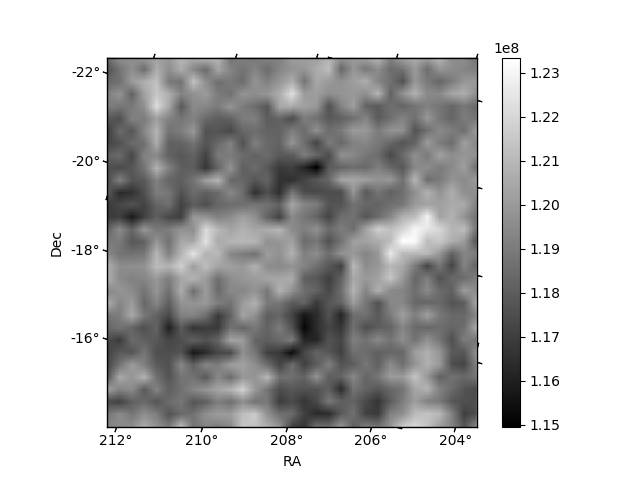
Quadrant C |
| Plot type | Count rate plots | Images |
|---|---|---|
| Comparison with Poisson distribution Blue bars denote a histogram of data divided into 1 sec bins. Red curve is a Poisson curve with rate = median count rate of data. |
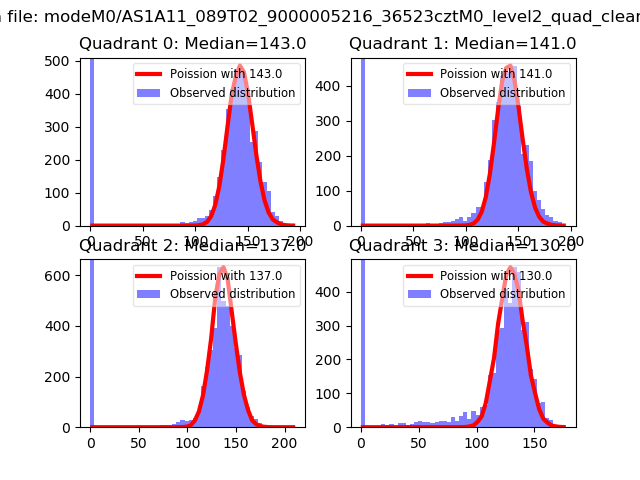 |
 |
| Quadrant-wise count rates Data is divided into 100 sec bins |
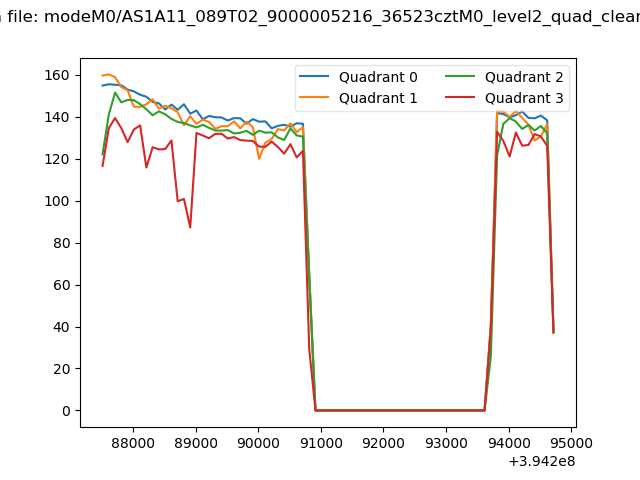 |
|
| Module-wise count rates for Quadrant A Data is divided into 100 sec bins |
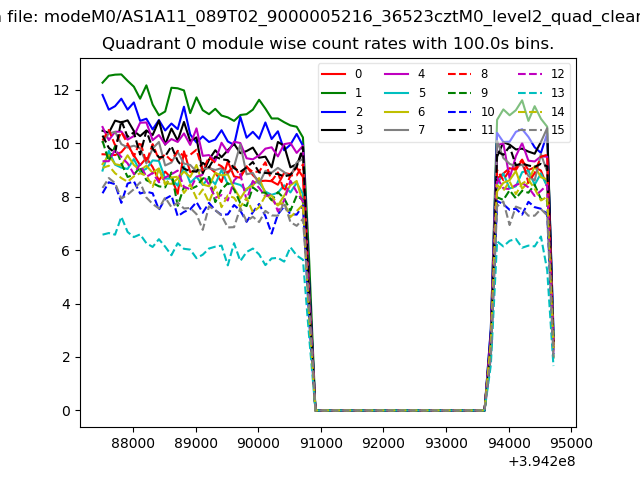 |
 |
| Module-wise count rates for Quadrant B Data is divided into 100 sec bins |
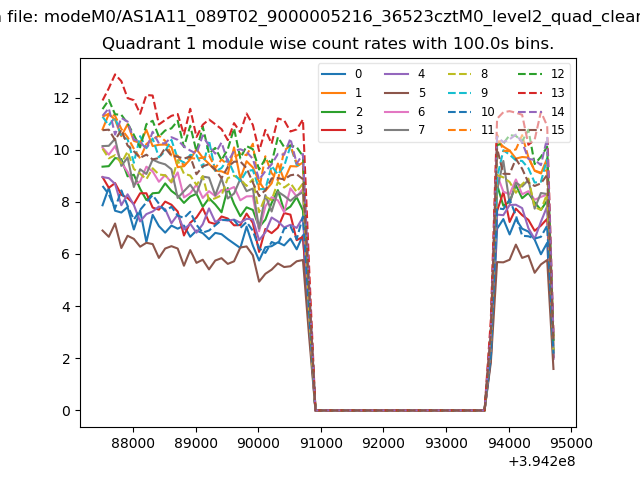 |
 |
| Module-wise count rates for Quadrant C Data is divided into 100 sec bins |
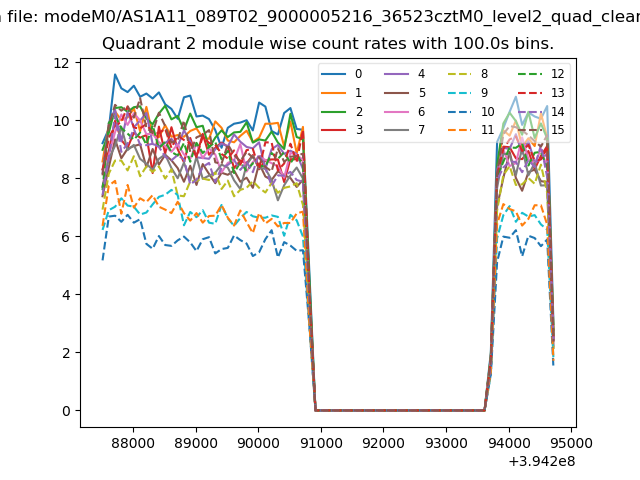 |
 |
| Module-wise count rates for Quadrant D Data is divided into 100 sec bins |
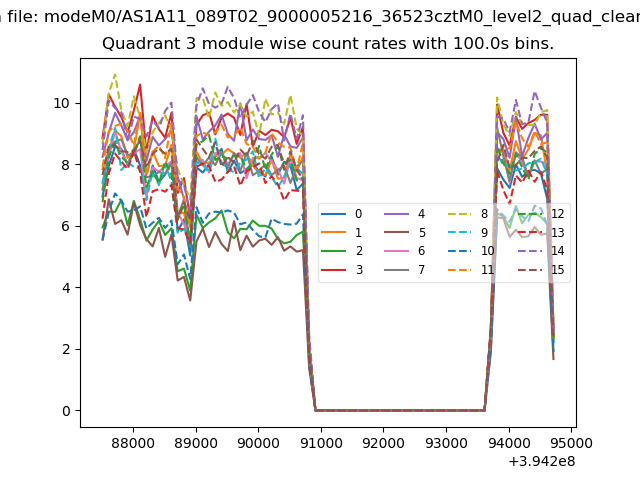 |
 |
| Parameter | Plot |
|---|---|
| CZT HV Monitor | 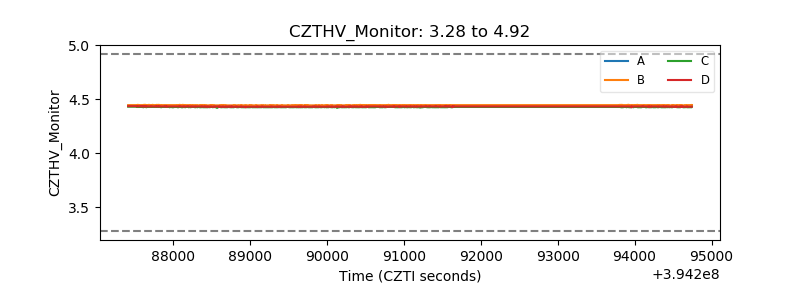 |
| D_VDD | 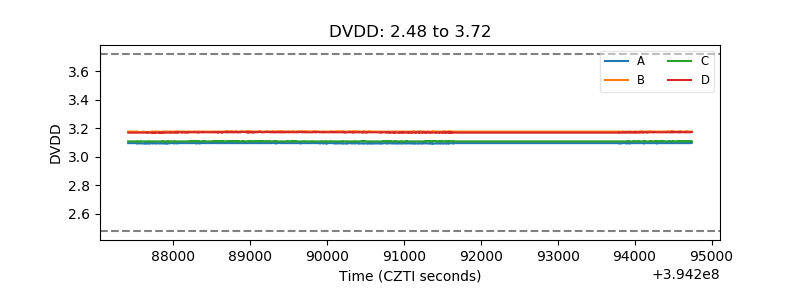 |
| Temperature 1 | 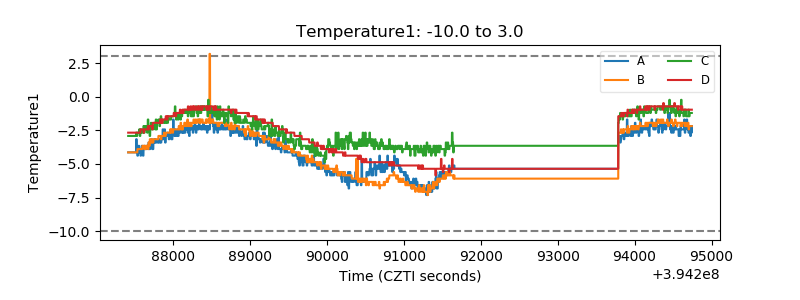 |
| Veto HV Monitor | 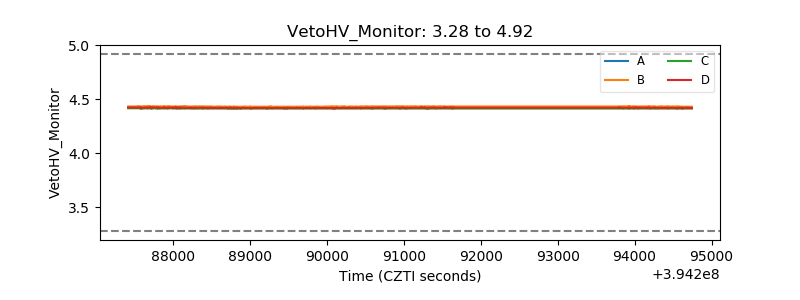 |
| Veto LLD | 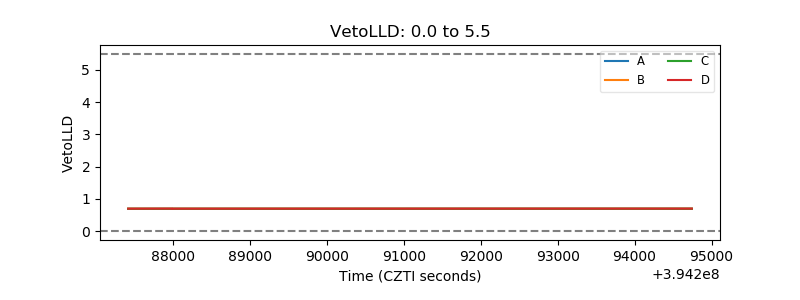 |
| Alpha Counter | 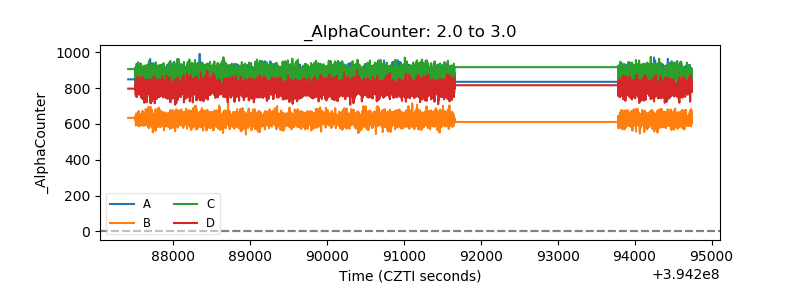 |
| _CPM_Rate | 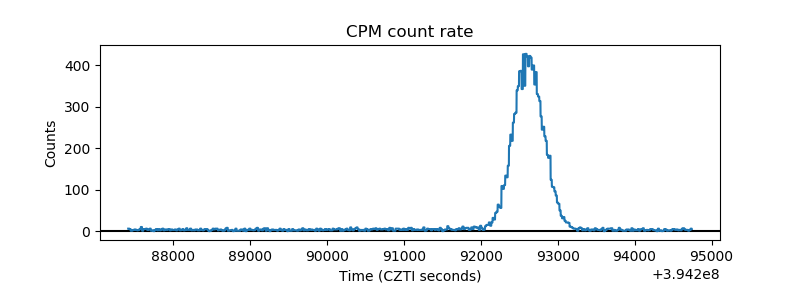 |
| CZT Counter | 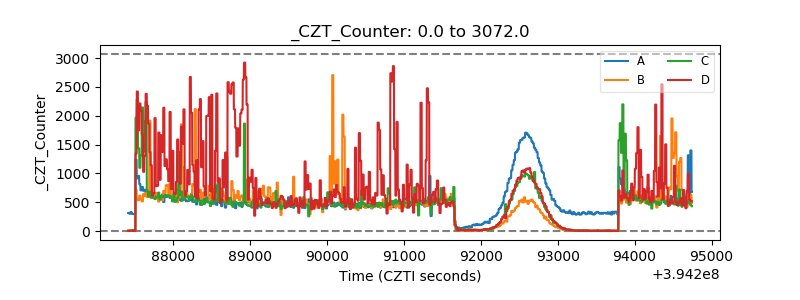 |
| +2.5 Volts monitor | 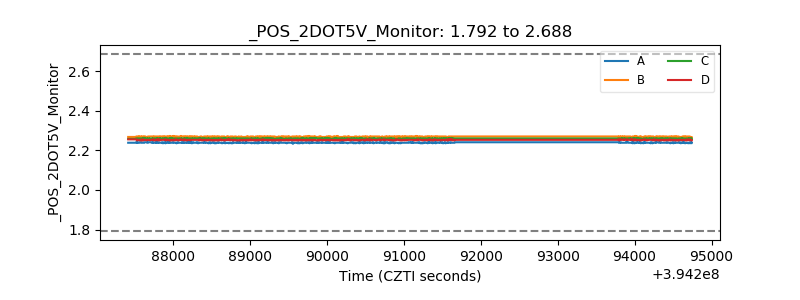 |
| +5 Volts monitor |  |
| _ROLL_ROT | 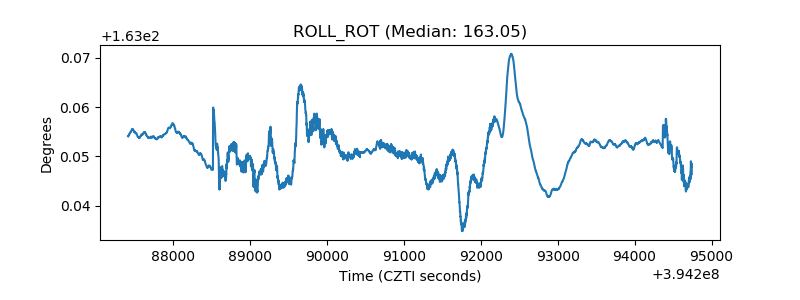 |
| _Roll_DEC | 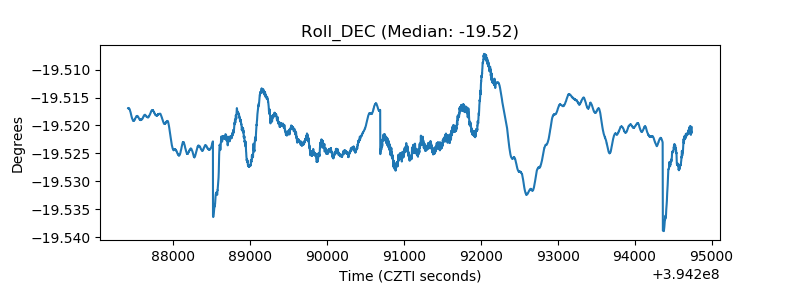 |
| _Roll_RA | 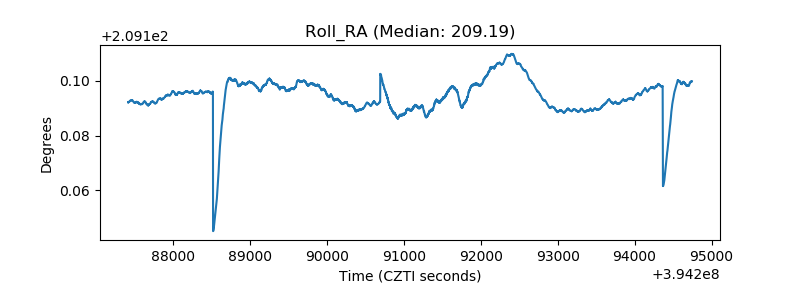 |
| Veto Counter | 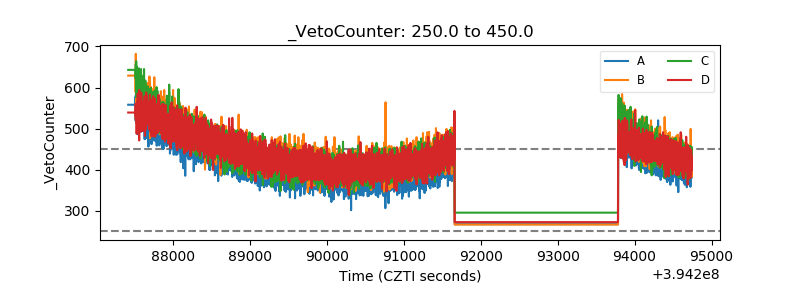 |