| Param | Original file | Final file |
|---|---|---|
| Filename | modeM0/AS1A11_089T02_9000005216_36526cztM0_level2.evt | modeM0/AS1A11_089T02_9000005216_36526cztM0_level2_quad_clean.evt |
| Size (bytes) | 433,103,040 | 71,167,680 |
| Size | 413.0 MB | 67.9 MB |
| Events in quadrant A | 2,826,669 | 450,797 |
| Events in quadrant B | 3,045,364 | 446,111 |
| Events in quadrant C | 3,194,724 | 432,420 |
| Events in quadrant D | 3,655,903 | 420,379 |
| Mode M9 | |||
|---|---|---|---|
| Quadrant | BADHDUFLAG | Total packets | Discarded packets |
| A | 0 | 25 | 0 |
| B | 0 | 25 | 0 |
| C | 0 | 25 | 0 |
| D | 0 | 26 | 0 |
| Mode M0 | |||
|---|---|---|---|
| Quadrant | BADHDUFLAG | Total packets | Discarded packets |
| A | 0 | 12114 | 3 |
| B | 0 | 12804 | 2 |
| C | 0 | 13220 | 2 |
| D | 0 | 14818 | 2 |
| Mode SS | |||
|---|---|---|---|
| Quadrant | BADHDUFLAG | Total packets | Discarded packets |
| A | 0 | 118 | 0 |
| B | 0 | 118 | 0 |
| C | 0 | 118 | 0 |
| D | 0 | 118 | 0 |
| Quadrant | Total seconds | Saturated seconds | Saturation percentage |
|---|---|---|---|
| A | 5798 | 9 | 0.155226% |
| B | 5798 | 43 | 0.741635% |
| C | 5798 | 105 | 1.810969% |
| D | 5798 | 159 | 2.742325% |
Noise dominated data is calculated using 1-second bins in cleaned event files. If a bin has >2000 counts, and if more than 50% of those come from <1% of pixels, then it is considered to be noise-dominated and hence unusable.
| Quadrant | # 1 sec bins | Bins with >0 counts | Bins with >2000 counts | High rate bins dominated by noise | Noise dominated (total time) | Noise dominated (detector-on time) | Marked lightcurve |
|---|---|---|---|---|---|---|---|
| A | 7201 | 5799 | 4 | 4 | 0.06% | 0.07% | 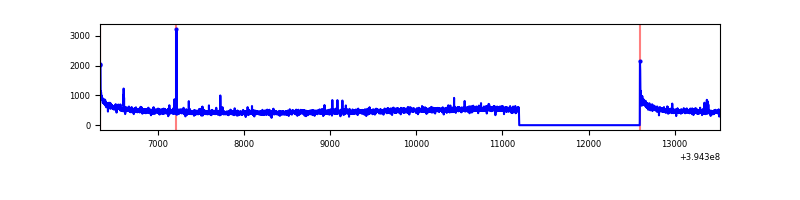 |
| B | 7201 | 5799 | 22 | 22 | 0.31% | 0.38% | 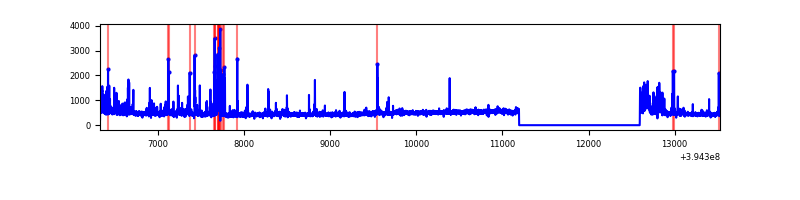 |
| C | 7201 | 5799 | 72 | 72 | 1.00% | 1.24% | 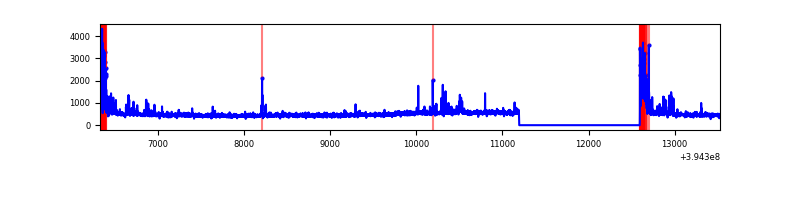 |
| D | 7201 | 5799 | 138 | 138 | 1.92% | 2.38% | 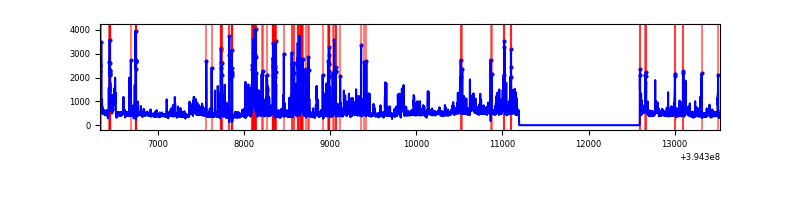 |
Top three noisy pixels from each quadrant. If the there are fewer than three noisy pixels in the level2.evt file, extra rows are filled as -1
| Pixel properties | Quadrant properties | ||||||
|---|---|---|---|---|---|---|---|
| Quadrant | DetID | PixID | Counts | Sigma | Mean | Median | Sigma |
| A | 10 | 83 | 219578 | 1621.69 | 665 | 653 | 135.0 |
| A | 15 | 223 | 15930 | 113.16 | 665 | 653 | 135.0 |
| A | 13 | 6 | 13226 | 93.13 | 665 | 653 | 135.0 |
| B | 5 | 255 | 215308 | 1679.4 | 655 | 637 | 127.8 |
| B | 4 | 232 | 63921 | 495.08 | 655 | 637 | 127.8 |
| B | 5 | 172 | 61320 | 474.73 | 655 | 637 | 127.8 |
| C | 0 | 10 | 387023 | 2595.57 | 633 | 637 | 148.9 |
| C | 15 | 214 | 247679 | 1659.52 | 633 | 637 | 148.9 |
| C | 10 | 49 | 77932 | 519.23 | 633 | 637 | 148.9 |
| D | 13 | 249 | 234254 | 1491.95 | 634 | 616 | 156.6 |
| D | 12 | 17 | 157330 | 1000.73 | 634 | 616 | 156.6 |
| D | 13 | 171 | 151435 | 963.09 | 634 | 616 | 156.6 |
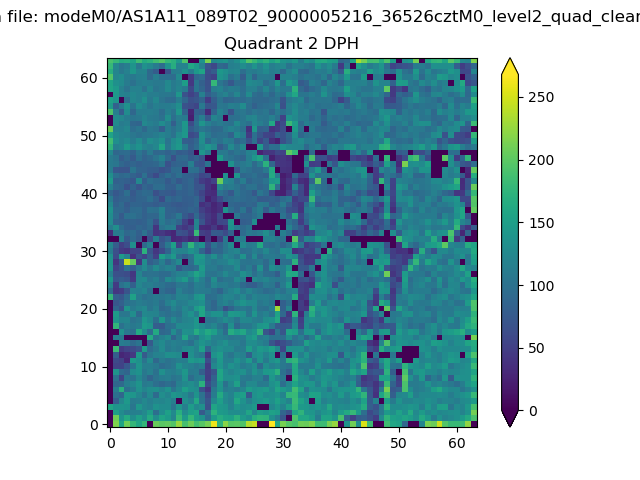
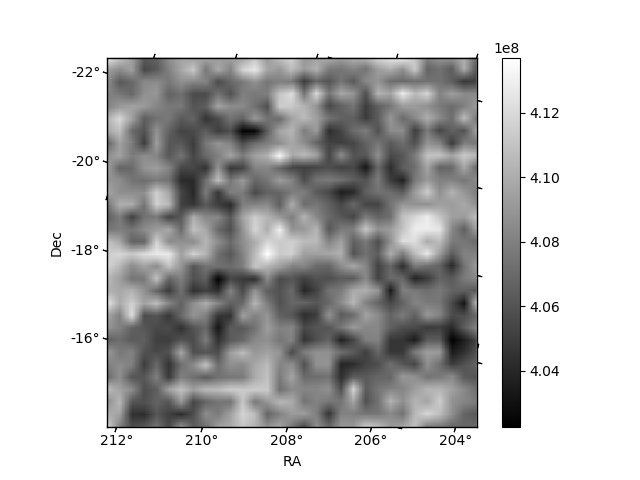
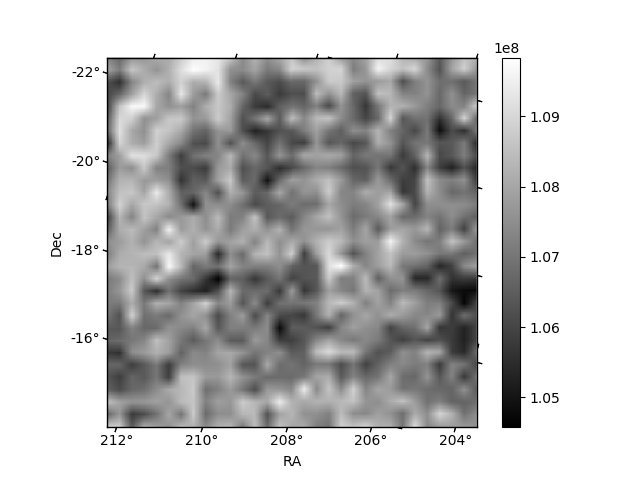
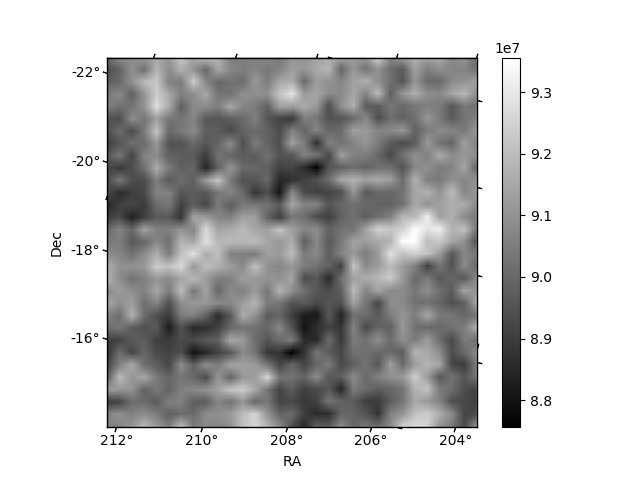
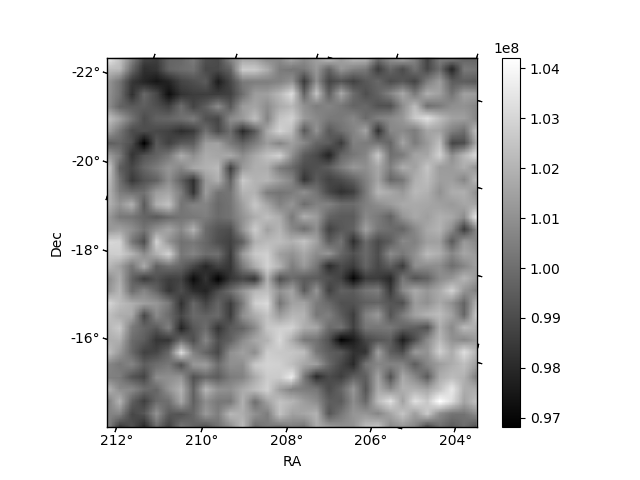
Histogram calculated using DETX and DETY for each event in the final _common_clean file
| Quadrant A | 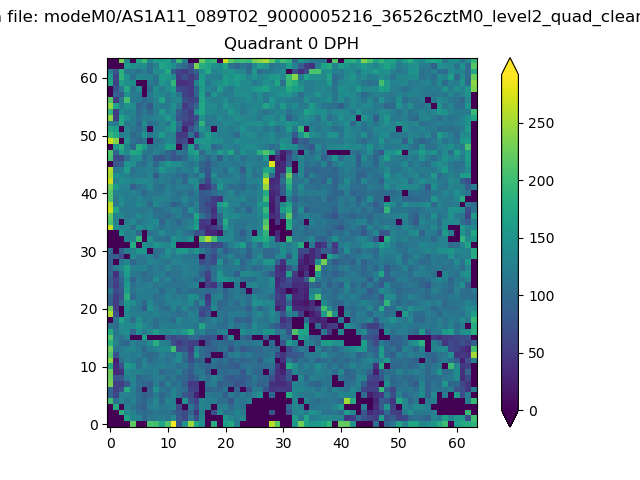 |
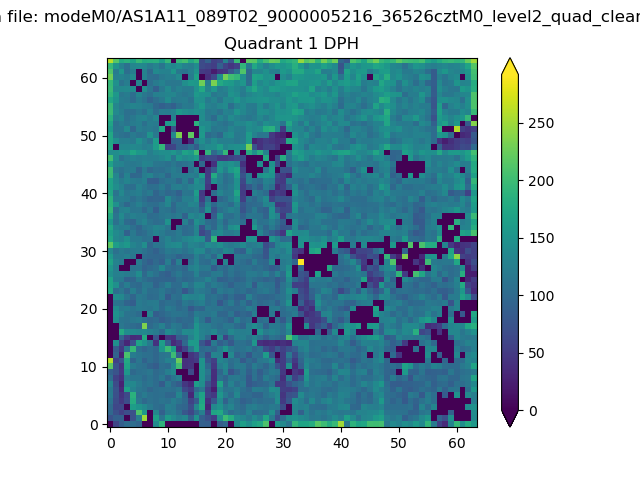 |
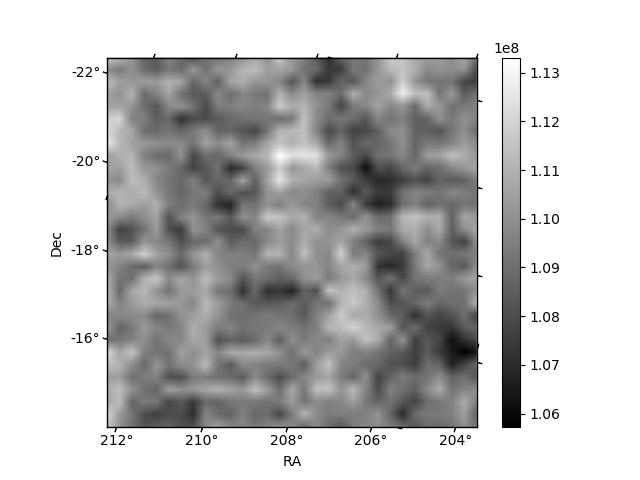
Quadrant B |
|---|---|---|---|
| Quadrant D | 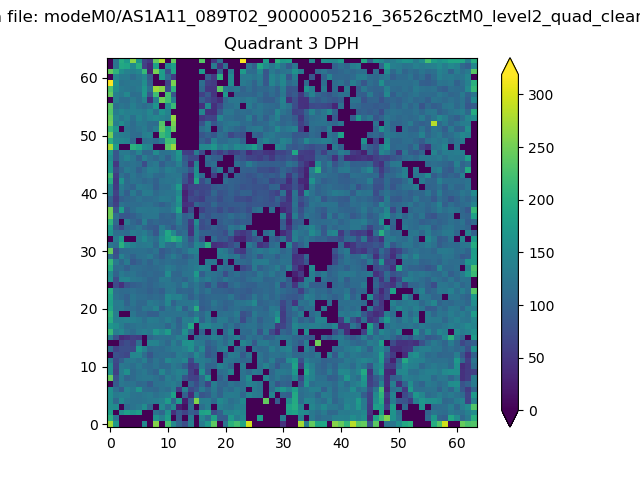 |
 |
Quadrant C |
| Plot type | Count rate plots | Images |
|---|---|---|
| Comparison with Poisson distribution Blue bars denote a histogram of data divided into 1 sec bins. Red curve is a Poisson curve with rate = median count rate of data. |
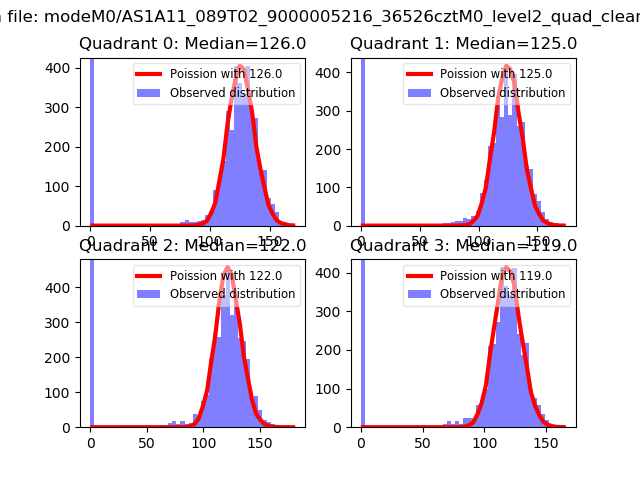 |
 |
| Quadrant-wise count rates Data is divided into 100 sec bins |
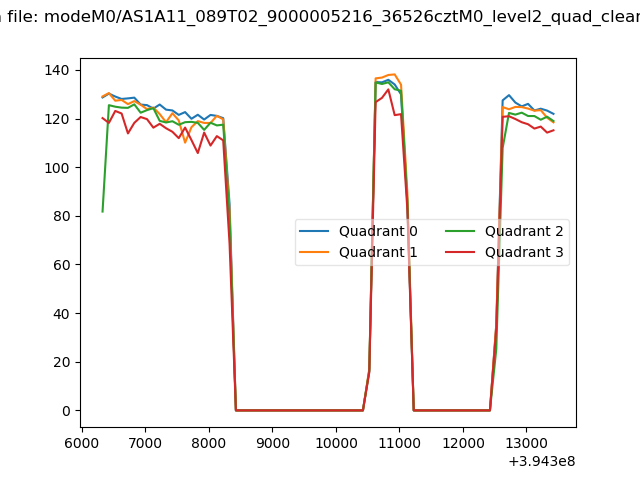 |
|
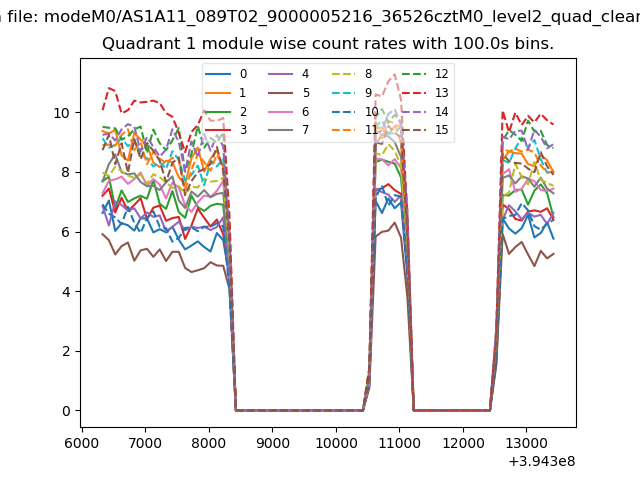
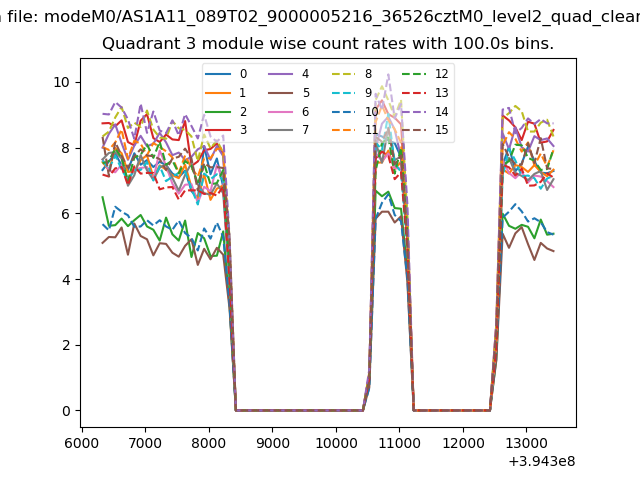
| Module-wise count rates for Quadrant A Data is divided into 100 sec bins |
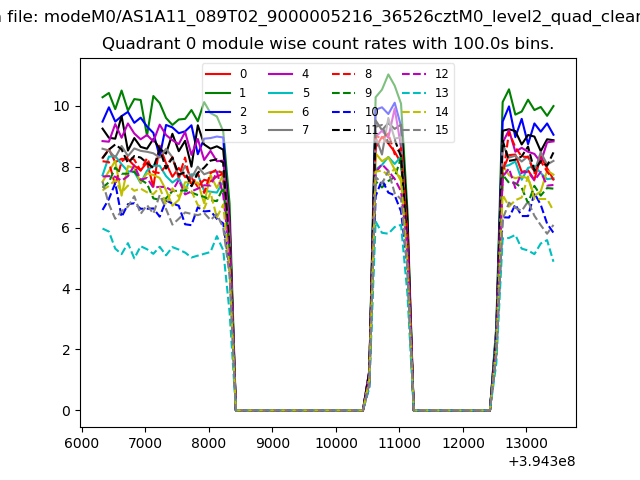 |
 |
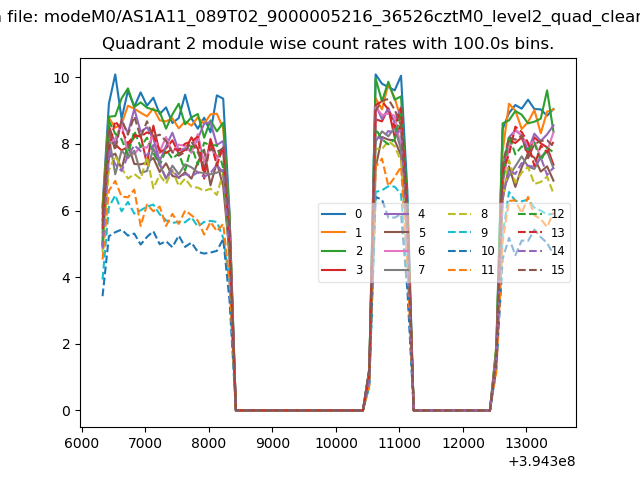
| Module-wise count rates for Quadrant B Data is divided into 100 sec bins |
 |
 |
| Module-wise count rates for Quadrant C Data is divided into 100 sec bins |
 |
 |
| Module-wise count rates for Quadrant D Data is divided into 100 sec bins |
 |
 |
| Parameter | Plot |
|---|---|
| CZT HV Monitor | 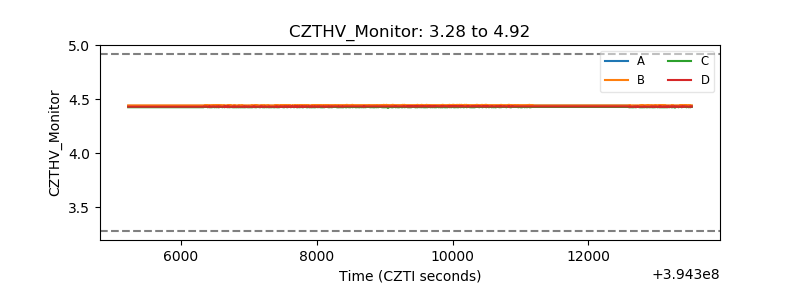 |
| D_VDD | 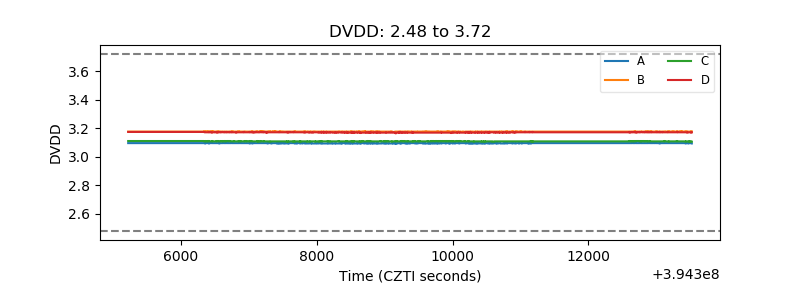 |
| Temperature 1 | 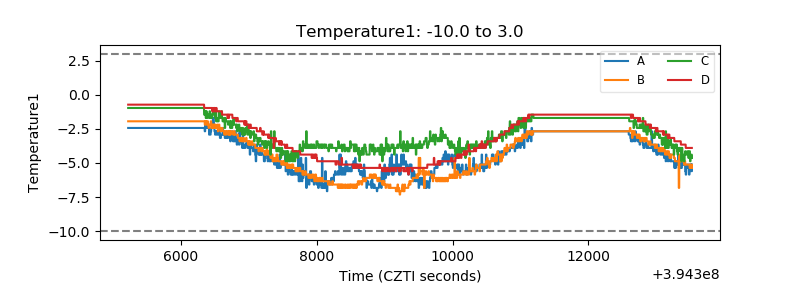 |
| Veto HV Monitor | 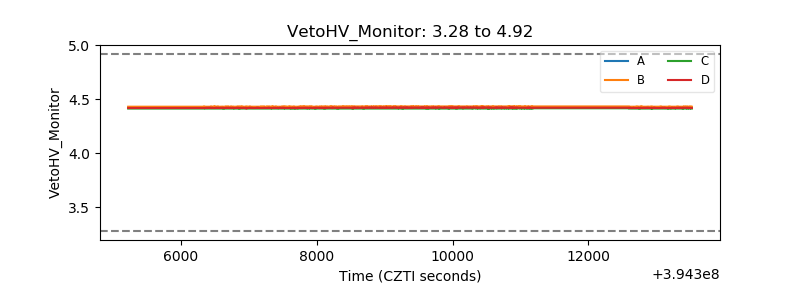 |
| Veto LLD | 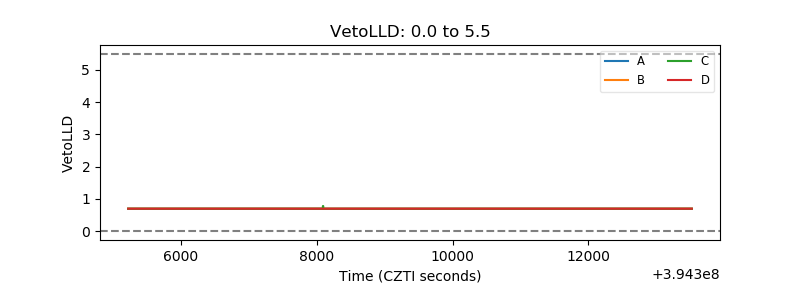 |
| Alpha Counter | 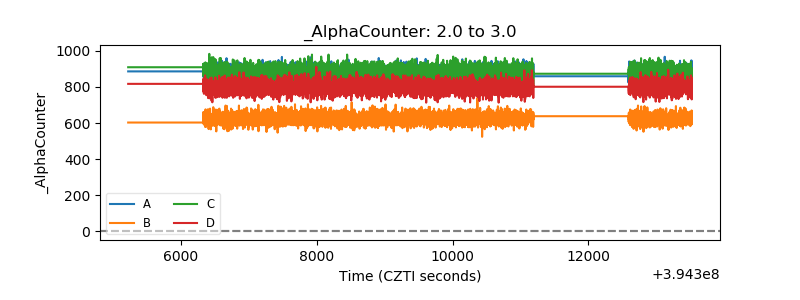 |
| _CPM_Rate | 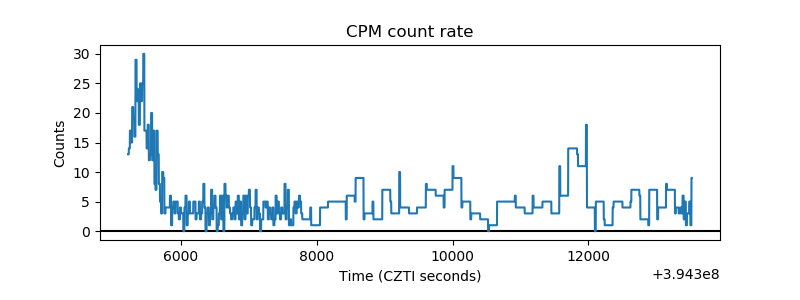 |
| CZT Counter | 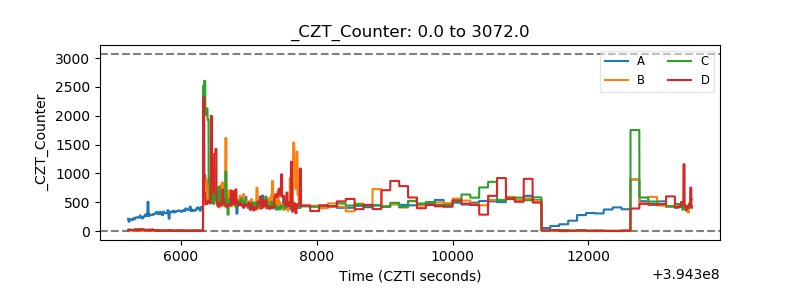 |
| +2.5 Volts monitor | 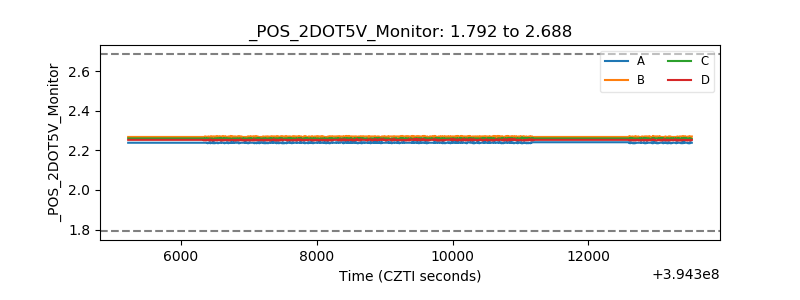 |
| +5 Volts monitor | 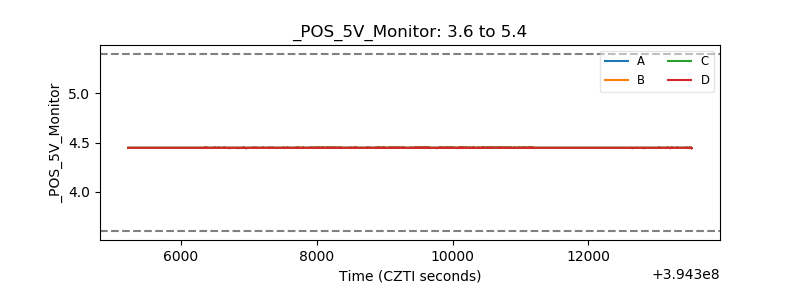 |
| _ROLL_ROT | 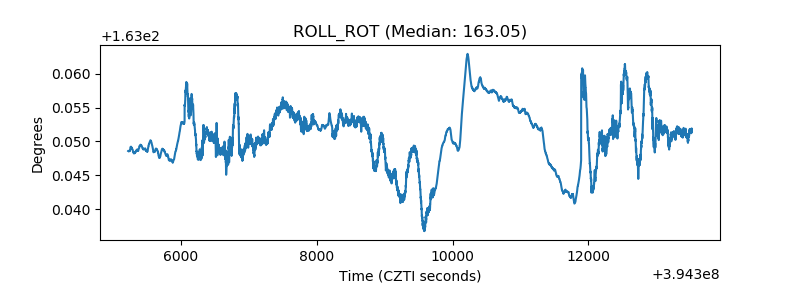 |
| _Roll_DEC | 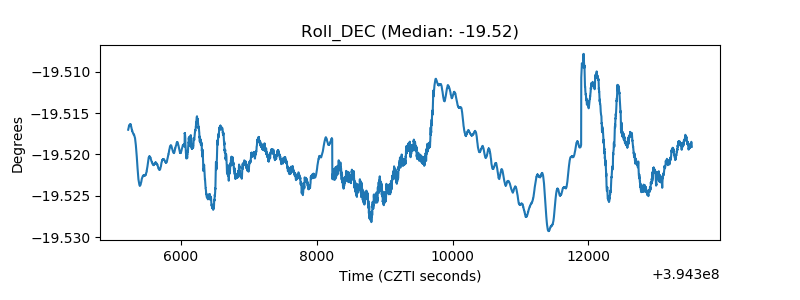 |
| _Roll_RA | 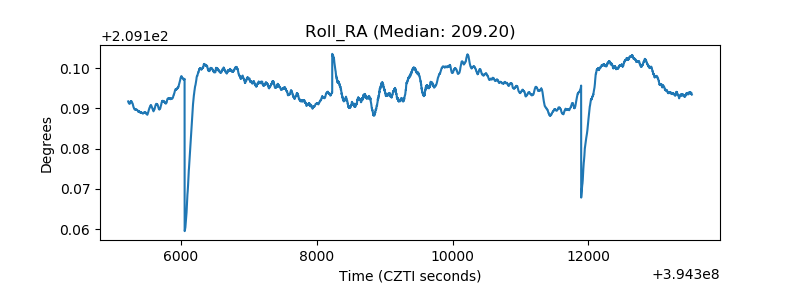 |
| Veto Counter | 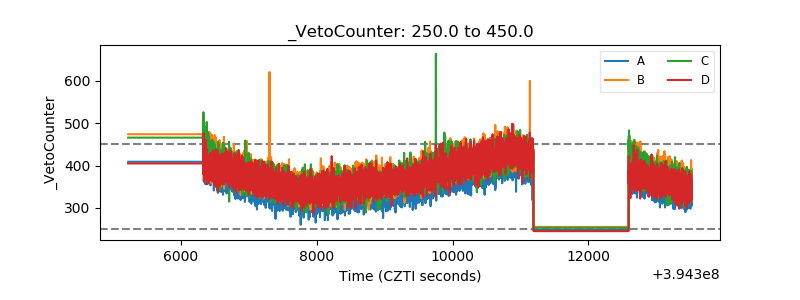 |