| Param | Original file | Final file |
|---|---|---|
| Filename | modeM0/AS1A11_089T02_9000005216_36527cztM0_level2.evt | modeM0/AS1A11_089T02_9000005216_36527cztM0_level2_quad_clean.evt |
| Size (bytes) | 427,988,160 | 72,982,080 |
| Size | 408.2 MB | 69.6 MB |
| Events in quadrant A | 2,869,685 | 462,072 |
| Events in quadrant B | 2,972,802 | 459,684 |
| Events in quadrant C | 3,199,859 | 444,635 |
| Events in quadrant D | 3,518,772 | 431,749 |
| Mode M9 | |||
|---|---|---|---|
| Quadrant | BADHDUFLAG | Total packets | Discarded packets |
| A | 0 | 24 | 0 |
| B | 0 | 24 | 0 |
| C | 0 | 24 | 0 |
| D | 0 | 25 | 0 |
| Mode M0 | |||
|---|---|---|---|
| Quadrant | BADHDUFLAG | Total packets | Discarded packets |
| A | 0 | 12307 | 3 |
| B | 0 | 12698 | 2 |
| C | 0 | 13184 | 2 |
| D | 0 | 14457 | 2 |
| Mode SS | |||
|---|---|---|---|
| Quadrant | BADHDUFLAG | Total packets | Discarded packets |
| A | 0 | 120 | 0 |
| B | 0 | 120 | 0 |
| C | 0 | 120 | 0 |
| D | 0 | 120 | 0 |
| Quadrant | Total seconds | Saturated seconds | Saturation percentage |
|---|---|---|---|
| A | 5892 | 11 | 0.186694% |
| B | 5892 | 23 | 0.390360% |
| C | 5892 | 112 | 1.900883% |
| D | 5892 | 138 | 2.342159% |
Noise dominated data is calculated using 1-second bins in cleaned event files. If a bin has >2000 counts, and if more than 50% of those come from <1% of pixels, then it is considered to be noise-dominated and hence unusable.
| Quadrant | # 1 sec bins | Bins with >0 counts | Bins with >2000 counts | High rate bins dominated by noise | Noise dominated (total time) | Noise dominated (detector-on time) | Marked lightcurve |
|---|---|---|---|---|---|---|---|
| A | 7205 | 5893 | 4 | 4 | 0.06% | 0.07% | 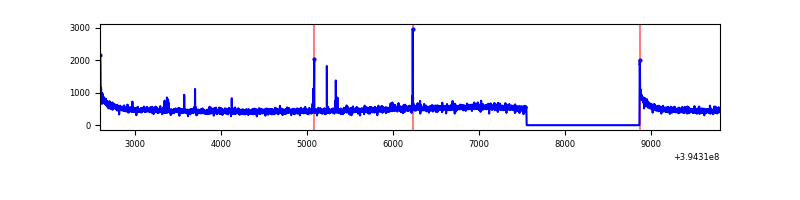 |
| B | 7205 | 5893 | 10 | 10 | 0.14% | 0.17% | 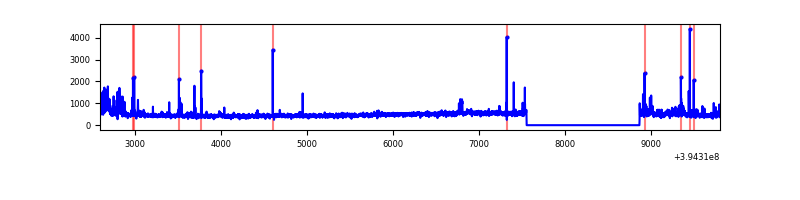 |
| C | 7205 | 5893 | 77 | 77 | 1.07% | 1.31% | 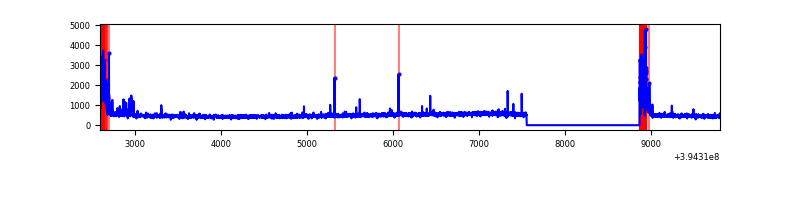 |
| D | 7205 | 5893 | 120 | 120 | 1.67% | 2.04% | 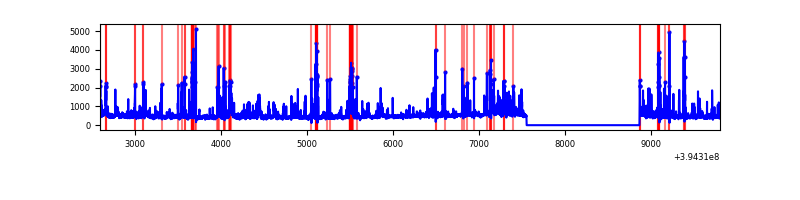 |
Top three noisy pixels from each quadrant. If the there are fewer than three noisy pixels in the level2.evt file, extra rows are filled as -1
| Pixel properties | Quadrant properties | ||||||
|---|---|---|---|---|---|---|---|
| Quadrant | DetID | PixID | Counts | Sigma | Mean | Median | Sigma |
| A | 10 | 83 | 217572 | 1585.53 | 674 | 660 | 136.8 |
| A | 7 | 3 | 13606 | 94.63 | 674 | 660 | 136.8 |
| A | 15 | 223 | 11714 | 80.8 | 674 | 660 | 136.8 |
| B | 5 | 255 | 86137 | 656.47 | 668 | 652 | 130.2 |
| B | 4 | 232 | 63496 | 482.6 | 668 | 652 | 130.2 |
| B | 5 | 172 | 47690 | 361.22 | 668 | 652 | 130.2 |
| C | 0 | 10 | 394625 | 2608.06 | 644 | 649 | 151.1 |
| C | 15 | 214 | 250657 | 1655.02 | 644 | 649 | 151.1 |
| C | 12 | 249 | 14677 | 92.86 | 644 | 649 | 151.1 |
| D | 2 | 250 | 142789 | 892.67 | 646 | 628 | 159.3 |
| D | 13 | 249 | 141294 | 883.28 | 646 | 628 | 159.3 |
| D | 2 | 153 | 99251 | 619.28 | 646 | 628 | 159.3 |
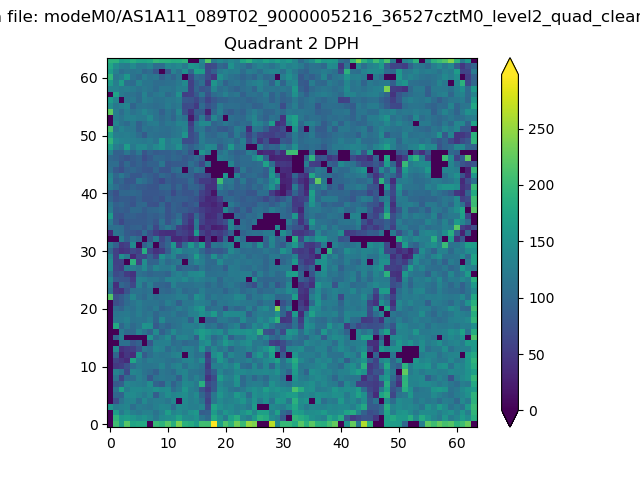
Histogram calculated using DETX and DETY for each event in the final _common_clean file
| Quadrant A |  |
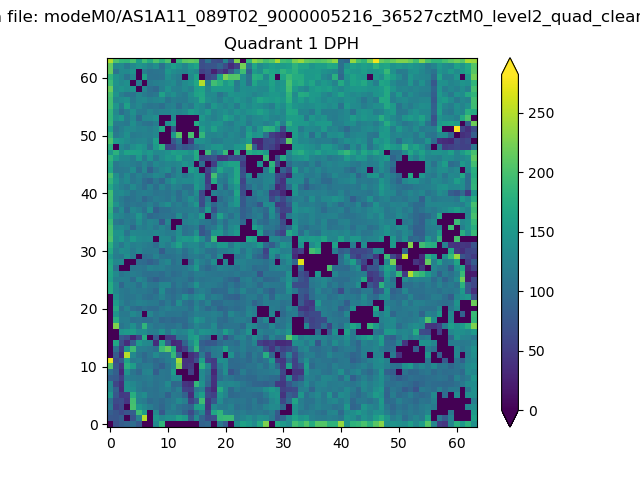 |
Quadrant B |
|---|---|---|---|
| Quadrant D | 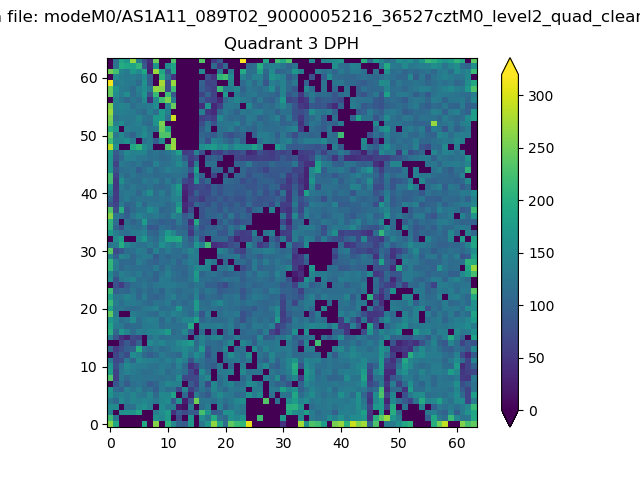 |
 |
Quadrant C |
| Plot type | Count rate plots | Images |
|---|---|---|
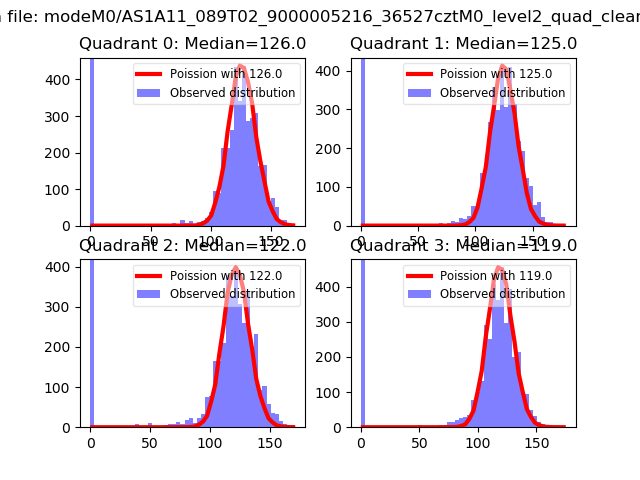
| Comparison with Poisson distribution Blue bars denote a histogram of data divided into 1 sec bins. Red curve is a Poisson curve with rate = median count rate of data. |
 |
 |
| Quadrant-wise count rates Data is divided into 100 sec bins |
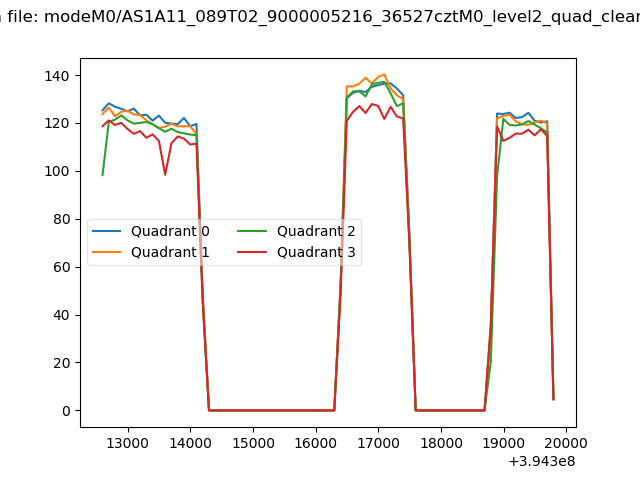 |
|
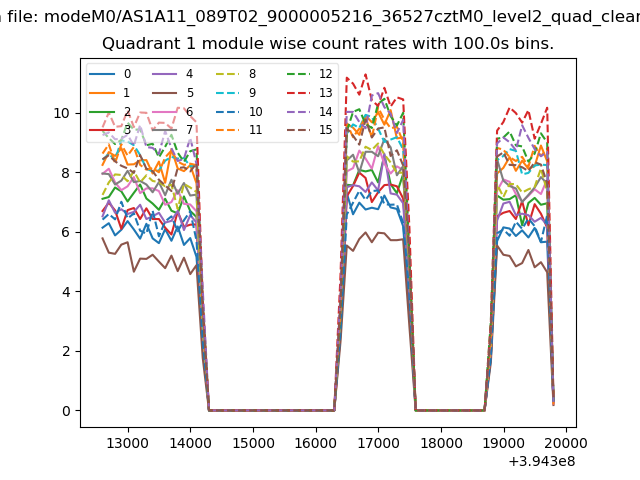
| Module-wise count rates for Quadrant A Data is divided into 100 sec bins |
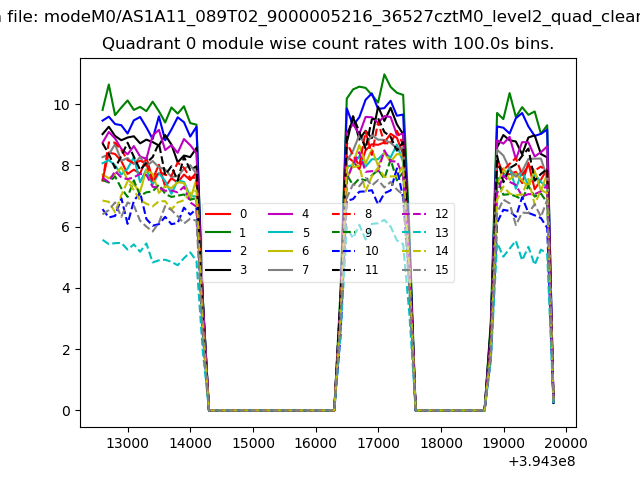 |
 |
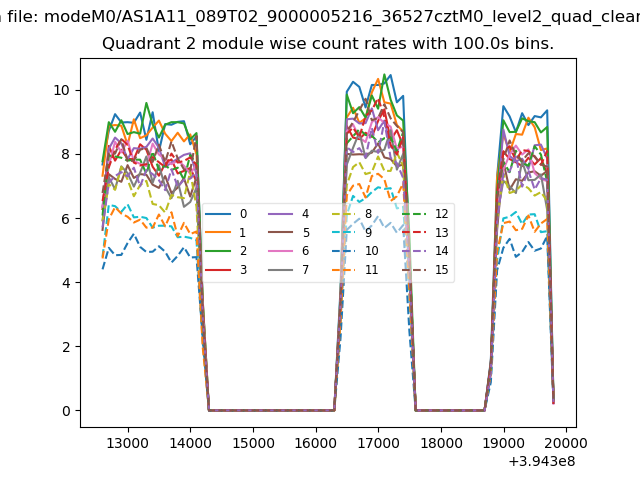
| Module-wise count rates for Quadrant B Data is divided into 100 sec bins |
 |
 |
| Module-wise count rates for Quadrant C Data is divided into 100 sec bins |
 |
 |
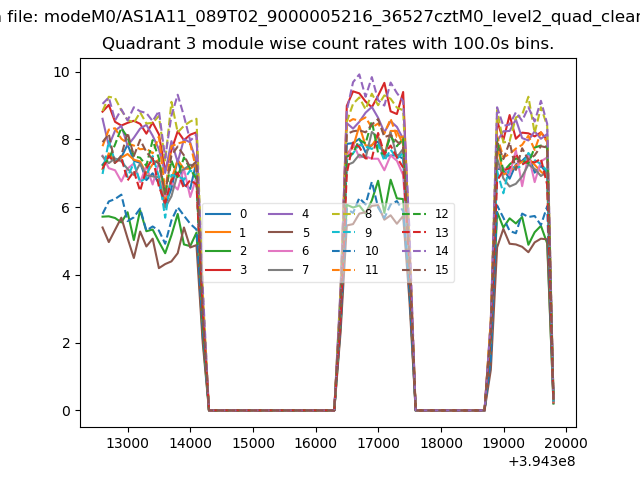
| Module-wise count rates for Quadrant D Data is divided into 100 sec bins |
 |
 |
| Parameter | Plot |
|---|---|
| CZT HV Monitor | 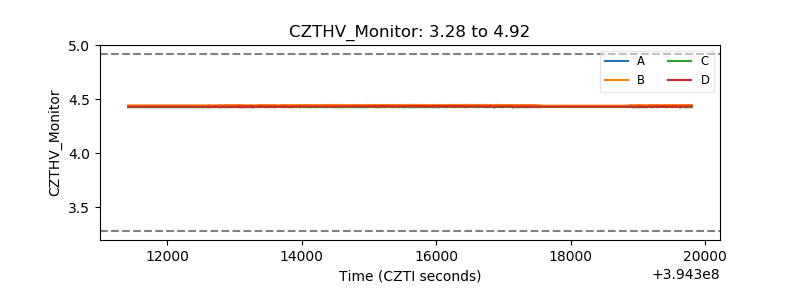 |
| D_VDD | 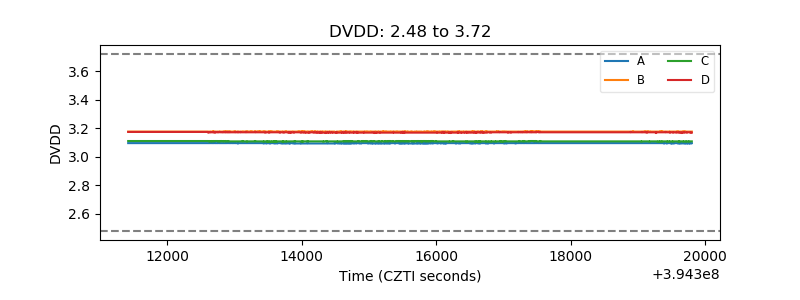 |
| Temperature 1 | 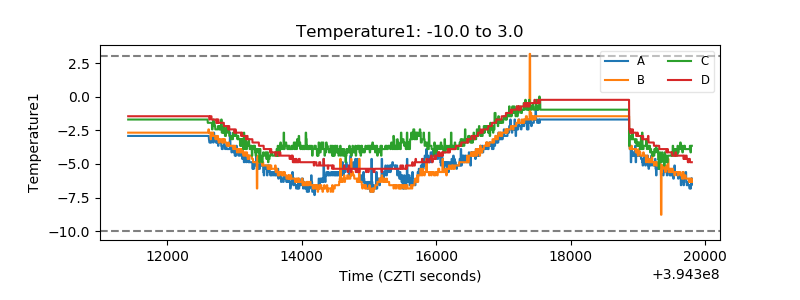 |
| Veto HV Monitor | 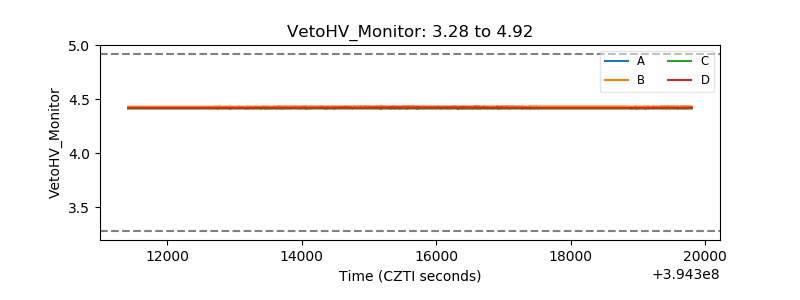 |
| Veto LLD | 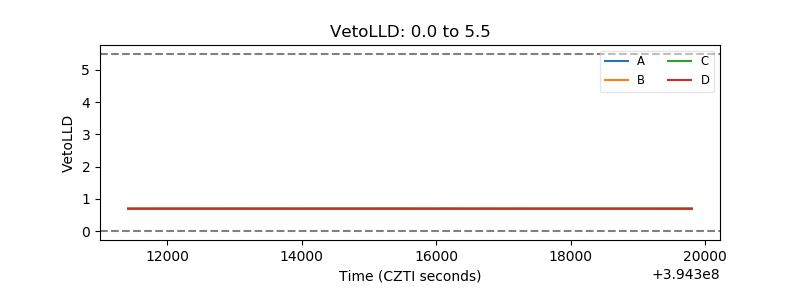 |
| Alpha Counter | 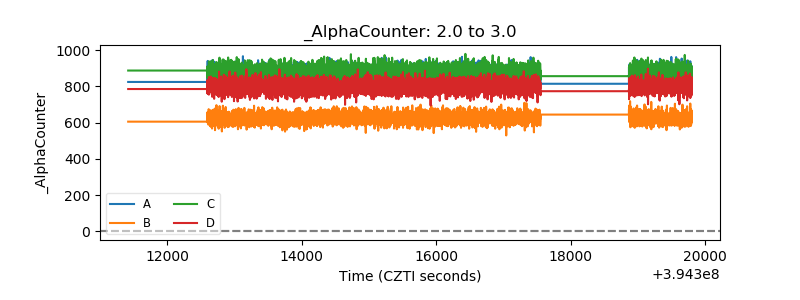 |
| _CPM_Rate | 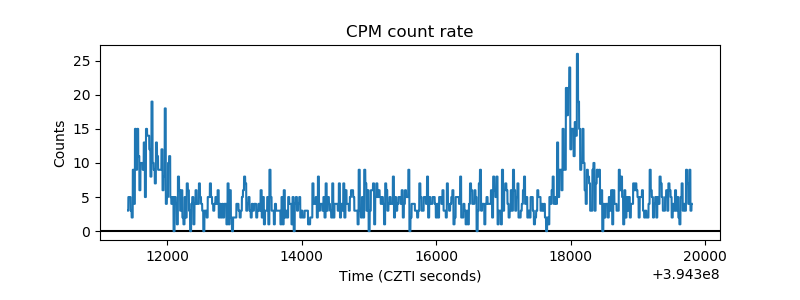 |
| CZT Counter | 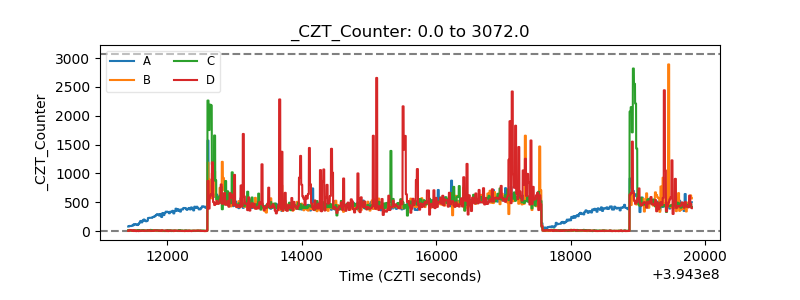 |
| +2.5 Volts monitor |  |
| +5 Volts monitor |  |
| _ROLL_ROT | 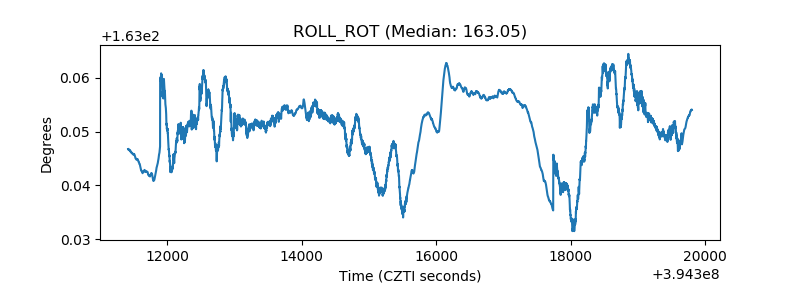 |
| _Roll_DEC | 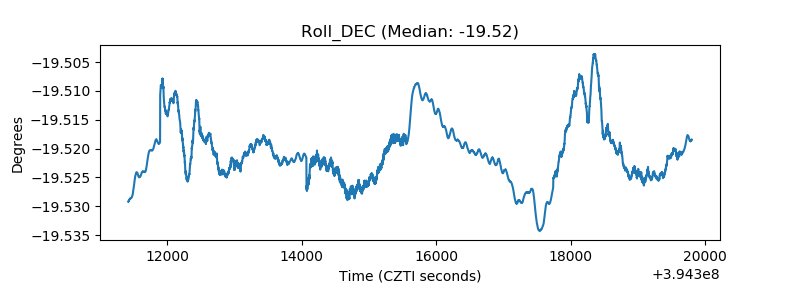 |
| _Roll_RA | 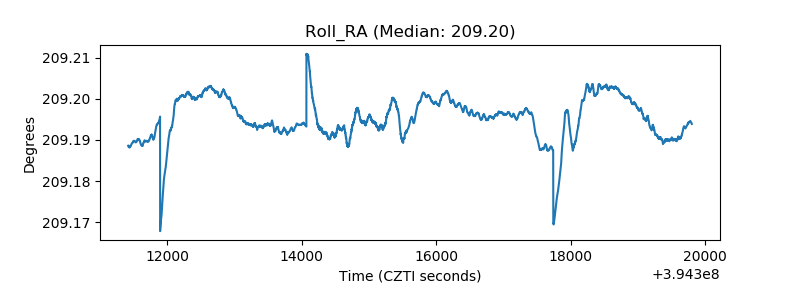 |
| Veto Counter | 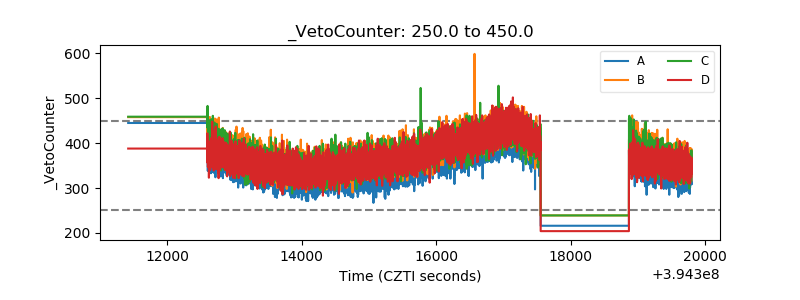 |