| Param | Original file | Final file |
|---|---|---|
| Filename | modeM0/AS1A11_089T02_9000005216_36530cztM0_level2.evt | modeM0/AS1A11_089T02_9000005216_36530cztM0_level2_quad_clean.evt |
| Size (bytes) | 1,164,202,560 | 164,174,400 |
| Size | 1.1 GB | 156.6 MB |
| Events in quadrant A | 7,481,889 | 1,007,569 |
| Events in quadrant B | 8,180,893 | 1,000,080 |
| Events in quadrant C | 8,653,039 | 974,593 |
| Events in quadrant D | 9,900,308 | 925,116 |
| Mode M9 | |||
|---|---|---|---|
| Quadrant | BADHDUFLAG | Total packets | Discarded packets |
| A | 0 | 54 | 0 |
| B | 0 | 54 | 0 |
| C | 0 | 54 | 0 |
| D | 0 | 55 | 0 |
| Mode M0 | |||
|---|---|---|---|
| Quadrant | BADHDUFLAG | Total packets | Discarded packets |
| A | 0 | 31955 | 5 |
| B | 0 | 34389 | 4 |
| C | 0 | 35178 | 4 |
| D | 0 | 40155 | 4 |
| Mode SS | |||
|---|---|---|---|
| Quadrant | BADHDUFLAG | Total packets | Discarded packets |
| A | 0 | 314 | 0 |
| B | 0 | 314 | 0 |
| C | 0 | 314 | 0 |
| D | 0 | 314 | 0 |
| Quadrant | Total seconds | Saturated seconds | Saturation percentage |
|---|---|---|---|
| A | 15426 | 21 | 0.136134% |
| B | 15426 | 144 | 0.933489% |
| C | 15426 | 251 | 1.627123% |
| D | 15426 | 505 | 3.273694% |
Noise dominated data is calculated using 1-second bins in cleaned event files. If a bin has >2000 counts, and if more than 50% of those come from <1% of pixels, then it is considered to be noise-dominated and hence unusable.
| Quadrant | # 1 sec bins | Bins with >0 counts | Bins with >2000 counts | High rate bins dominated by noise | Noise dominated (total time) | Noise dominated (detector-on time) | Marked lightcurve |
|---|---|---|---|---|---|---|---|
| A | 19696 | 15429 | 2 | 2 | 0.01% | 0.01% | 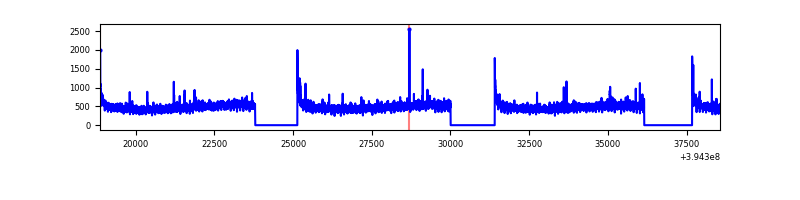 |
| B | 19696 | 15429 | 70 | 70 | 0.36% | 0.45% | 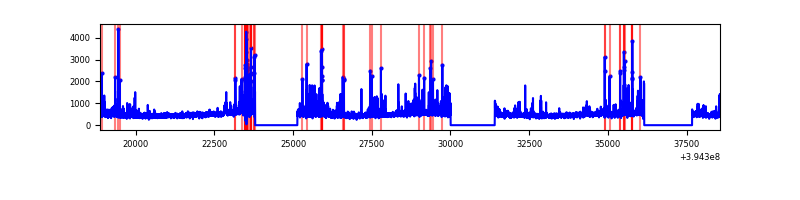 |
| C | 19696 | 15429 | 186 | 186 | 0.94% | 1.21% | 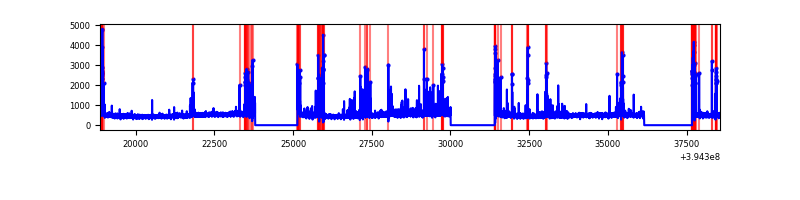 |
| D | 19696 | 15429 | 390 | 390 | 1.98% | 2.53% | 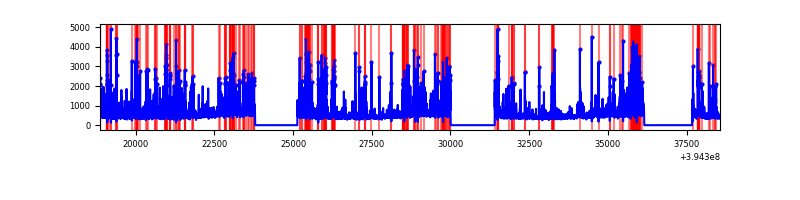 |
Top three noisy pixels from each quadrant. If the there are fewer than three noisy pixels in the level2.evt file, extra rows are filled as -1
| Pixel properties | Quadrant properties | ||||||
|---|---|---|---|---|---|---|---|
| Quadrant | DetID | PixID | Counts | Sigma | Mean | Median | Sigma |
| A | 10 | 83 | 492494 | 1377.67 | 1777 | 1739 | 356.2 |
| A | 7 | 3 | 52464 | 142.4 | 1777 | 1739 | 356.2 |
| A | 9 | 143 | 31620 | 83.88 | 1777 | 1739 | 356.2 |
| B | 5 | 255 | 350035 | 1044.73 | 1755 | 1705 | 333.4 |
| B | 5 | 172 | 320657 | 956.61 | 1755 | 1705 | 333.4 |
| B | 0 | 189 | 238118 | 709.06 | 1755 | 1705 | 333.4 |
| C | 15 | 214 | 651714 | 1643.49 | 1702 | 1710 | 395.5 |
| C | 0 | 10 | 640010 | 1613.89 | 1702 | 1710 | 395.5 |
| C | 14 | 254 | 588735 | 1484.25 | 1702 | 1710 | 395.5 |
| D | 13 | 249 | 773445 | 1863.87 | 1697 | 1653 | 414.1 |
| D | 2 | 153 | 445267 | 1071.32 | 1697 | 1653 | 414.1 |
| D | 2 | 250 | 410631 | 987.68 | 1697 | 1653 | 414.1 |
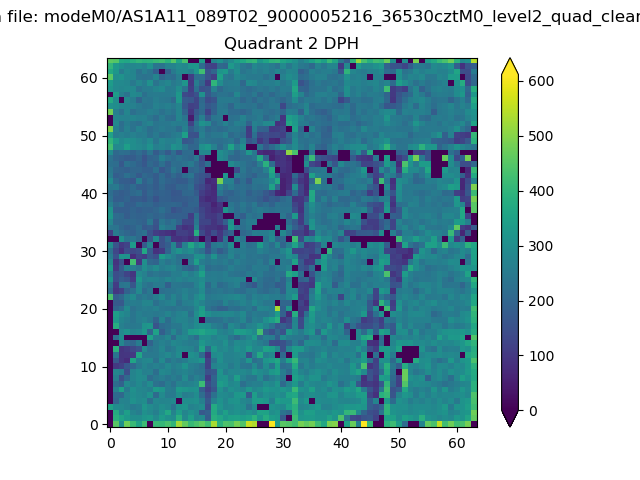
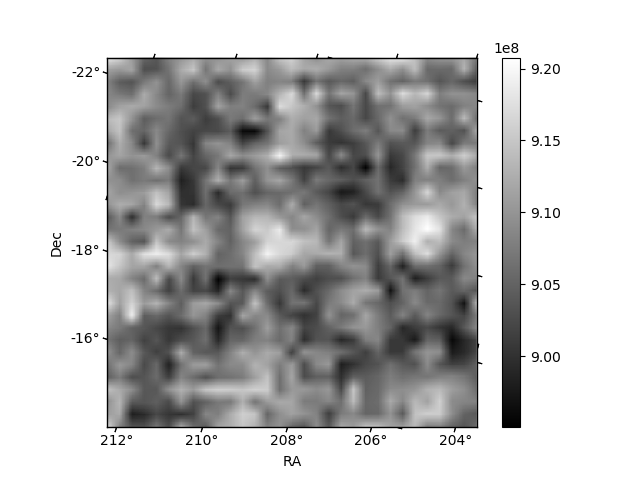
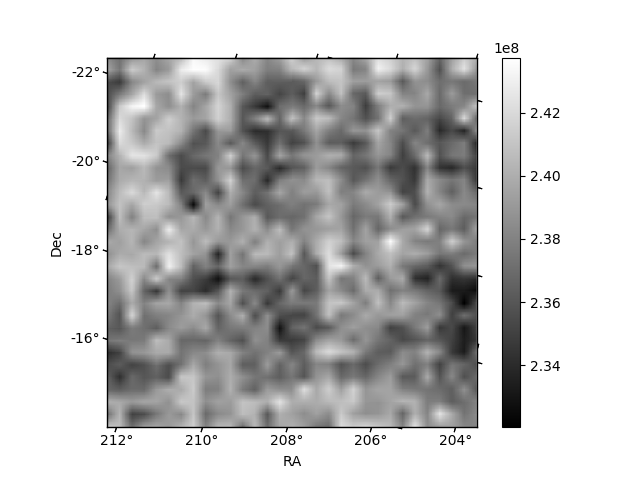
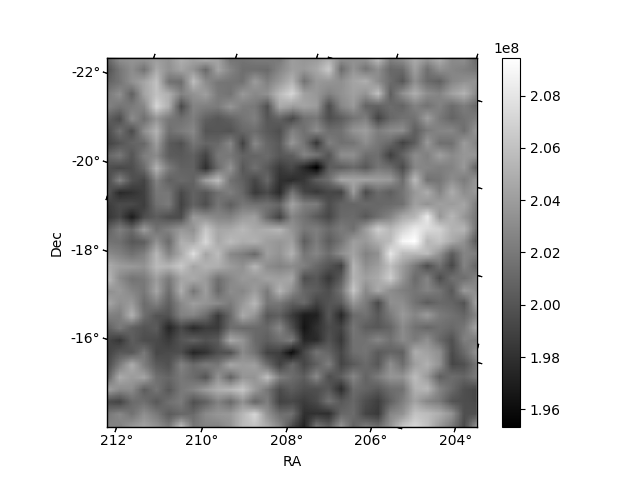
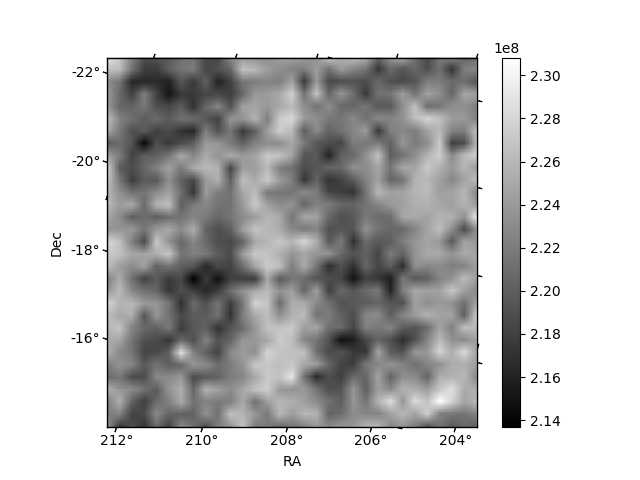
Histogram calculated using DETX and DETY for each event in the final _common_clean file
| Quadrant A | 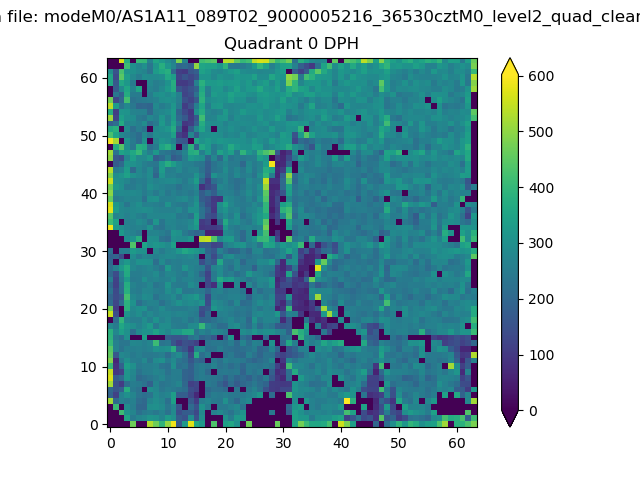 |
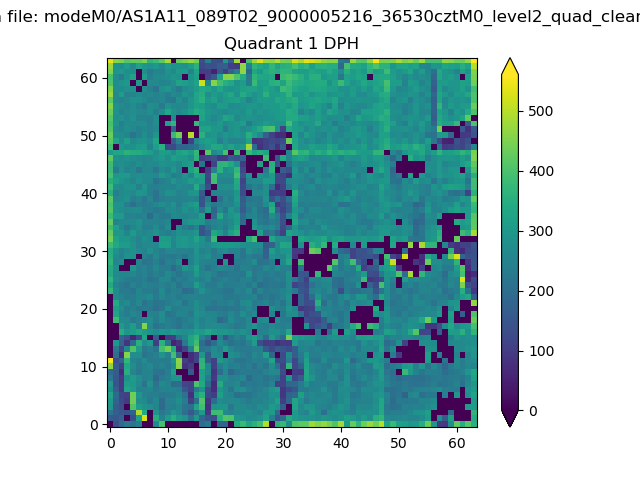 |
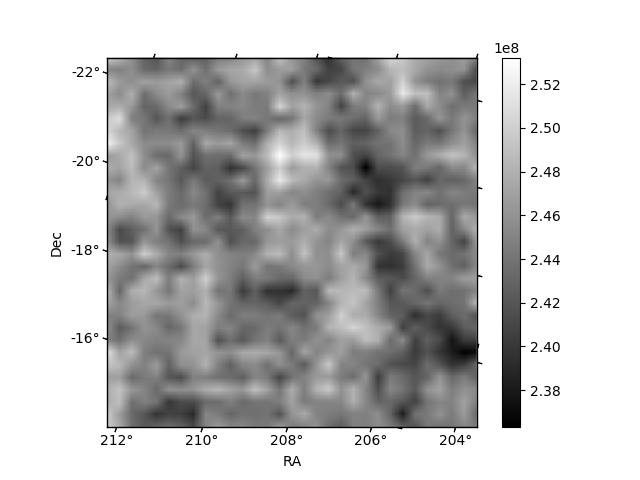
Quadrant B |
|---|---|---|---|
| Quadrant D | 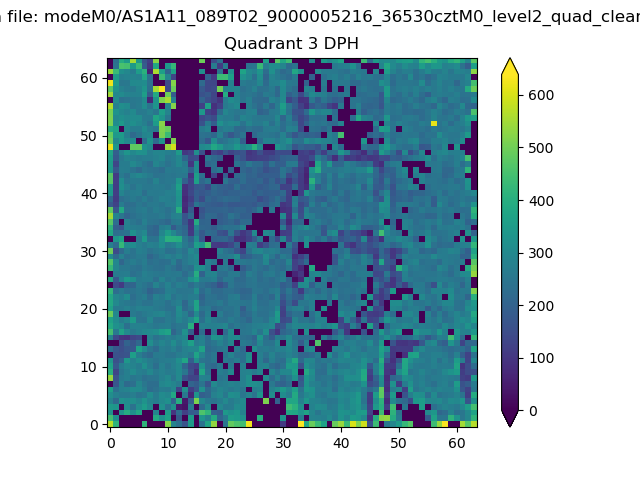 |
 |
Quadrant C |
| Plot type | Count rate plots | Images |
|---|---|---|
| Comparison with Poisson distribution Blue bars denote a histogram of data divided into 1 sec bins. Red curve is a Poisson curve with rate = median count rate of data. |
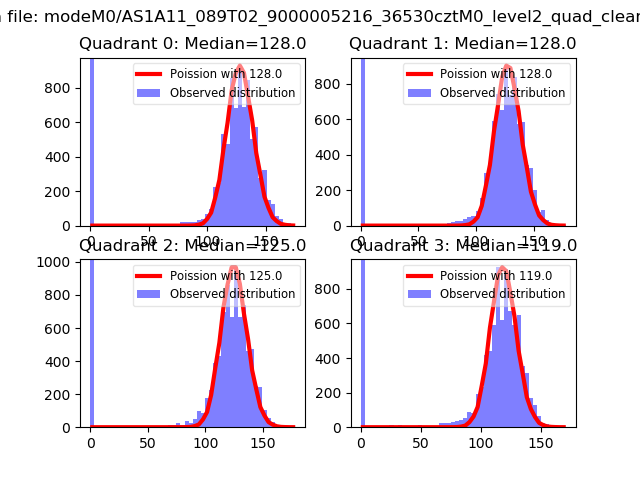 |
 |
| Quadrant-wise count rates Data is divided into 100 sec bins |
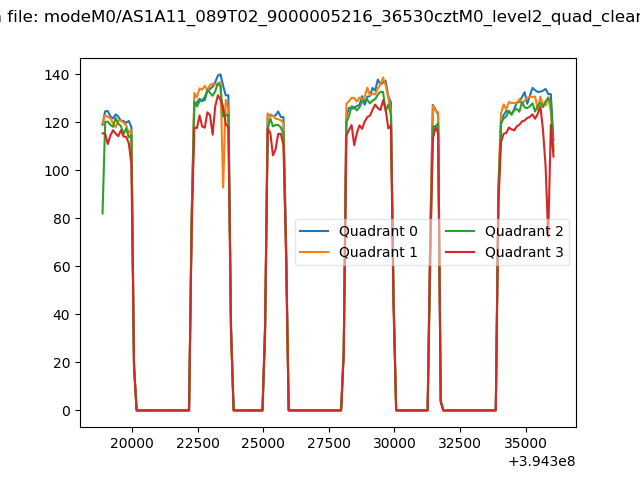 |
|
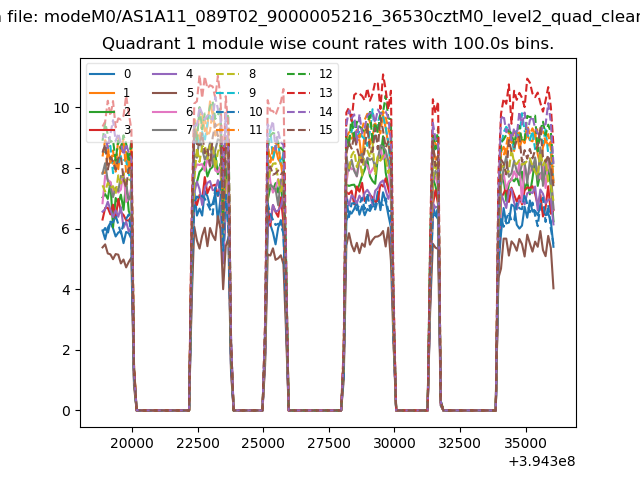
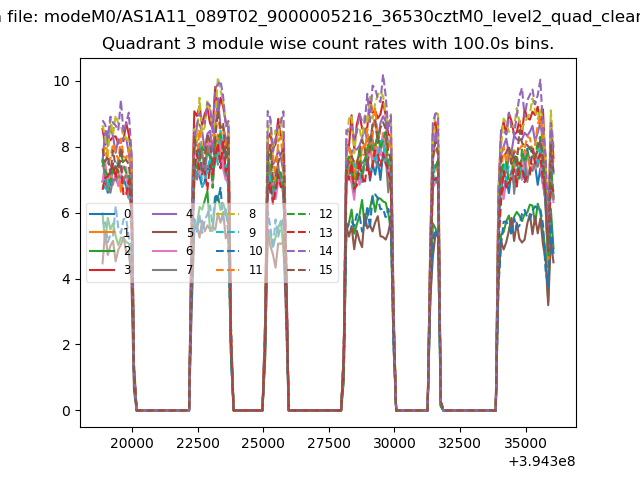
| Module-wise count rates for Quadrant A Data is divided into 100 sec bins |
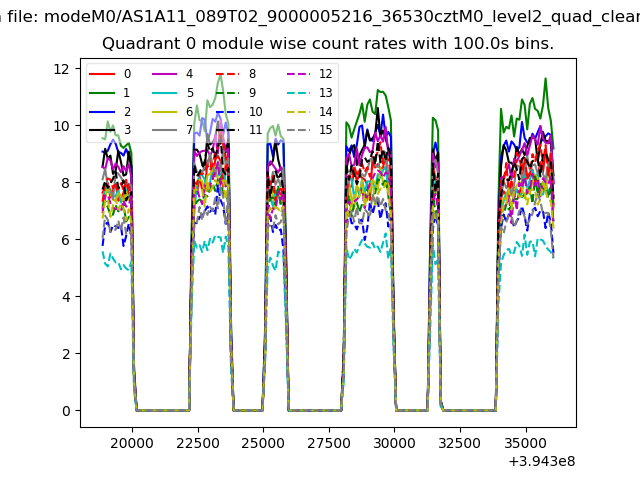 |
 |
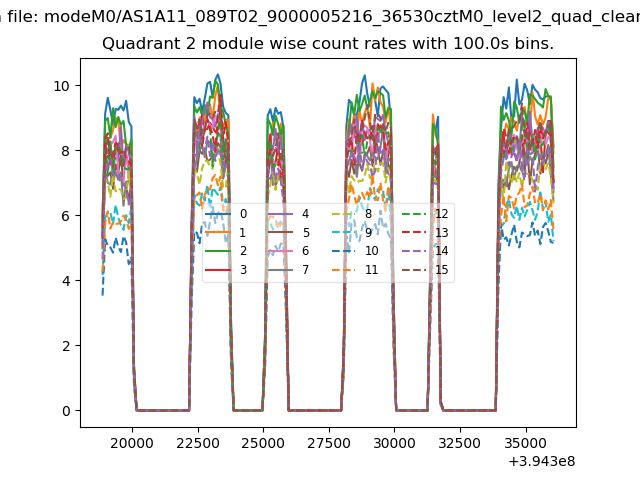
| Module-wise count rates for Quadrant B Data is divided into 100 sec bins |
 |
 |
| Module-wise count rates for Quadrant C Data is divided into 100 sec bins |
 |
 |
| Module-wise count rates for Quadrant D Data is divided into 100 sec bins |
 |
 |
| Parameter | Plot |
|---|---|
| CZT HV Monitor | 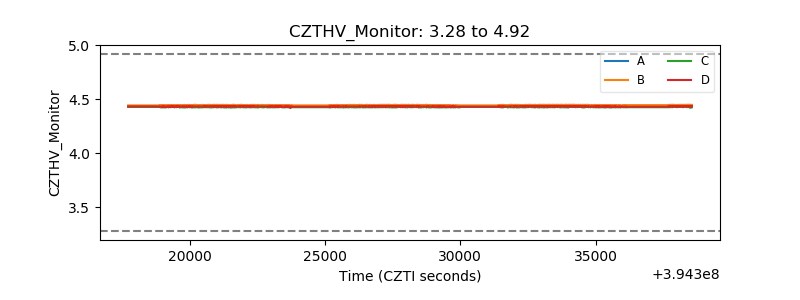 |
| D_VDD | 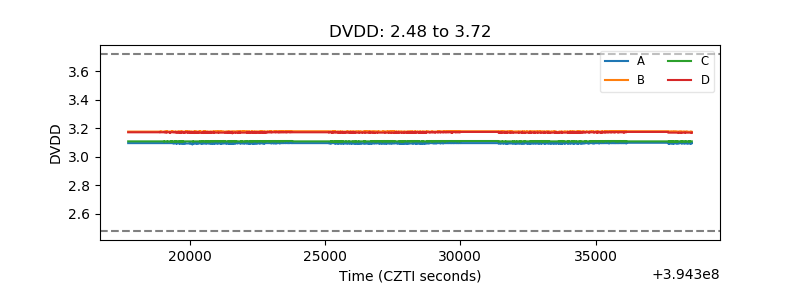 |
| Temperature 1 | 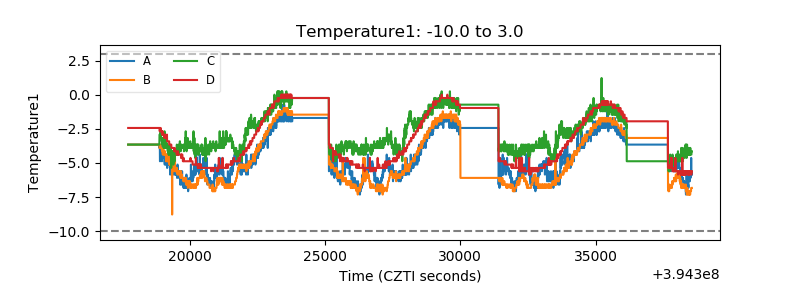 |
| Veto HV Monitor | 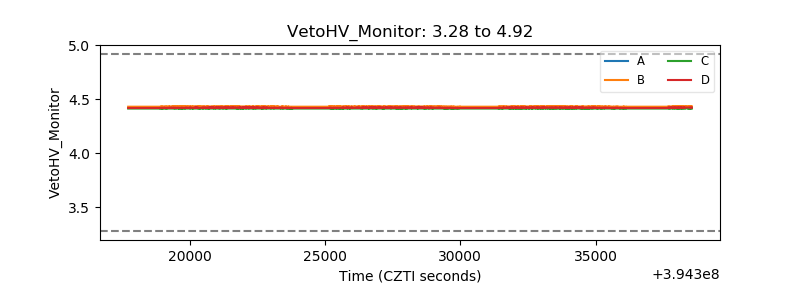 |
| Veto LLD | 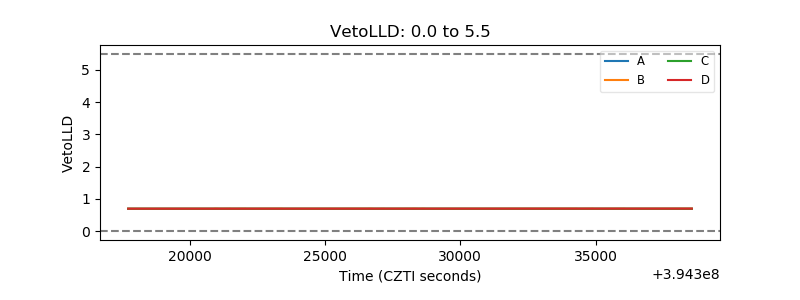 |
| Alpha Counter | 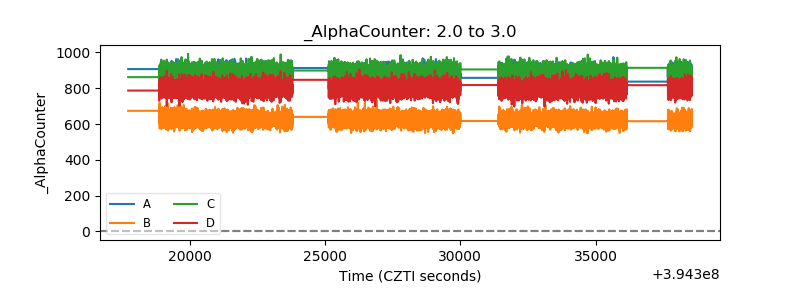 |
| _CPM_Rate | 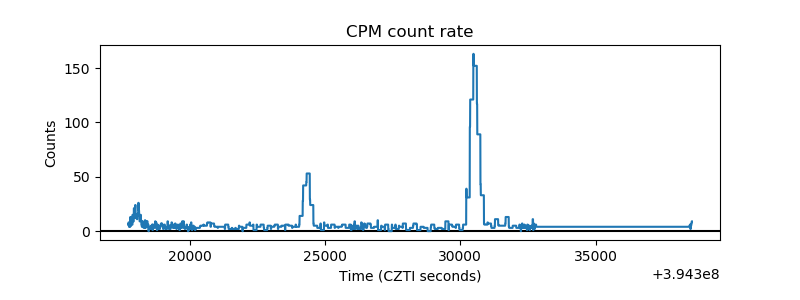 |
| CZT Counter | 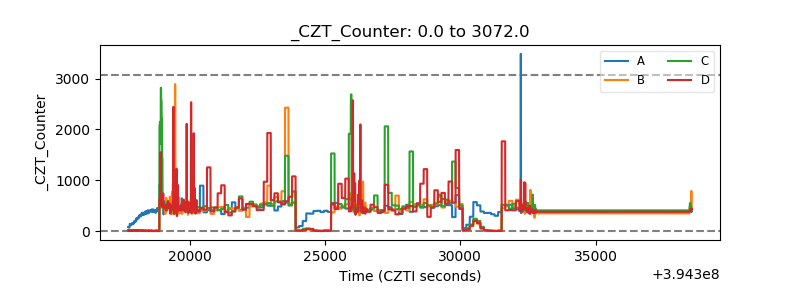 |
| +2.5 Volts monitor |  |
| +5 Volts monitor | 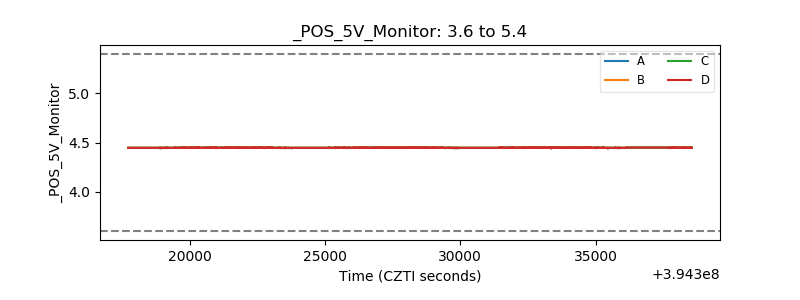 |
| _ROLL_ROT | 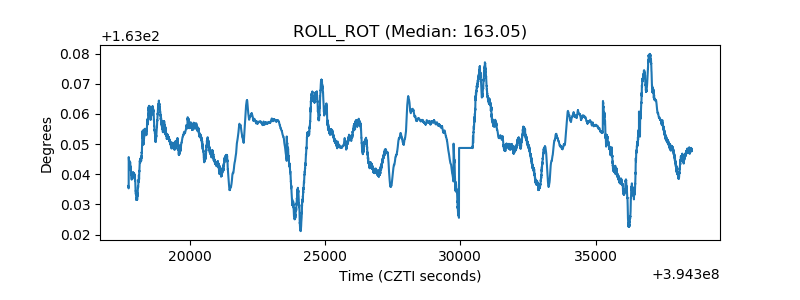 |
| _Roll_DEC | 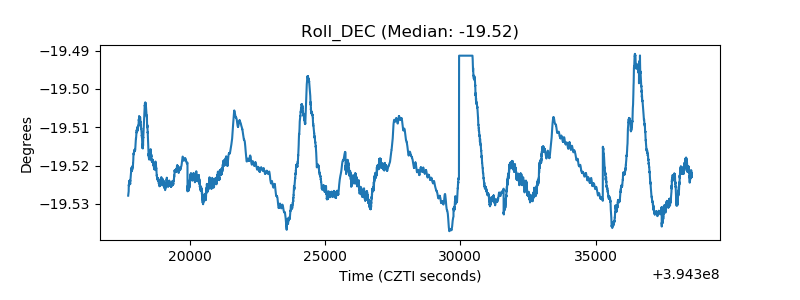 |
| _Roll_RA | 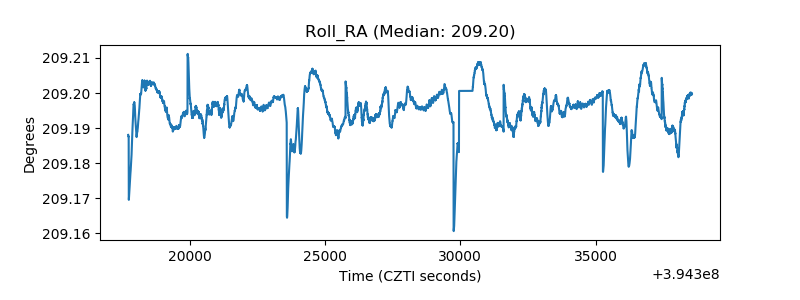 |
| Veto Counter | 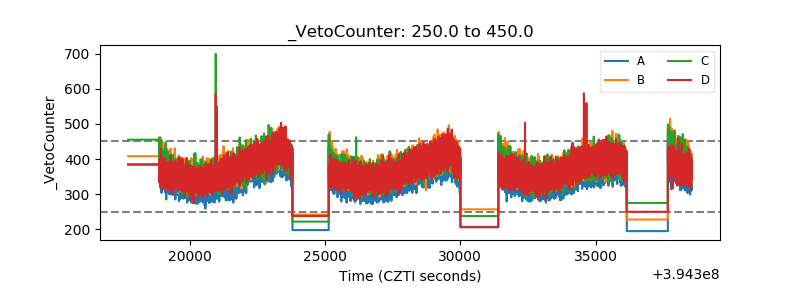 |