| Param | Original file | Final file |
|---|---|---|
| Filename | modeM0/AS1A11_089T02_9000005216_36531cztM0_level2.evt | modeM0/AS1A11_089T02_9000005216_36531cztM0_level2_quad_clean.evt |
| Size (bytes) | 474,733,440 | 60,520,320 |
| Size | 452.7 MB | 57.7 MB |
| Events in quadrant A | 3,137,311 | 361,477 |
| Events in quadrant B | 3,149,619 | 362,832 |
| Events in quadrant C | 4,083,321 | 348,457 |
| Events in quadrant D | 3,593,337 | 334,134 |
| Mode M9 | |||
|---|---|---|---|
| Quadrant | BADHDUFLAG | Total packets | Discarded packets |
| A | 0 | 32 | 0 |
| B | 0 | 32 | 0 |
| C | 0 | 32 | 0 |
| D | 0 | 32 | 0 |
| Mode M0 | |||
|---|---|---|---|
| Quadrant | BADHDUFLAG | Total packets | Discarded packets |
| A | 0 | 13034 | 3 |
| B | 0 | 13151 | 2 |
| C | 0 | 15766 | 2 |
| D | 0 | 14855 | 2 |
| Mode SS | |||
|---|---|---|---|
| Quadrant | BADHDUFLAG | Total packets | Discarded packets |
| A | 0 | 126 | 0 |
| B | 0 | 126 | 0 |
| C | 0 | 126 | 0 |
| D | 0 | 126 | 0 |
| Quadrant | Total seconds | Saturated seconds | Saturation percentage |
|---|---|---|---|
| A | 6092 | 58 | 0.952068% |
| B | 6092 | 34 | 0.558109% |
| C | 6092 | 362 | 5.942219% |
| D | 6092 | 162 | 2.659225% |
Noise dominated data is calculated using 1-second bins in cleaned event files. If a bin has >2000 counts, and if more than 50% of those come from <1% of pixels, then it is considered to be noise-dominated and hence unusable.
| Quadrant | # 1 sec bins | Bins with >0 counts | Bins with >2000 counts | High rate bins dominated by noise | Noise dominated (total time) | Noise dominated (detector-on time) | Marked lightcurve |
|---|---|---|---|---|---|---|---|
| A | 9259 | 6094 | 37 | 37 | 0.40% | 0.61% | 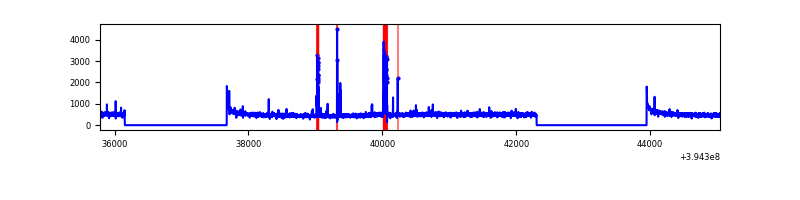 |
| B | 9259 | 6094 | 12 | 12 | 0.13% | 0.20% | 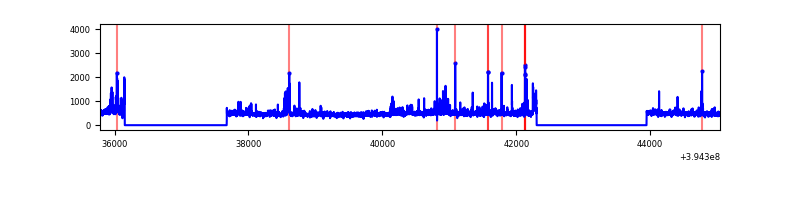 |
| C | 9259 | 6094 | 284 | 284 | 3.07% | 4.66% | 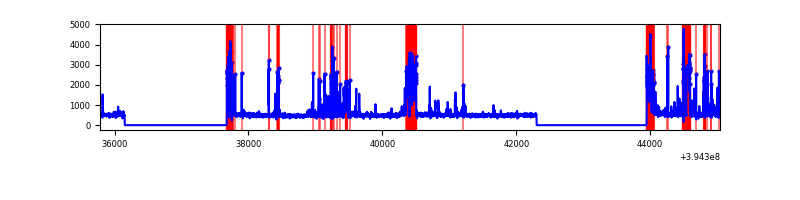 |
| D | 9259 | 6094 | 130 | 130 | 1.40% | 2.13% | 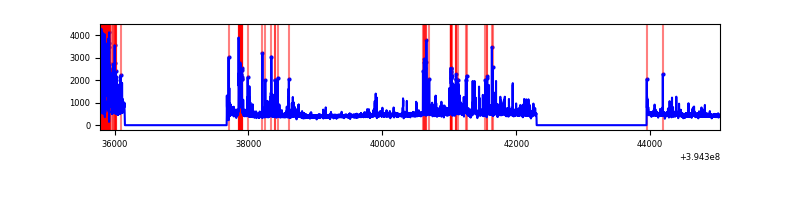 |
Top three noisy pixels from each quadrant. If the there are fewer than three noisy pixels in the level2.evt file, extra rows are filled as -1
| Pixel properties | Quadrant properties | ||||||
|---|---|---|---|---|---|---|---|
| Quadrant | DetID | PixID | Counts | Sigma | Mean | Median | Sigma |
| A | 10 | 83 | 219123 | 1524.31 | 708 | 694 | 143.3 |
| A | 9 | 143 | 170828 | 1187.28 | 708 | 694 | 143.3 |
| A | 13 | 254 | 8766 | 56.33 | 708 | 694 | 143.3 |
| B | 5 | 255 | 77382 | 572.28 | 705 | 687 | 134.0 |
| B | 5 | 172 | 72822 | 538.26 | 705 | 687 | 134.0 |
| B | 0 | 189 | 55965 | 412.47 | 705 | 687 | 134.0 |
| C | 14 | 254 | 804953 | 5167.82 | 667 | 671 | 155.6 |
| C | 0 | 10 | 329110 | 2110.35 | 667 | 671 | 155.6 |
| C | 15 | 214 | 257483 | 1650.12 | 667 | 671 | 155.6 |
| D | 13 | 249 | 442675 | 2674.69 | 677 | 658 | 165.3 |
| D | 12 | 16 | 155003 | 933.96 | 677 | 658 | 165.3 |
| D | 2 | 250 | 88405 | 530.97 | 677 | 658 | 165.3 |
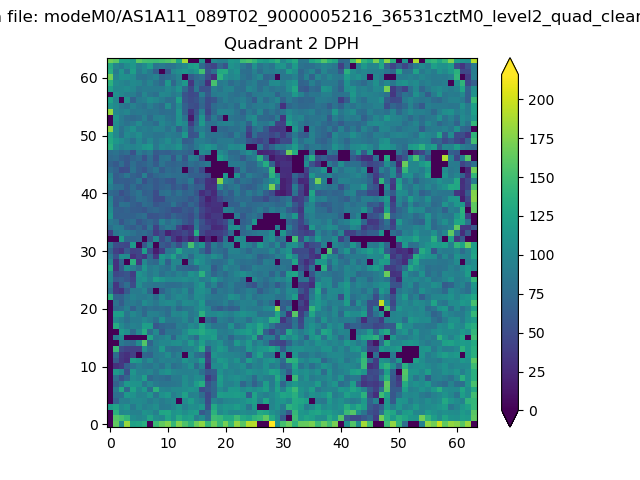
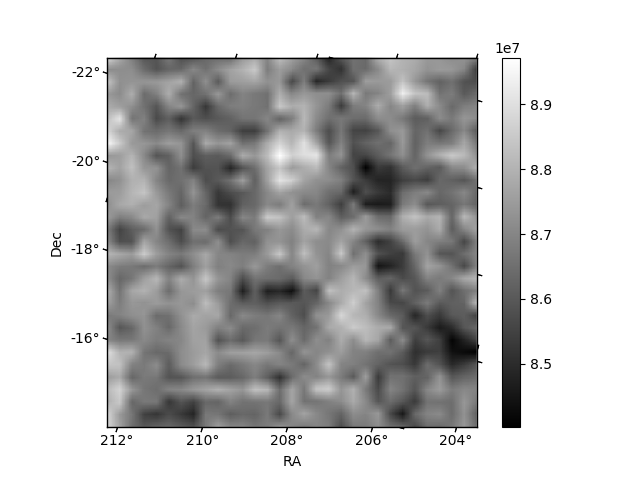
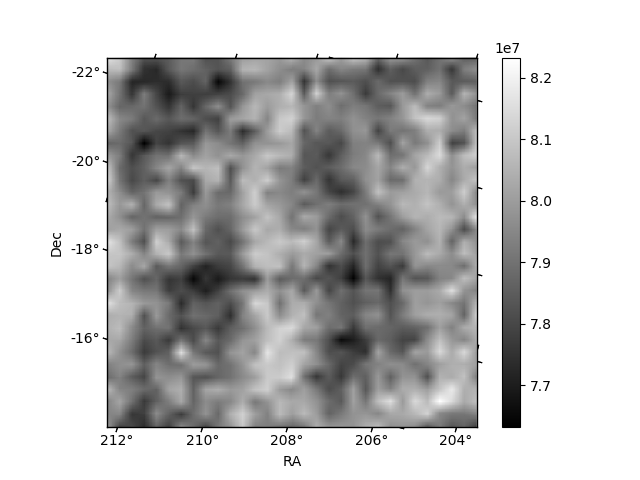
Histogram calculated using DETX and DETY for each event in the final _common_clean file
| Quadrant A | 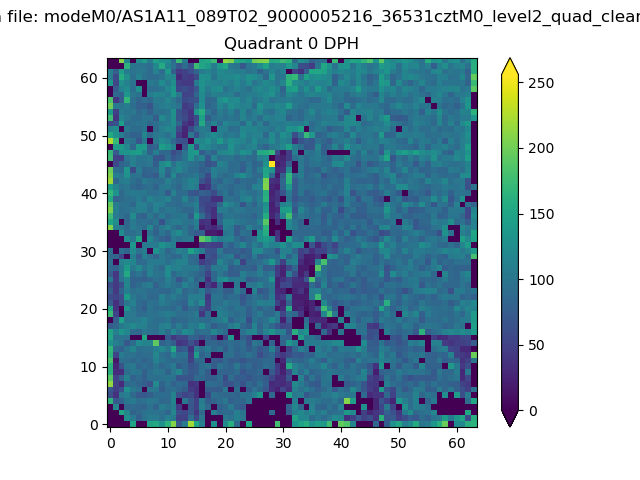 |
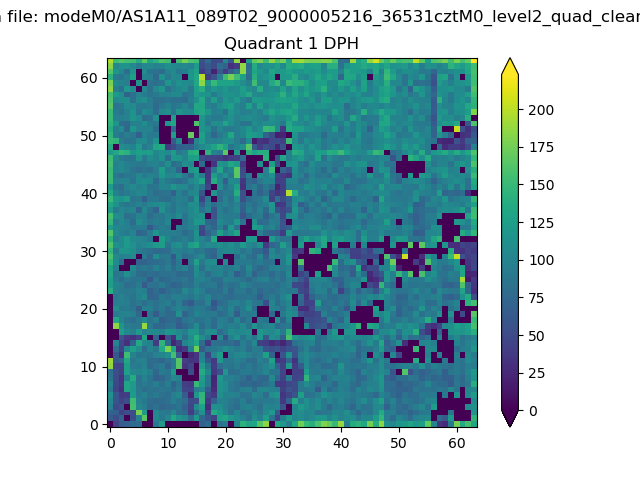 |
Quadrant B |
|---|---|---|---|
| Quadrant D | 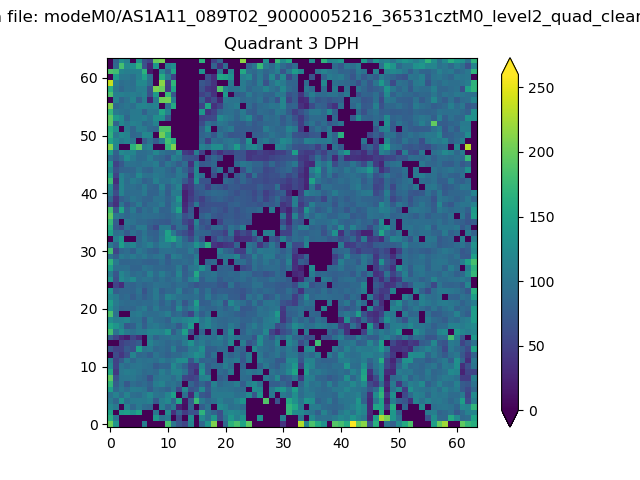 |
 |
Quadrant C |
| Plot type | Count rate plots | Images |
|---|---|---|
| Comparison with Poisson distribution Blue bars denote a histogram of data divided into 1 sec bins. Red curve is a Poisson curve with rate = median count rate of data. |
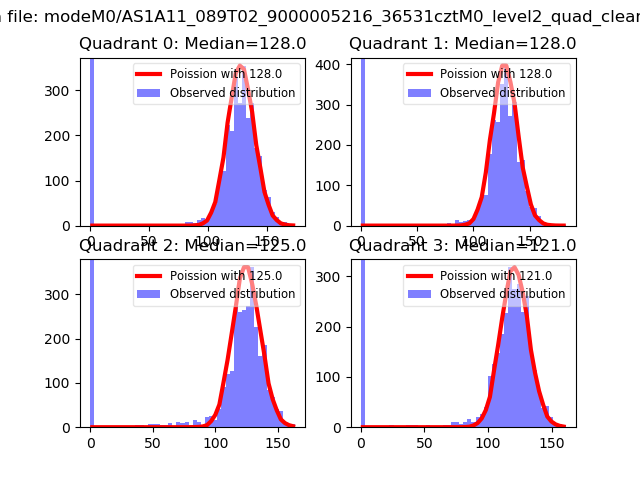 |
 |
| Quadrant-wise count rates Data is divided into 100 sec bins |
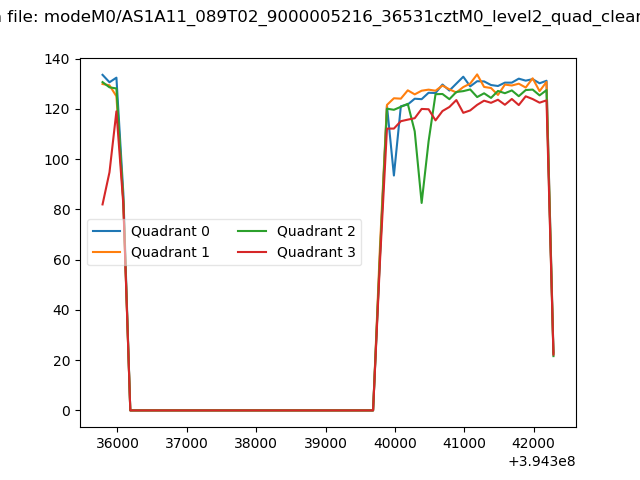 |
|
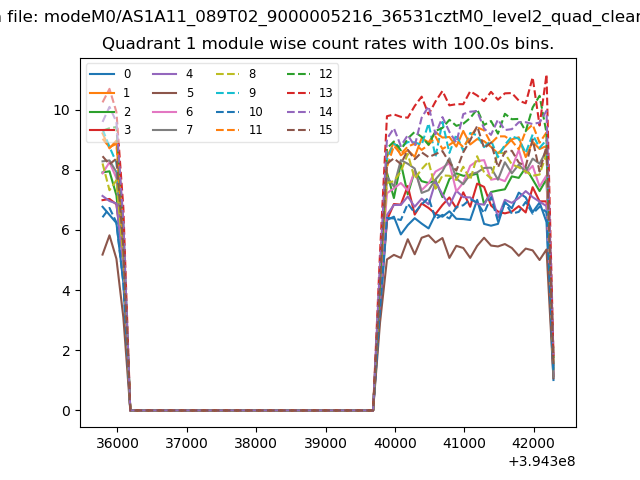
| Module-wise count rates for Quadrant A Data is divided into 100 sec bins |
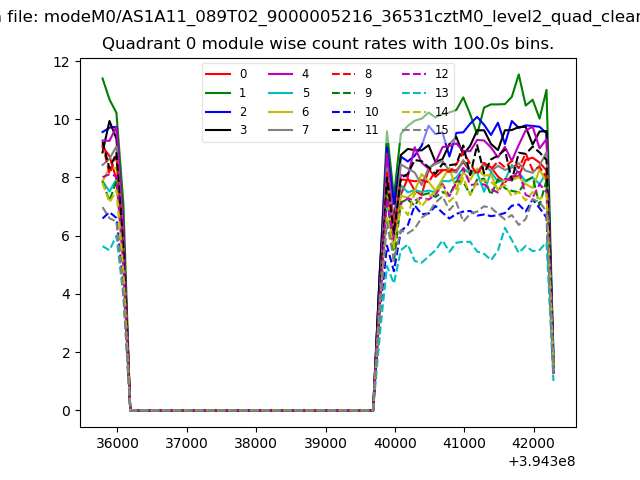 |
 |
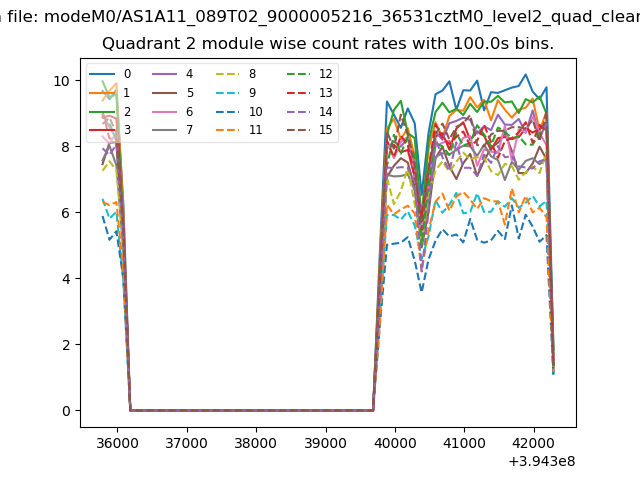
| Module-wise count rates for Quadrant B Data is divided into 100 sec bins |
 |
 |
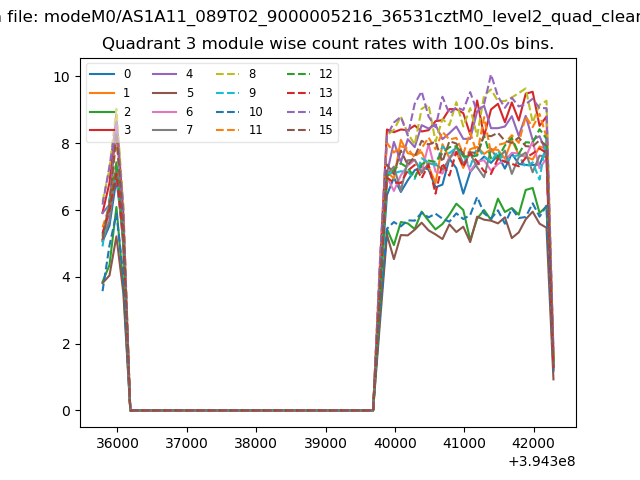
| Module-wise count rates for Quadrant C Data is divided into 100 sec bins |
 |
 |
| Module-wise count rates for Quadrant D Data is divided into 100 sec bins |
 |
 |
| Parameter | Plot |
|---|---|
| CZT HV Monitor |  |
| D_VDD | 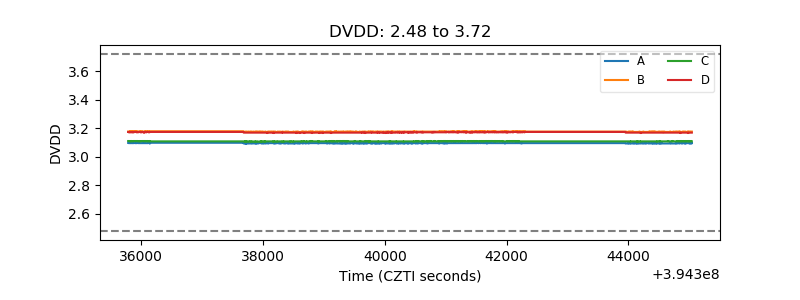 |
| Temperature 1 | 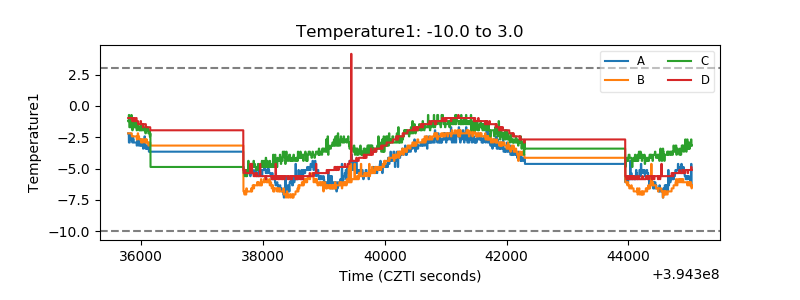 |
| Veto HV Monitor | 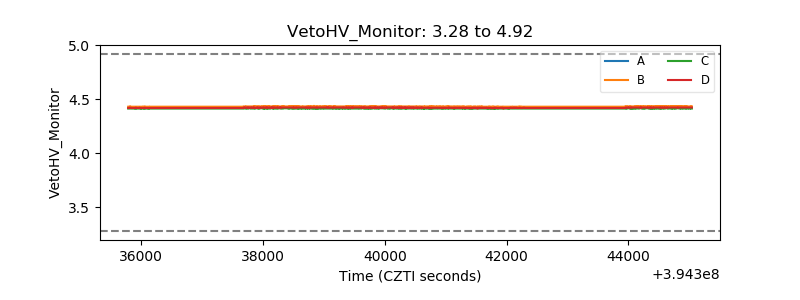 |
| Veto LLD |  |
| Alpha Counter | 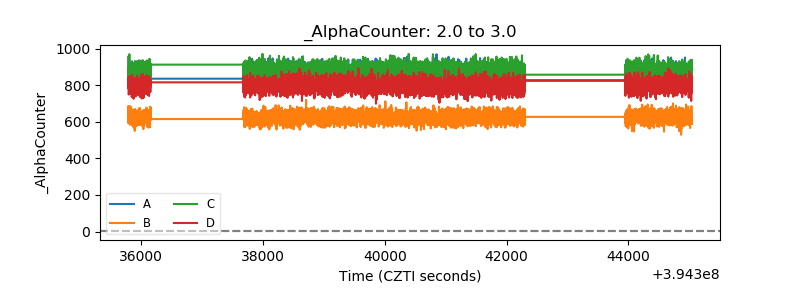 |
| _CPM_Rate | 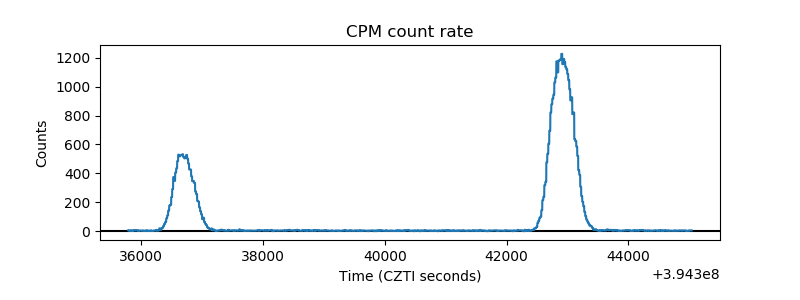 |
| CZT Counter | 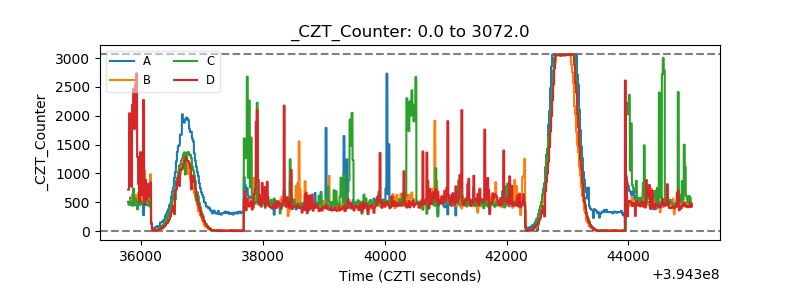 |
| +2.5 Volts monitor |  |
| +5 Volts monitor |  |
| _ROLL_ROT | 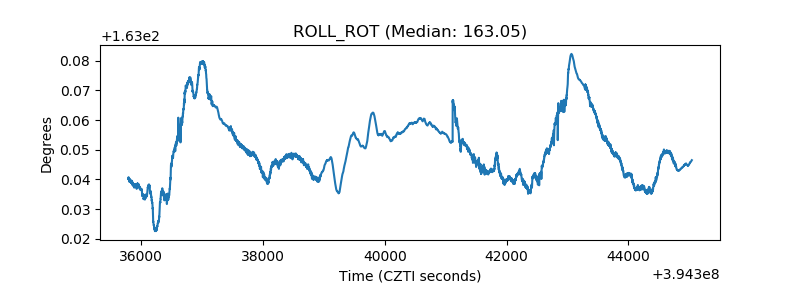 |
| _Roll_DEC | 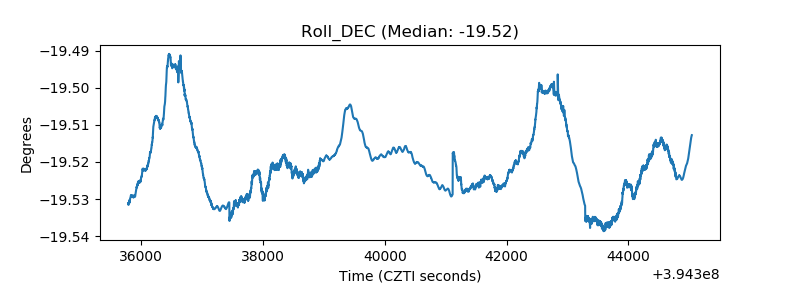 |
| _Roll_RA |  |
| Veto Counter | 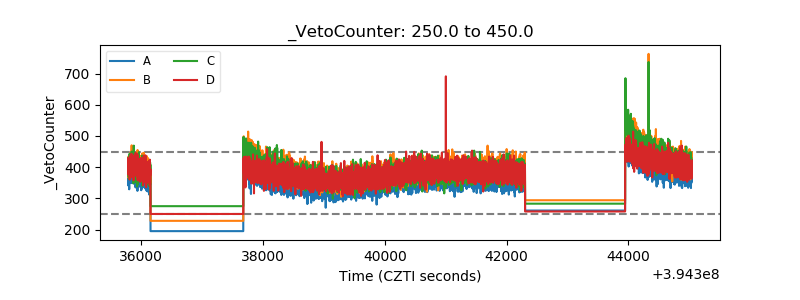 |