| Param | Original file | Final file |
|---|---|---|
| Filename | modeM0/AS1A11_089T02_9000005216_36533cztM0_level2.evt | modeM0/AS1A11_089T02_9000005216_36533cztM0_level2_quad_clean.evt |
| Size (bytes) | 436,639,680 | 59,535,360 |
| Size | 416.4 MB | 56.8 MB |
| Events in quadrant A | 2,849,061 | 362,946 |
| Events in quadrant B | 2,813,072 | 363,583 |
| Events in quadrant C | 3,654,752 | 353,269 |
| Events in quadrant D | 3,528,425 | 333,074 |
| Mode M9 | |||
|---|---|---|---|
| Quadrant | BADHDUFLAG | Total packets | Discarded packets |
| A | 0 | 34 | 0 |
| B | 0 | 34 | 0 |
| C | 0 | 34 | 0 |
| D | 0 | 34 | 0 |
| Mode M0 | |||
|---|---|---|---|
| Quadrant | BADHDUFLAG | Total packets | Discarded packets |
| A | 0 | 11799 | 3 |
| B | 0 | 11720 | 2 |
| C | 0 | 14071 | 2 |
| D | 0 | 14128 | 2 |
| Mode SS | |||
|---|---|---|---|
| Quadrant | BADHDUFLAG | Total packets | Discarded packets |
| A | 0 | 116 | 0 |
| B | 0 | 116 | 0 |
| C | 0 | 116 | 0 |
| D | 0 | 116 | 0 |
| Quadrant | Total seconds | Saturated seconds | Saturation percentage |
|---|---|---|---|
| A | 5566 | 15 | 0.269493% |
| B | 5566 | 20 | 0.359324% |
| C | 5566 | 279 | 5.012576% |
| D | 5566 | 163 | 2.928494% |
Noise dominated data is calculated using 1-second bins in cleaned event files. If a bin has >2000 counts, and if more than 50% of those come from <1% of pixels, then it is considered to be noise-dominated and hence unusable.
| Quadrant | # 1 sec bins | Bins with >0 counts | Bins with >2000 counts | High rate bins dominated by noise | Noise dominated (total time) | Noise dominated (detector-on time) | Marked lightcurve |
|---|---|---|---|---|---|---|---|
| A | 8972 | 5568 | 2 | 2 | 0.02% | 0.04% | 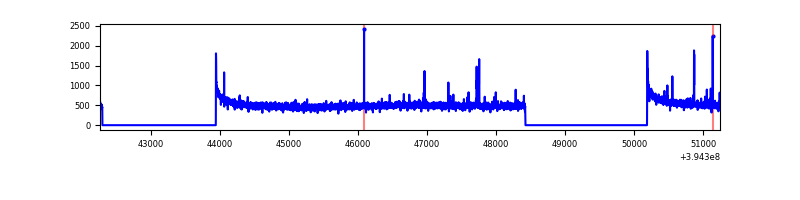 |
| B | 8972 | 5568 | 6 | 6 | 0.07% | 0.11% | 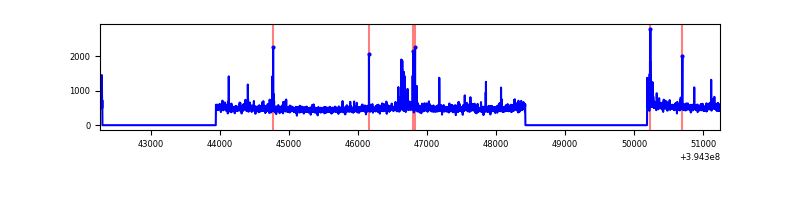 |
| C | 8972 | 5568 | 212 | 212 | 2.36% | 3.81% | 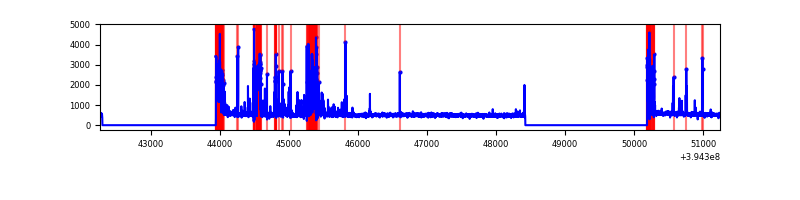 |
| D | 8972 | 5568 | 121 | 121 | 1.35% | 2.17% | 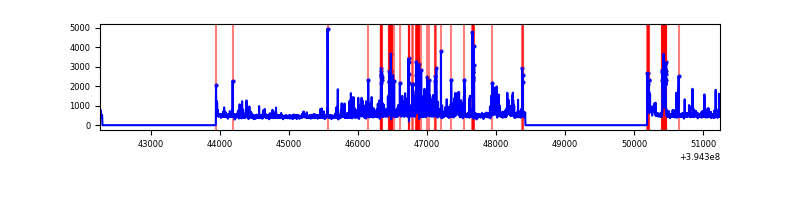 |
Top three noisy pixels from each quadrant. If the there are fewer than three noisy pixels in the level2.evt file, extra rows are filled as -1
| Pixel properties | Quadrant properties | ||||||
|---|---|---|---|---|---|---|---|
| Quadrant | DetID | PixID | Counts | Sigma | Mean | Median | Sigma |
| A | 10 | 83 | 205722 | 1522.95 | 671 | 659 | 134.6 |
| A | 15 | 223 | 33297 | 242.39 | 671 | 659 | 134.6 |
| A | 9 | 143 | 11995 | 84.19 | 671 | 659 | 134.6 |
| B | 5 | 255 | 56900 | 443.57 | 665 | 647 | 126.8 |
| B | 5 | 172 | 33968 | 262.75 | 665 | 647 | 126.8 |
| B | 0 | 190 | 25584 | 196.64 | 665 | 647 | 126.8 |
| C | 14 | 254 | 596988 | 4049.44 | 633 | 639 | 147.3 |
| C | 0 | 10 | 346440 | 2348.12 | 633 | 639 | 147.3 |
| C | 15 | 214 | 233924 | 1584.1 | 633 | 639 | 147.3 |
| D | 12 | 16 | 362972 | 2305.88 | 641 | 623 | 157.1 |
| D | 12 | 227 | 144611 | 916.3 | 641 | 623 | 157.1 |
| D | 2 | 153 | 129293 | 818.82 | 641 | 623 | 157.1 |
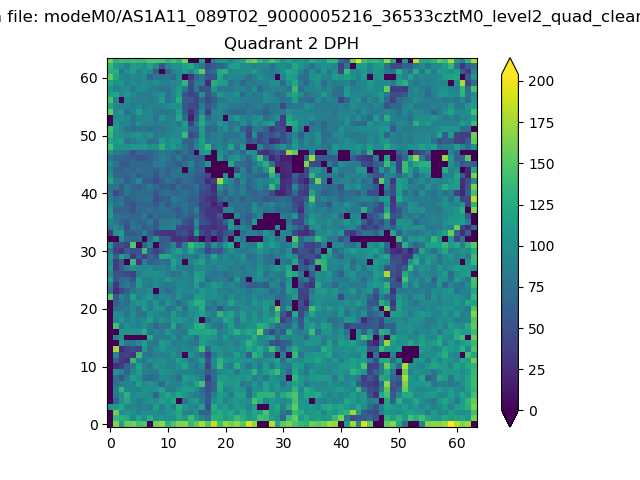
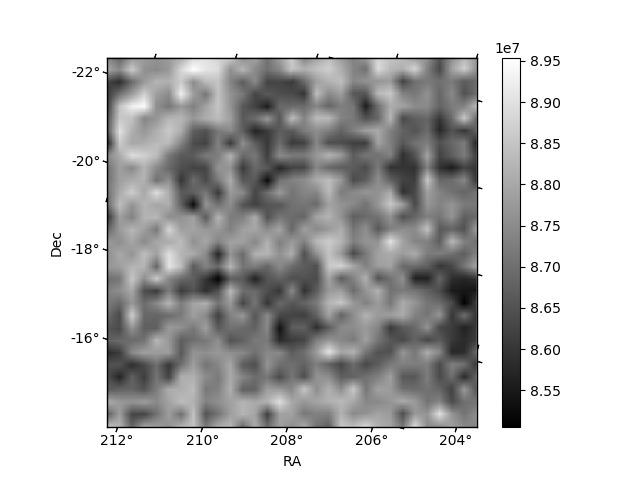
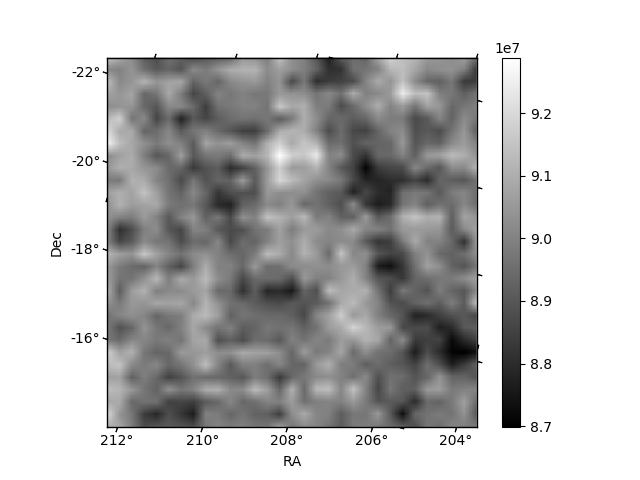
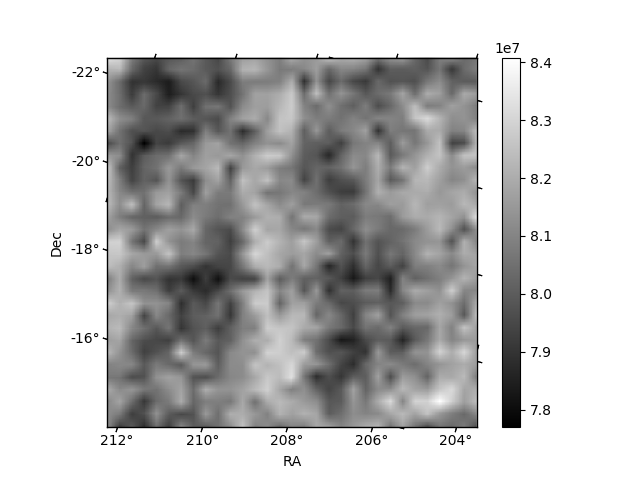
Histogram calculated using DETX and DETY for each event in the final _common_clean file
| Quadrant A |  |
 |
Quadrant B |
|---|---|---|---|
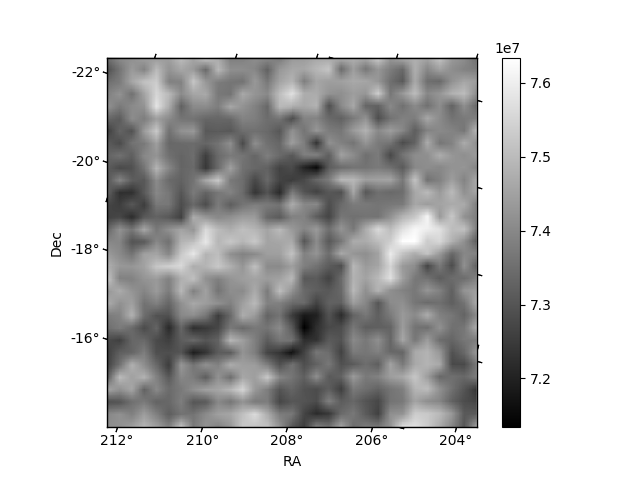
| Quadrant D | 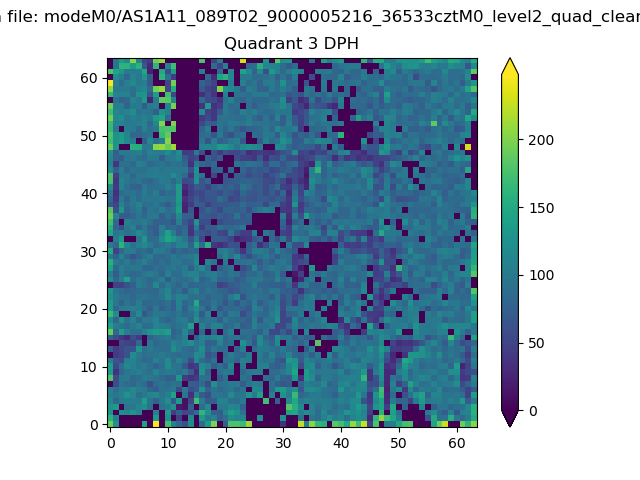 |
 |
Quadrant C |
| Plot type | Count rate plots | Images |
|---|---|---|
| Comparison with Poisson distribution Blue bars denote a histogram of data divided into 1 sec bins. Red curve is a Poisson curve with rate = median count rate of data. |
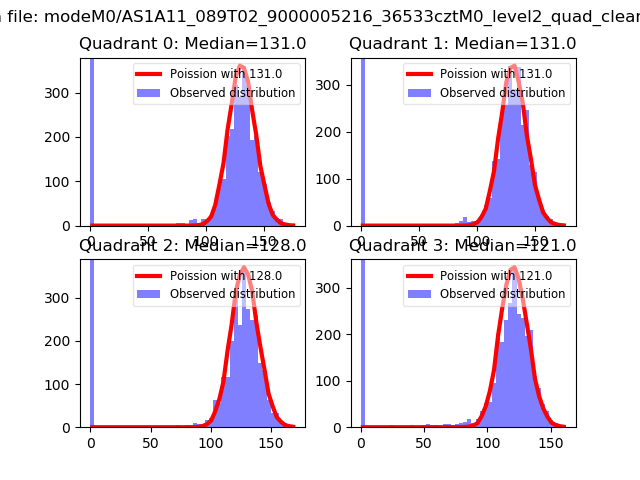 |
 |
| Quadrant-wise count rates Data is divided into 100 sec bins |
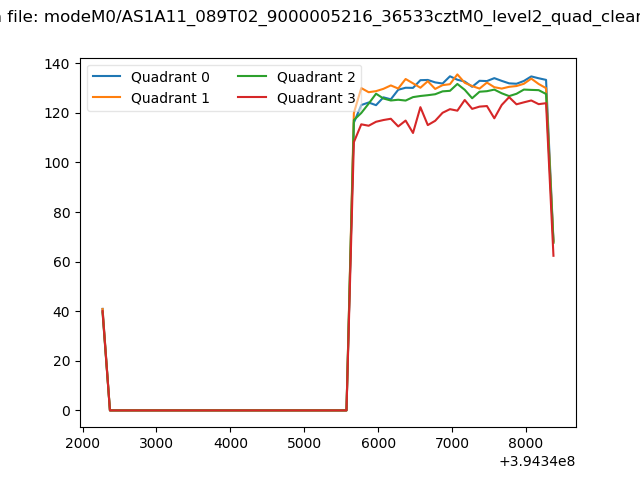 |
|
| Module-wise count rates for Quadrant A Data is divided into 100 sec bins |
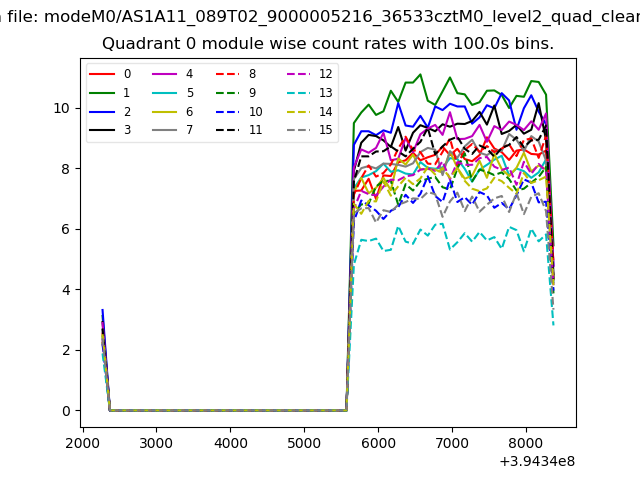 |
 |
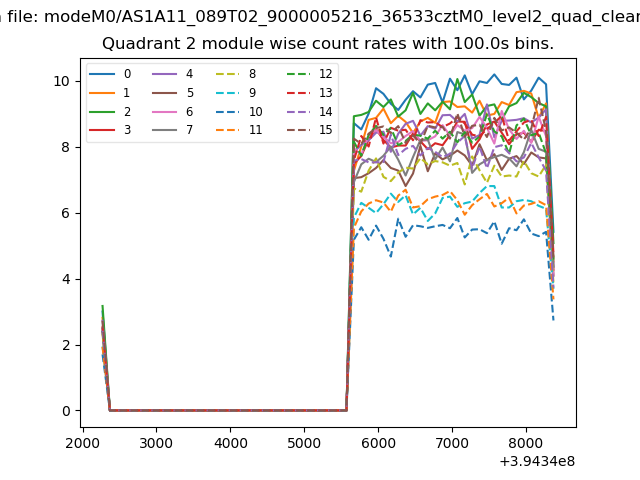
| Module-wise count rates for Quadrant B Data is divided into 100 sec bins |
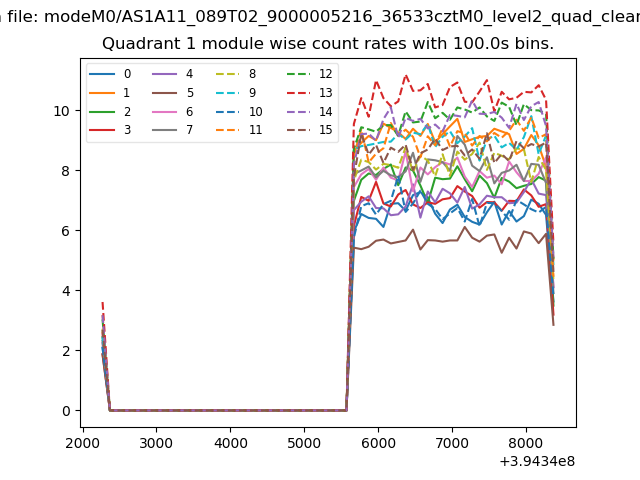 |
 |
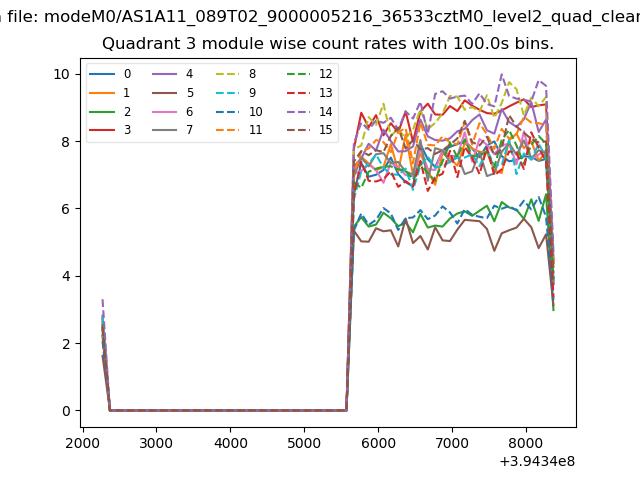
| Module-wise count rates for Quadrant C Data is divided into 100 sec bins |
 |
 |
| Module-wise count rates for Quadrant D Data is divided into 100 sec bins |
 |
 |
| Parameter | Plot |
|---|---|
| CZT HV Monitor | 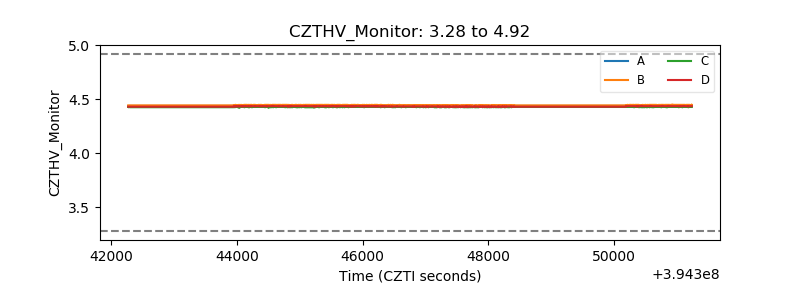 |
| D_VDD | 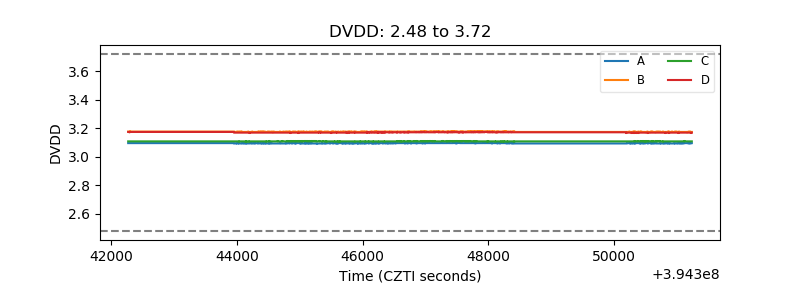 |
| Temperature 1 | 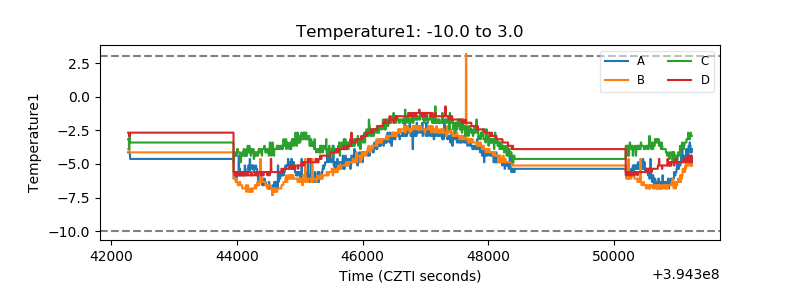 |
| Veto HV Monitor | 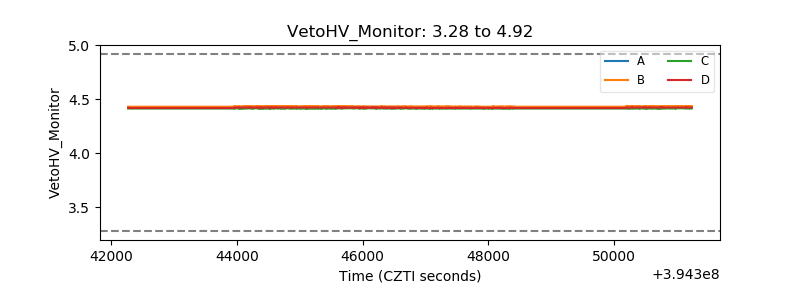 |
| Veto LLD | 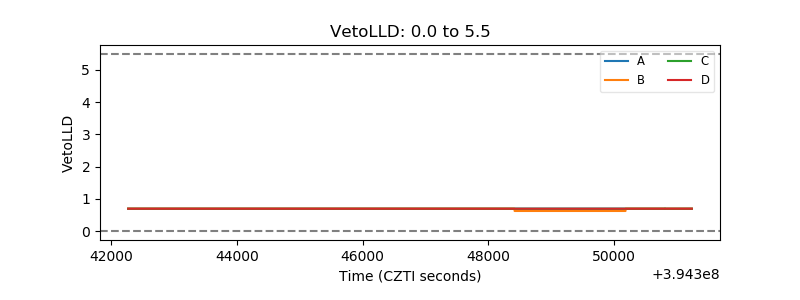 |
| Alpha Counter | 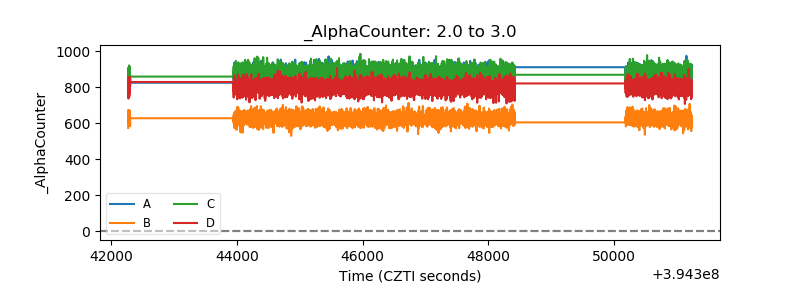 |
| _CPM_Rate | 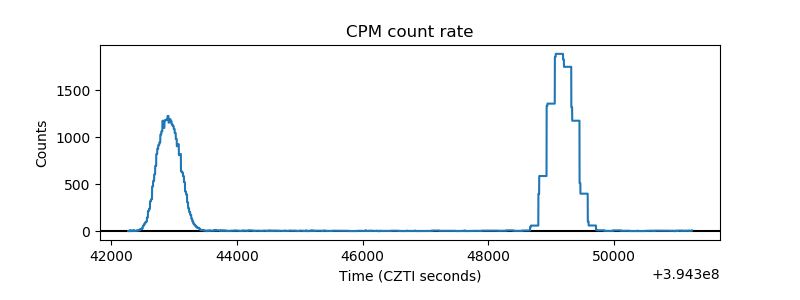 |
| CZT Counter | 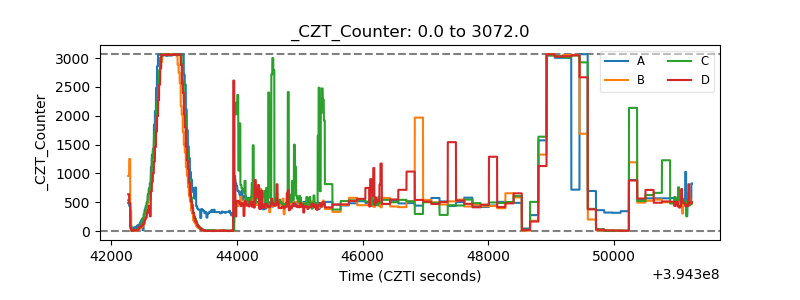 |
| +2.5 Volts monitor |  |
| +5 Volts monitor | 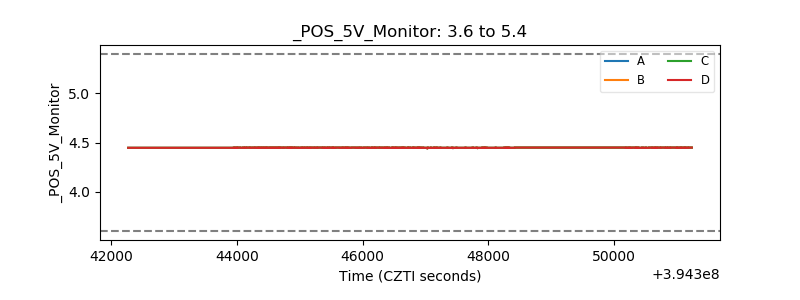 |
| _ROLL_ROT | 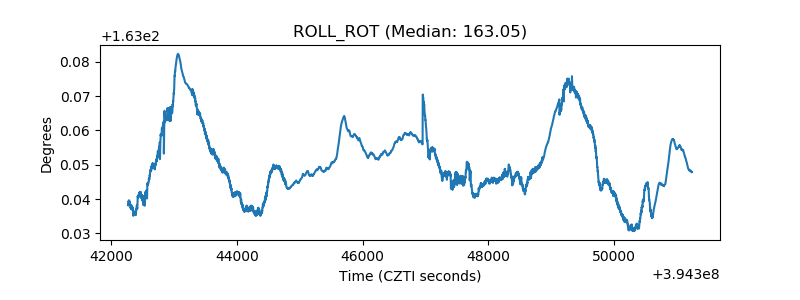 |
| _Roll_DEC | 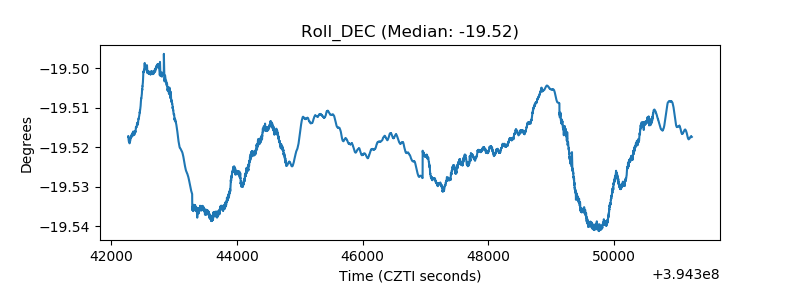 |
| _Roll_RA | 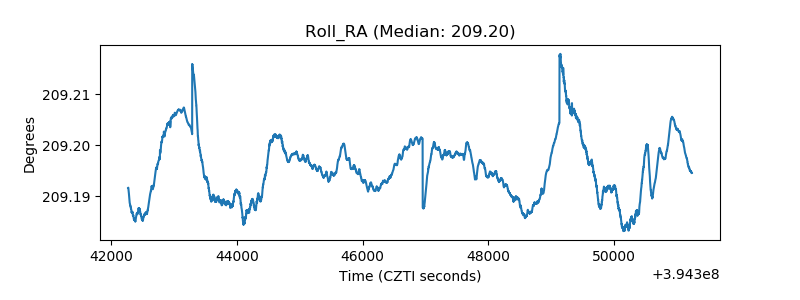 |
| Veto Counter | 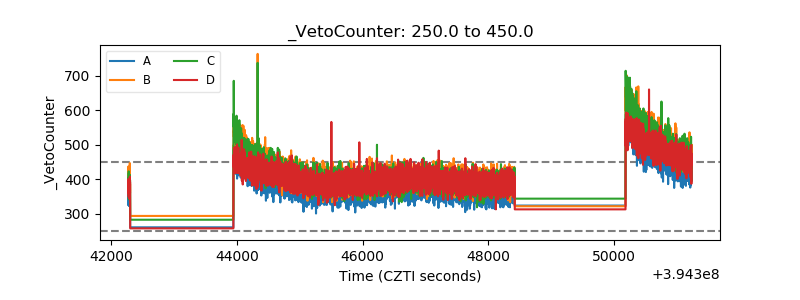 |