| Param | Original file | Final file |
|---|---|---|
| Filename | modeM0/AS1A11_089T02_9000005216_36534cztM0_level2.evt | modeM0/AS1A11_089T02_9000005216_36534cztM0_level2_quad_clean.evt |
| Size (bytes) | 426,833,280 | 66,110,400 |
| Size | 407.1 MB | 63.0 MB |
| Events in quadrant A | 2,876,701 | 418,716 |
| Events in quadrant B | 2,904,735 | 420,246 |
| Events in quadrant C | 3,192,798 | 406,928 |
| Events in quadrant D | 3,593,449 | 385,759 |
| Mode M9 | |||
|---|---|---|---|
| Quadrant | BADHDUFLAG | Total packets | Discarded packets |
| A | 0 | 34 | 0 |
| B | 0 | 34 | 0 |
| C | 0 | 34 | 0 |
| D | 0 | 35 | 0 |
| Mode M0 | |||
|---|---|---|---|
| Quadrant | BADHDUFLAG | Total packets | Discarded packets |
| A | 0 | 11608 | 3 |
| B | 0 | 11752 | 2 |
| C | 0 | 12535 | 2 |
| D | 0 | 14039 | 2 |
| Mode SS | |||
|---|---|---|---|
| Quadrant | BADHDUFLAG | Total packets | Discarded packets |
| A | 0 | 108 | 0 |
| B | 0 | 108 | 0 |
| C | 0 | 108 | 0 |
| D | 0 | 108 | 0 |
| Quadrant | Total seconds | Saturated seconds | Saturation percentage |
|---|---|---|---|
| A | 5283 | 23 | 0.435359% |
| B | 5283 | 35 | 0.662502% |
| C | 5283 | 156 | 2.952868% |
| D | 5283 | 180 | 3.407155% |
Noise dominated data is calculated using 1-second bins in cleaned event files. If a bin has >2000 counts, and if more than 50% of those come from <1% of pixels, then it is considered to be noise-dominated and hence unusable.
| Quadrant | # 1 sec bins | Bins with >0 counts | Bins with >2000 counts | High rate bins dominated by noise | Noise dominated (total time) | Noise dominated (detector-on time) | Marked lightcurve |
|---|---|---|---|---|---|---|---|
| A | 7166 | 5284 | 13 | 13 | 0.18% | 0.25% | 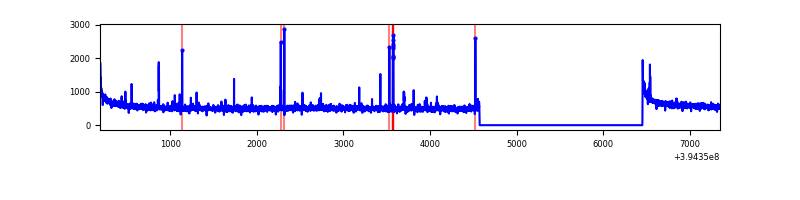 |
| B | 7166 | 5284 | 20 | 20 | 0.28% | 0.38% | 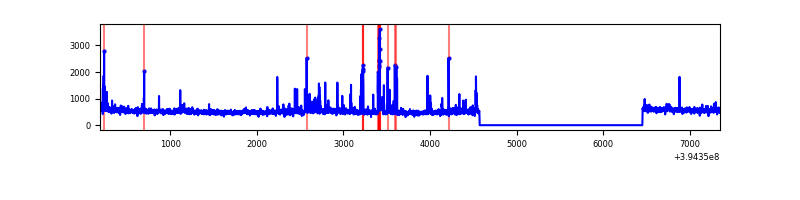 |
| C | 7166 | 5284 | 106 | 106 | 1.48% | 2.01% | 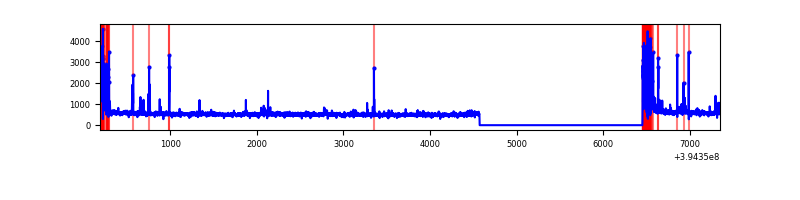 |
| D | 7166 | 5284 | 152 | 152 | 2.12% | 2.88% | 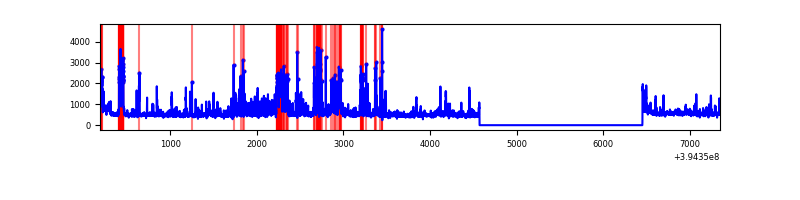 |
Top three noisy pixels from each quadrant. If the there are fewer than three noisy pixels in the level2.evt file, extra rows are filled as -1
| Pixel properties | Quadrant properties | ||||||
|---|---|---|---|---|---|---|---|
| Quadrant | DetID | PixID | Counts | Sigma | Mean | Median | Sigma |
| A | 10 | 83 | 202536 | 1508.91 | 671 | 660 | 133.8 |
| A | 15 | 223 | 56492 | 417.31 | 671 | 660 | 133.8 |
| A | 9 | 143 | 21756 | 157.68 | 671 | 660 | 133.8 |
| B | 15 | 85 | 86626 | 684.42 | 663 | 648 | 125.6 |
| B | 5 | 172 | 71020 | 560.19 | 663 | 648 | 125.6 |
| B | 5 | 255 | 61407 | 483.66 | 663 | 648 | 125.6 |
| C | 0 | 10 | 395956 | 2696.86 | 634 | 638 | 146.6 |
| C | 15 | 214 | 225216 | 1532.07 | 634 | 638 | 146.6 |
| C | 14 | 254 | 55247 | 372.54 | 634 | 638 | 146.6 |
| D | 12 | 227 | 300085 | 1936.42 | 642 | 626 | 154.6 |
| D | 12 | 16 | 263322 | 1698.7 | 642 | 626 | 154.6 |
| D | 2 | 153 | 124750 | 802.63 | 642 | 626 | 154.6 |
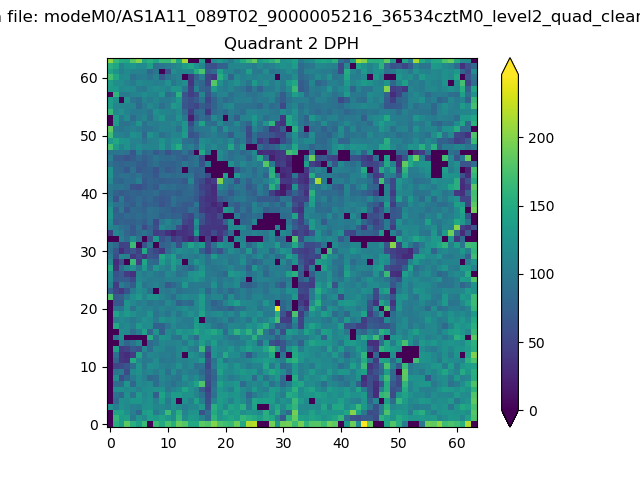
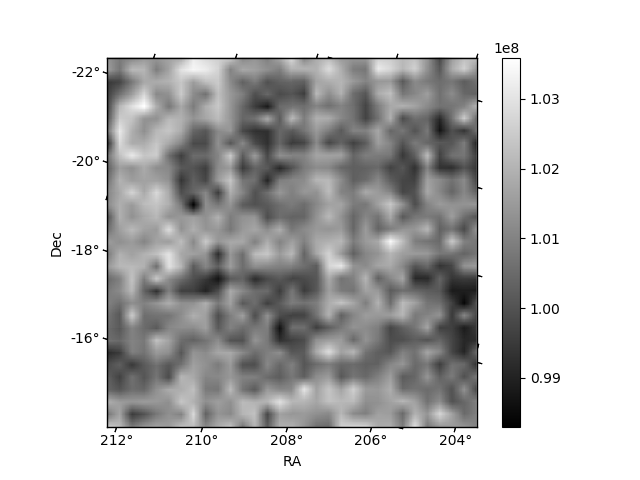
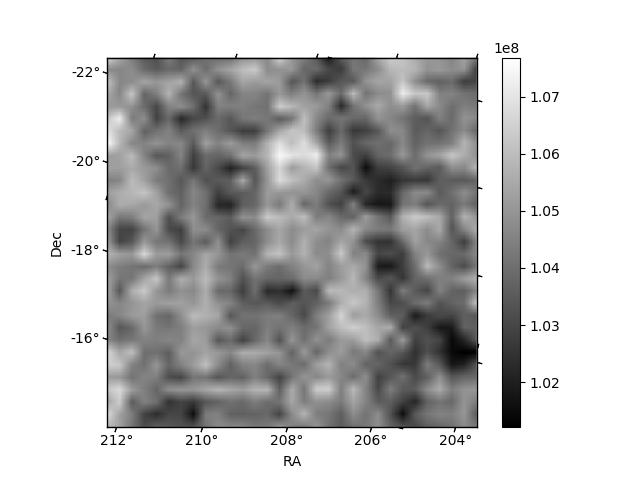
Histogram calculated using DETX and DETY for each event in the final _common_clean file
| Quadrant A | 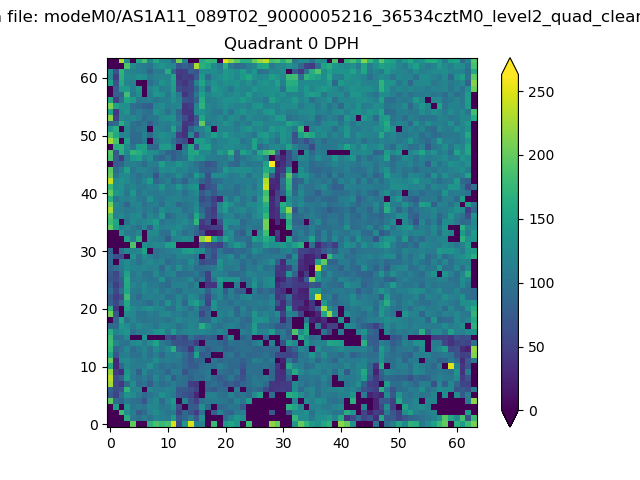 |
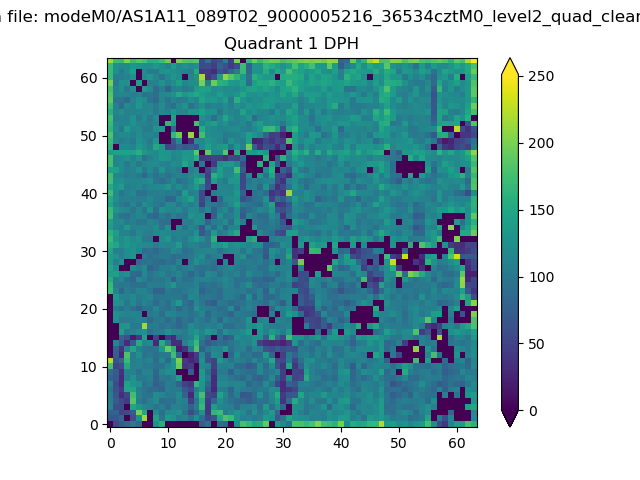 |
Quadrant B |
|---|---|---|---|
| Quadrant D | 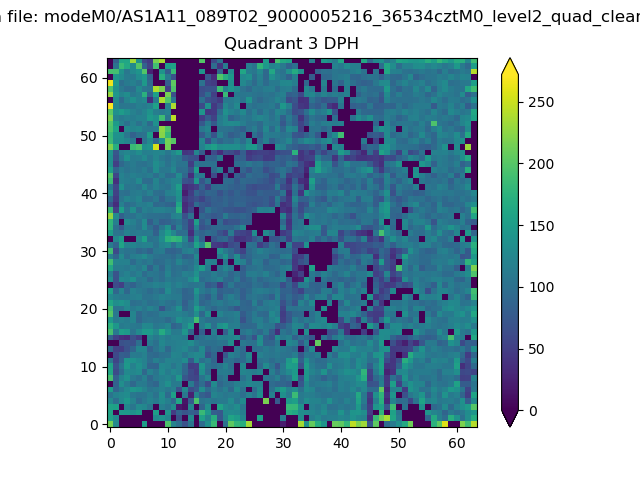 |
 |
Quadrant C |
| Plot type | Count rate plots | Images |
|---|---|---|
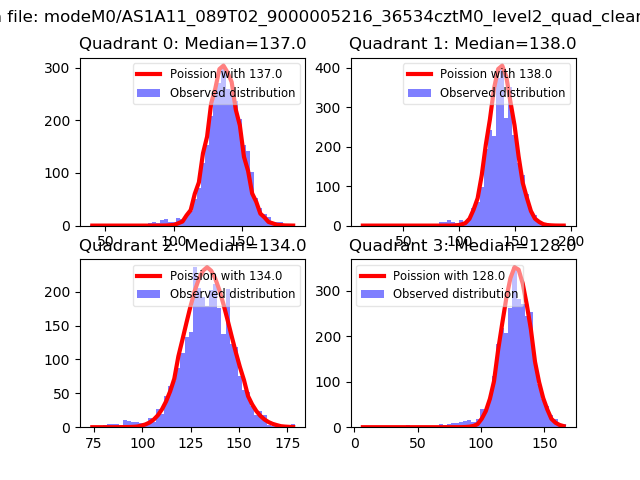
| Comparison with Poisson distribution Blue bars denote a histogram of data divided into 1 sec bins. Red curve is a Poisson curve with rate = median count rate of data. |
 |
 |
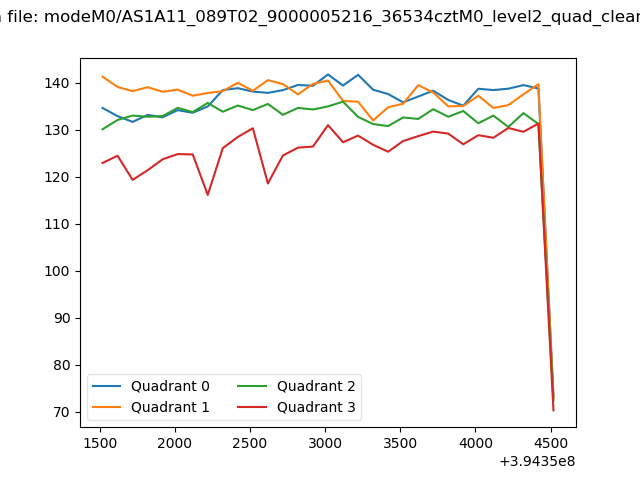
| Quadrant-wise count rates Data is divided into 100 sec bins |
 |
|
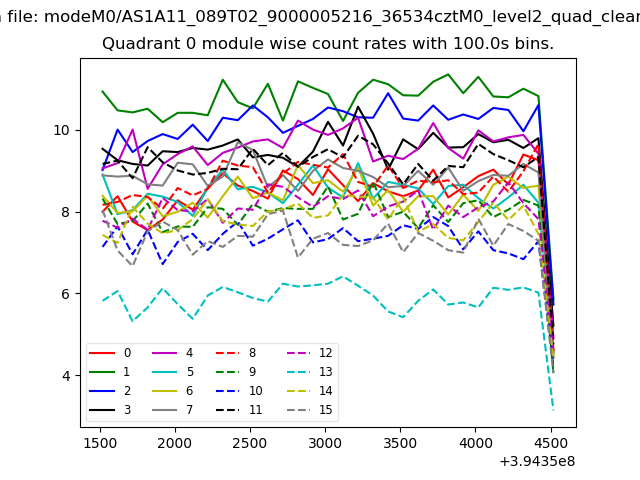
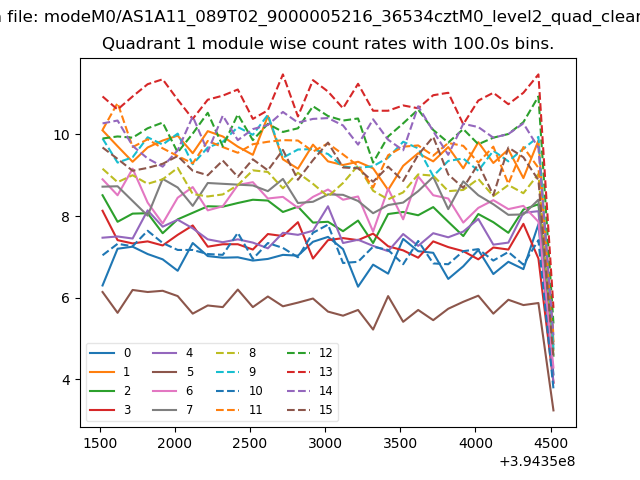
| Module-wise count rates for Quadrant A Data is divided into 100 sec bins |
 |
 |
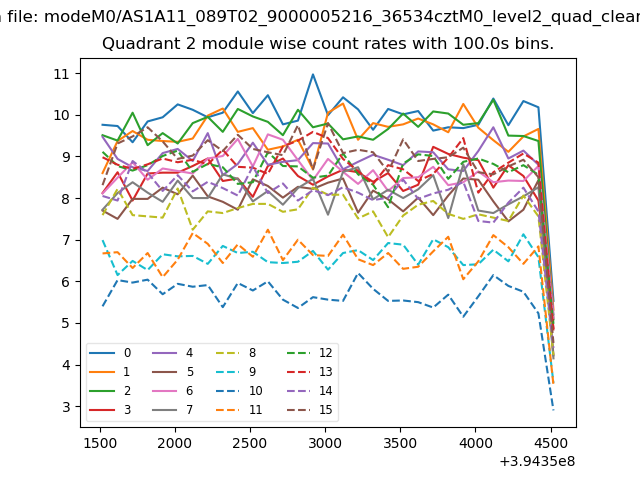
| Module-wise count rates for Quadrant B Data is divided into 100 sec bins |
 |
 |
| Module-wise count rates for Quadrant C Data is divided into 100 sec bins |
 |
 |
| Module-wise count rates for Quadrant D Data is divided into 100 sec bins |
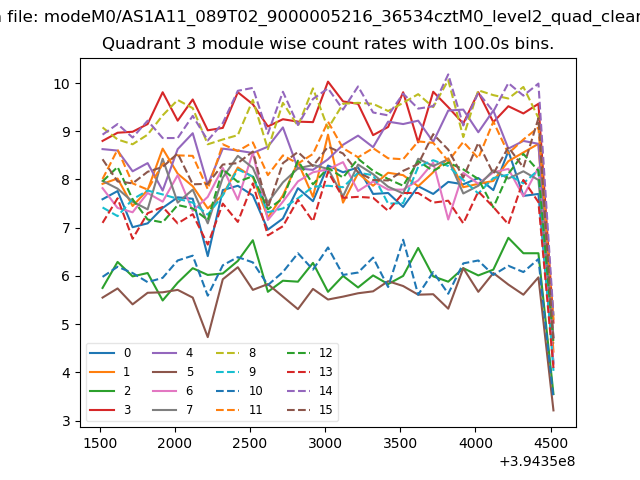 |
 |
| Parameter | Plot |
|---|---|
| CZT HV Monitor | 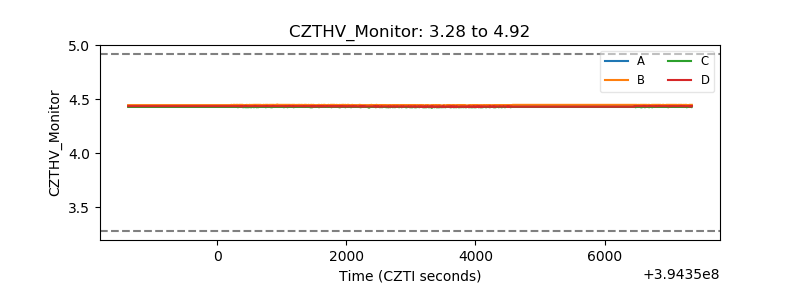 |
| D_VDD | 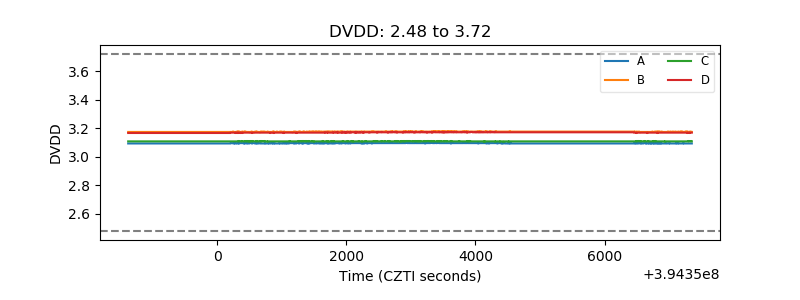 |
| Temperature 1 | 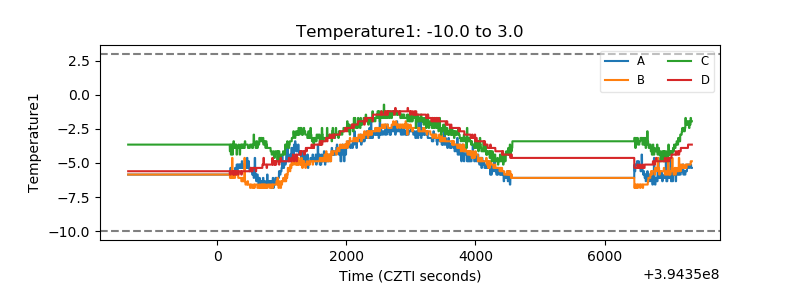 |
| Veto HV Monitor |  |
| Veto LLD | 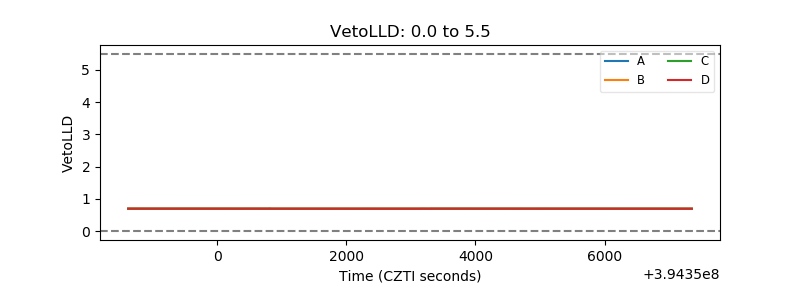 |
| Alpha Counter | 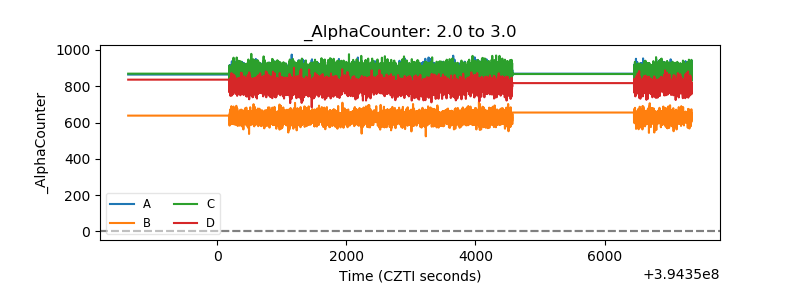 |
| _CPM_Rate |  |
| CZT Counter | 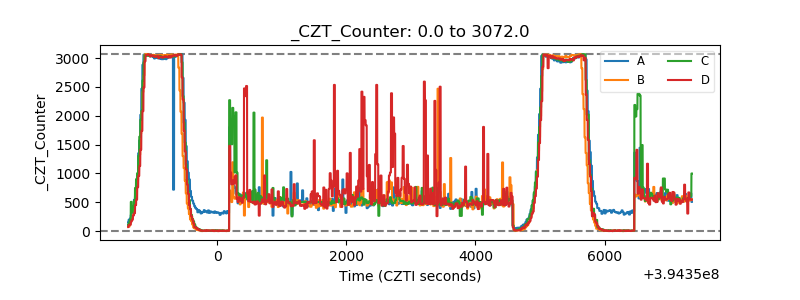 |
| +2.5 Volts monitor |  |
| +5 Volts monitor |  |
| _ROLL_ROT | 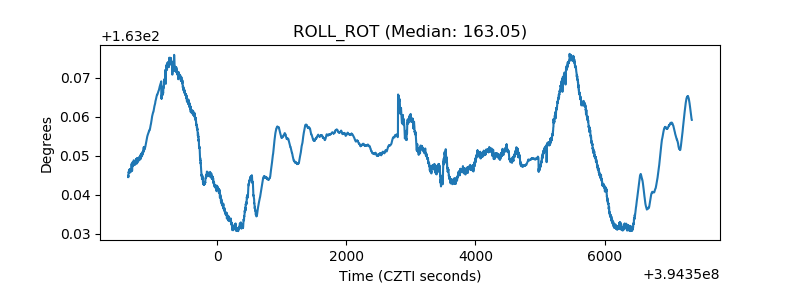 |
| _Roll_DEC | 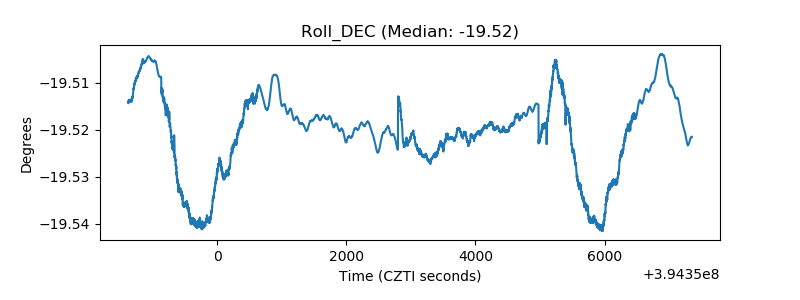 |
| _Roll_RA | 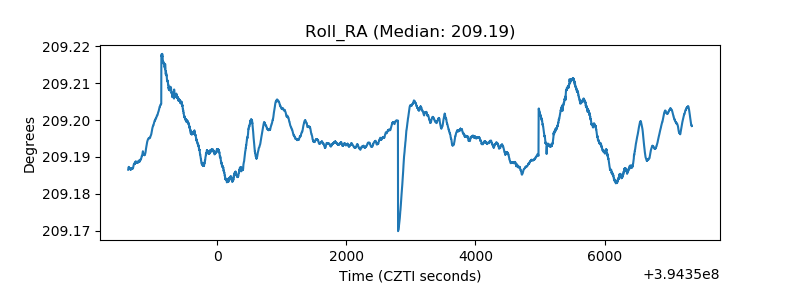 |
| Veto Counter | 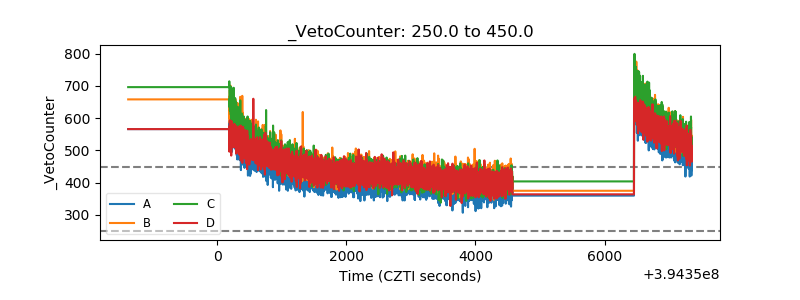 |