| Param | Original file | Final file |
|---|---|---|
| Filename | modeM0/AS1A11_089T02_9000005216_36536cztM0_level2.evt | modeM0/AS1A11_089T02_9000005216_36536cztM0_level2_quad_clean.evt |
| Size (bytes) | 464,034,240 | 95,431,680 |
| Size | 442.5 MB | 91.0 MB |
| Events in quadrant A | 2,792,426 | 658,907 |
| Events in quadrant B | 2,717,663 | 661,276 |
| Events in quadrant C | 3,717,517 | 628,771 |
| Events in quadrant D | 4,489,977 | 593,780 |
| Mode M9 | |||
|---|---|---|---|
| Quadrant | BADHDUFLAG | Total packets | Discarded packets |
| A | 0 | 27 | 0 |
| B | 0 | 27 | 0 |
| C | 0 | 27 | 0 |
| D | 0 | 28 | 0 |
| Mode M0 | |||
|---|---|---|---|
| Quadrant | BADHDUFLAG | Total packets | Discarded packets |
| A | 0 | 11259 | 3 |
| B | 0 | 10981 | 2 |
| C | 0 | 14332 | 2 |
| D | 0 | 16929 | 2 |
| Mode SS | |||
|---|---|---|---|
| Quadrant | BADHDUFLAG | Total packets | Discarded packets |
| A | 0 | 100 | 0 |
| B | 0 | 100 | 0 |
| C | 0 | 100 | 0 |
| D | 0 | 100 | 0 |
| Quadrant | Total seconds | Saturated seconds | Saturation percentage |
|---|---|---|---|
| A | 4957 | 14 | 0.282429% |
| B | 4957 | 13 | 0.262255% |
| C | 4957 | 264 | 5.325802% |
| D | 4957 | 237 | 4.781118% |
Noise dominated data is calculated using 1-second bins in cleaned event files. If a bin has >2000 counts, and if more than 50% of those come from <1% of pixels, then it is considered to be noise-dominated and hence unusable.
| Quadrant | # 1 sec bins | Bins with >0 counts | Bins with >2000 counts | High rate bins dominated by noise | Noise dominated (total time) | Noise dominated (detector-on time) | Marked lightcurve |
|---|---|---|---|---|---|---|---|
| A | 7050 | 4958 | 5 | 5 | 0.07% | 0.10% | 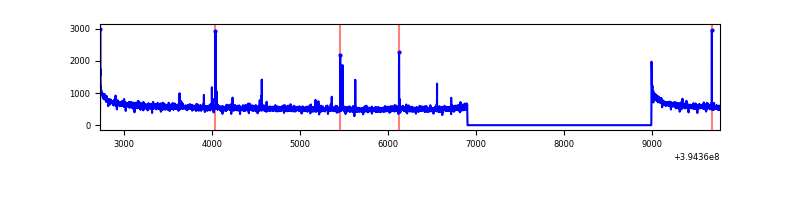 |
| B | 7050 | 4958 | 6 | 6 | 0.09% | 0.12% | 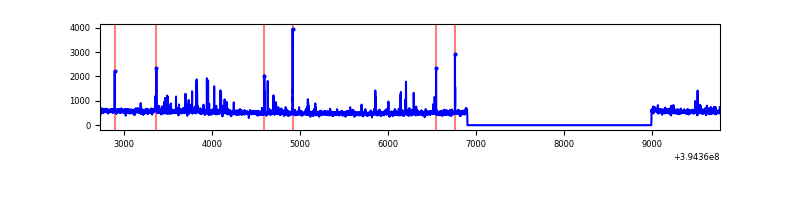 |
| C | 7050 | 4958 | 179 | 179 | 2.54% | 3.61% | 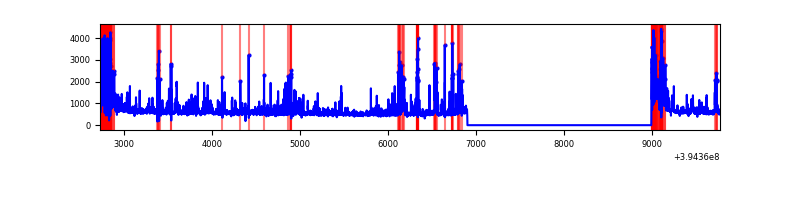 |
| D | 7050 | 4958 | 230 | 230 | 3.26% | 4.64% | 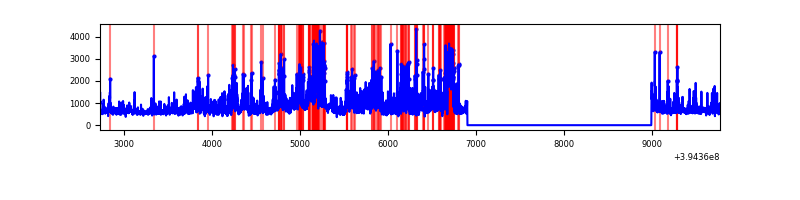 |
Top three noisy pixels from each quadrant. If the there are fewer than three noisy pixels in the level2.evt file, extra rows are filled as -1
| Pixel properties | Quadrant properties | ||||||
|---|---|---|---|---|---|---|---|
| Quadrant | DetID | PixID | Counts | Sigma | Mean | Median | Sigma |
| A | 10 | 83 | 197290 | 1507.59 | 657 | 647 | 130.4 |
| A | 15 | 223 | 31697 | 238.05 | 657 | 647 | 130.4 |
| A | 7 | 3 | 11769 | 85.27 | 657 | 647 | 130.4 |
| B | 5 | 172 | 45918 | 378.33 | 642 | 628 | 119.7 |
| B | 0 | 213 | 35717 | 293.12 | 642 | 628 | 119.7 |
| B | 5 | 255 | 34764 | 285.16 | 642 | 628 | 119.7 |
| C | 0 | 10 | 681283 | 4899.97 | 608 | 614 | 138.9 |
| C | 14 | 254 | 305319 | 2193.5 | 608 | 614 | 138.9 |
| C | 15 | 214 | 209924 | 1506.77 | 608 | 614 | 138.9 |
| D | 12 | 235 | 819327 | 5431.5 | 626 | 611 | 150.7 |
| D | 2 | 153 | 360387 | 2386.81 | 626 | 611 | 150.7 |
| D | 7 | 223 | 231220 | 1529.9 | 626 | 611 | 150.7 |
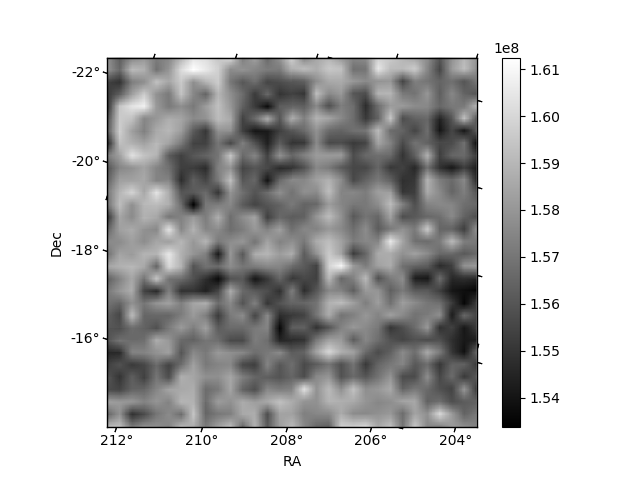
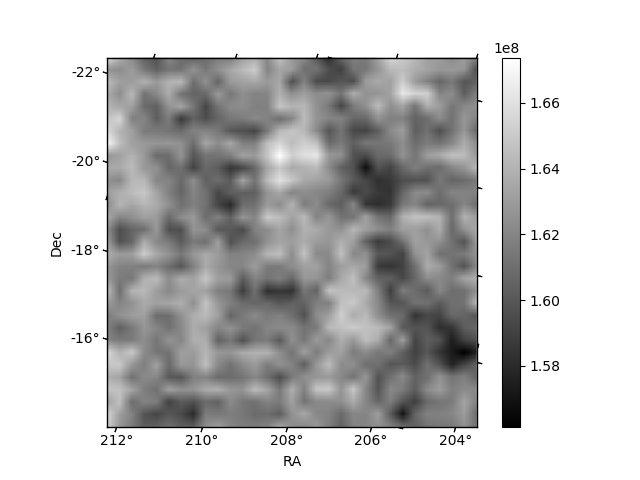
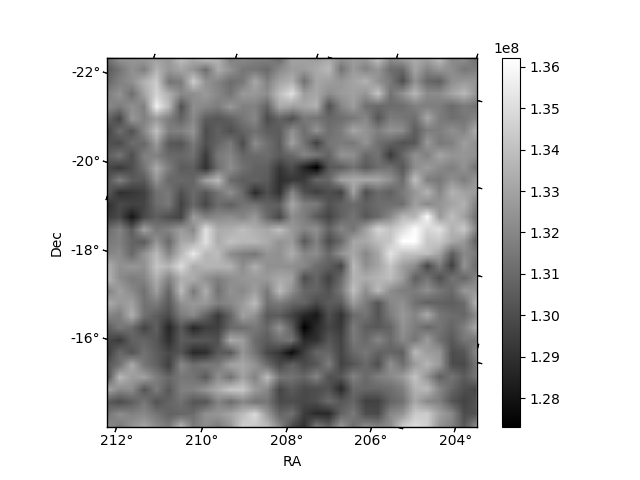
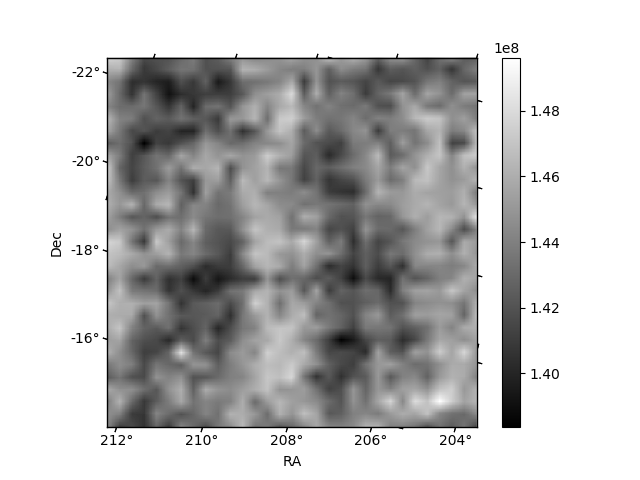
Histogram calculated using DETX and DETY for each event in the final _common_clean file
| Quadrant A | 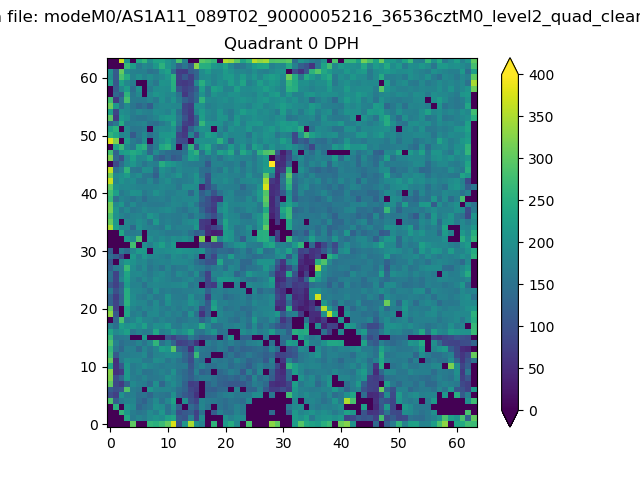 |
 |
Quadrant B |
|---|---|---|---|
| Quadrant D | 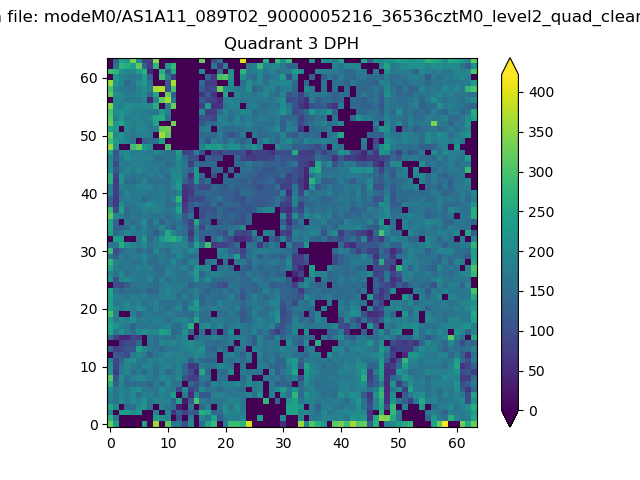 |
 |
Quadrant C |
| Plot type | Count rate plots | Images |
|---|---|---|
| Comparison with Poisson distribution Blue bars denote a histogram of data divided into 1 sec bins. Red curve is a Poisson curve with rate = median count rate of data. |
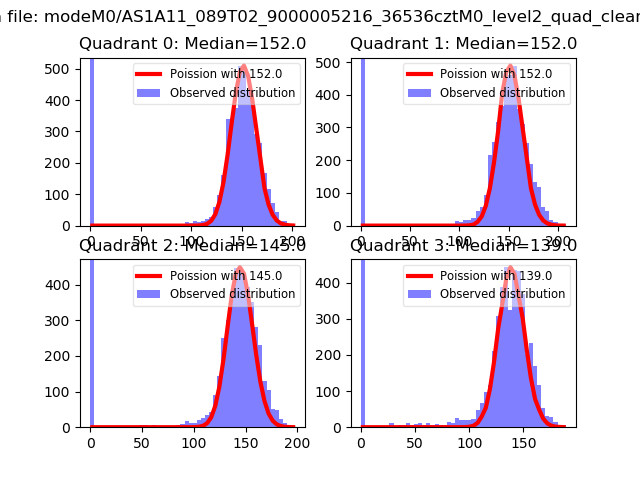 |
 |
| Quadrant-wise count rates Data is divided into 100 sec bins |
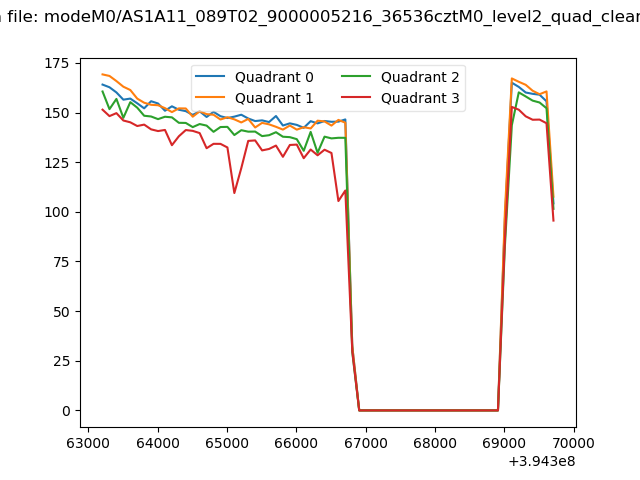 |
|
| Module-wise count rates for Quadrant A Data is divided into 100 sec bins |
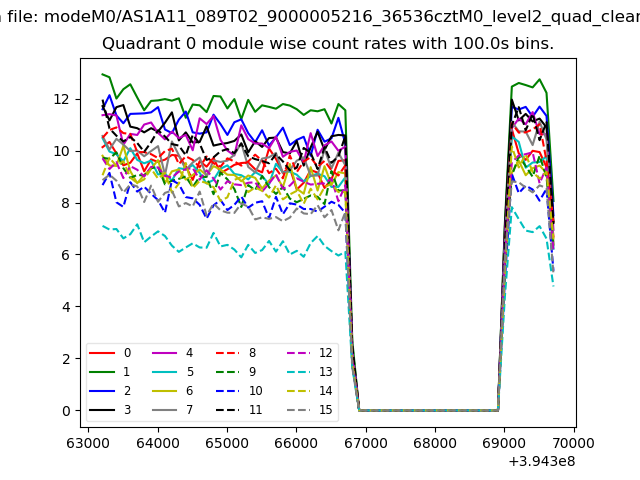 |
 |
| Module-wise count rates for Quadrant B Data is divided into 100 sec bins |
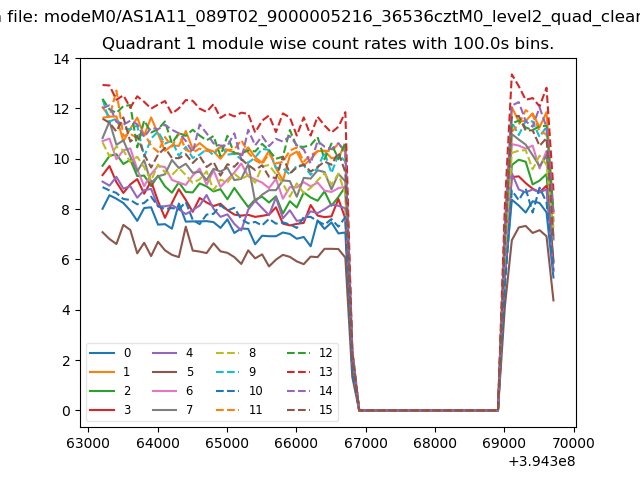 |
 |
| Module-wise count rates for Quadrant C Data is divided into 100 sec bins |
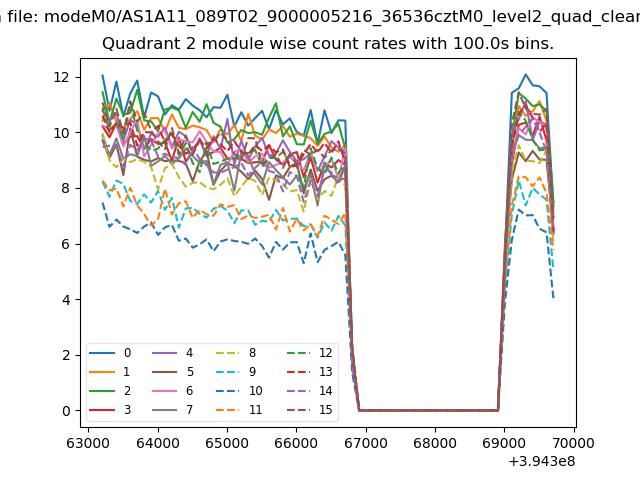 |
 |
| Module-wise count rates for Quadrant D Data is divided into 100 sec bins |
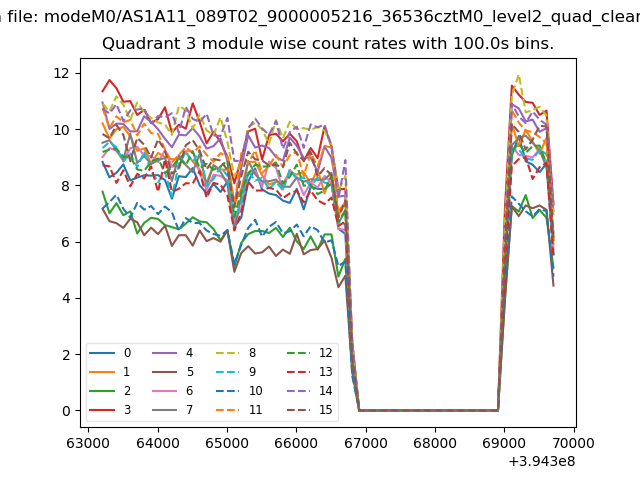 |
 |
| Parameter | Plot |
|---|---|
| CZT HV Monitor | 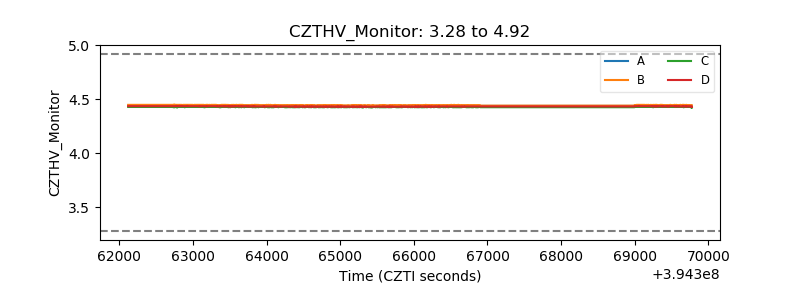 |
| D_VDD | 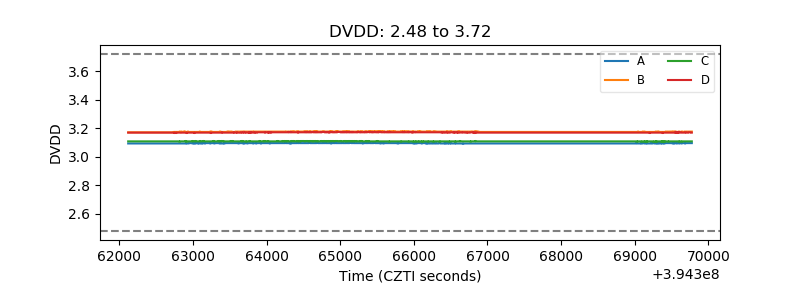 |
| Temperature 1 | 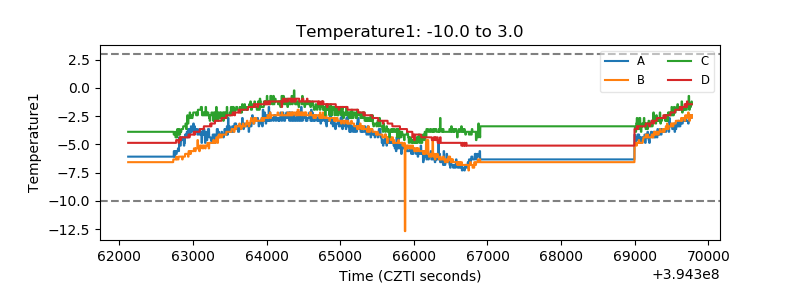 |
| Veto HV Monitor | 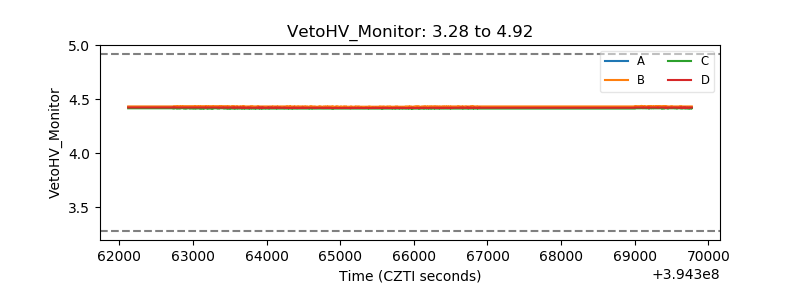 |
| Veto LLD |  |
| Alpha Counter | 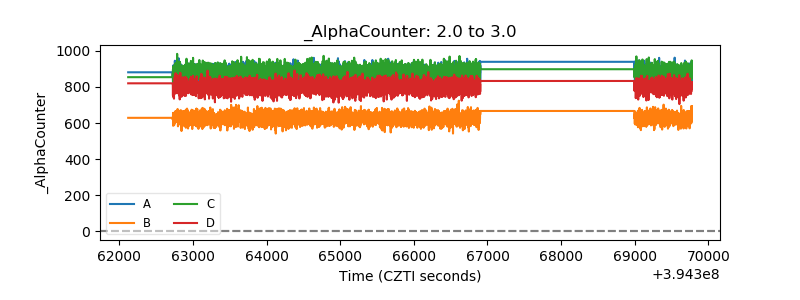 |
| _CPM_Rate | 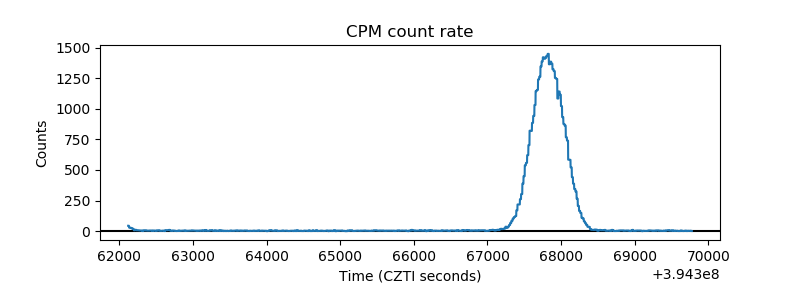 |
| CZT Counter | 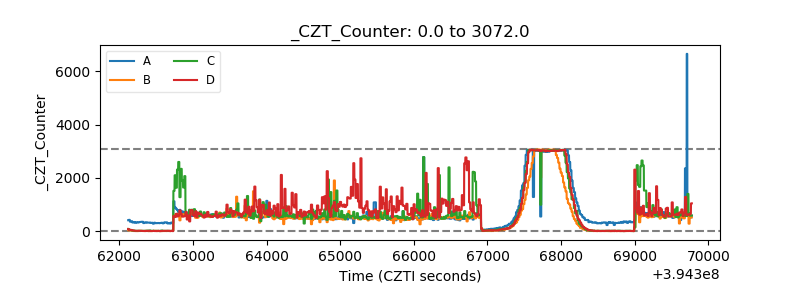 |
| +2.5 Volts monitor |  |
| +5 Volts monitor |  |
| _ROLL_ROT | 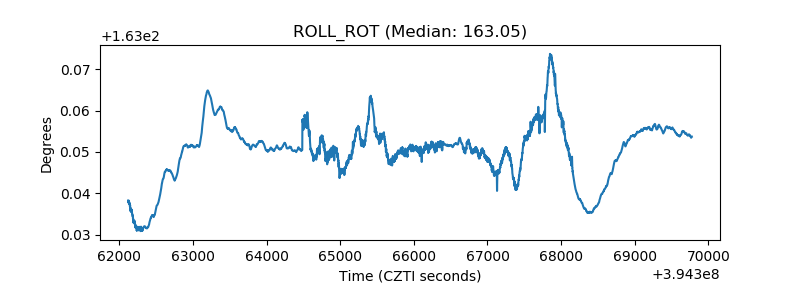 |
| _Roll_DEC | 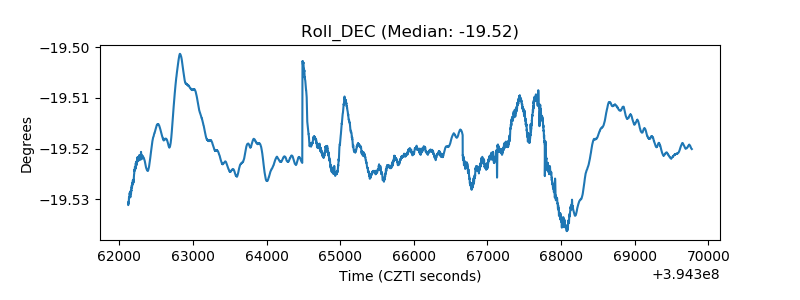 |
| _Roll_RA | 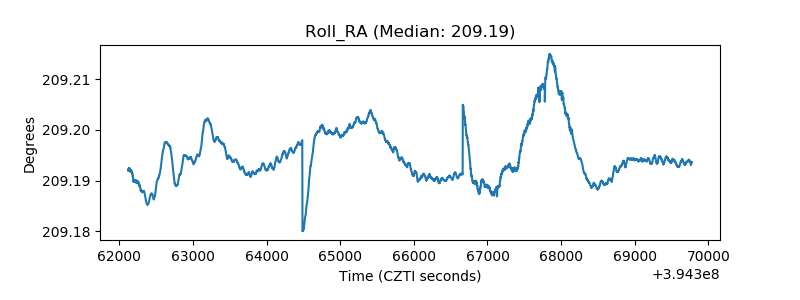 |
| Veto Counter | 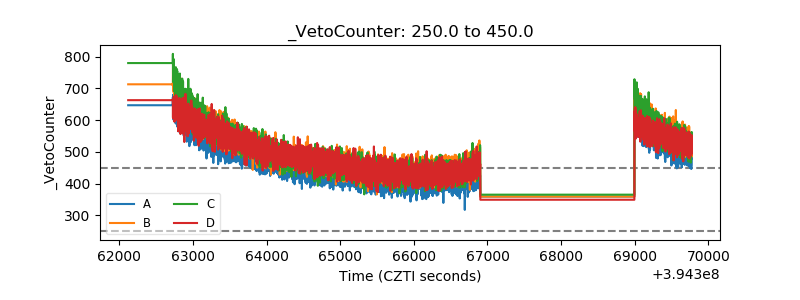 |