| Param | Original file | Final file |
|---|---|---|
| Filename | modeM0/AS1A11_089T02_9000005216_36537cztM0_level2.evt | modeM0/AS1A11_089T02_9000005216_36537cztM0_level2_quad_clean.evt |
| Size (bytes) | 467,737,920 | 92,327,040 |
| Size | 446.1 MB | 88.0 MB |
| Events in quadrant A | 2,650,444 | 647,197 |
| Events in quadrant B | 2,724,725 | 643,925 |
| Events in quadrant C | 4,222,837 | 579,339 |
| Events in quadrant D | 4,237,304 | 583,720 |
| Mode M9 | |||
|---|---|---|---|
| Quadrant | BADHDUFLAG | Total packets | Discarded packets |
| A | 0 | 21 | 0 |
| B | 0 | 21 | 0 |
| C | 0 | 21 | 0 |
| D | 0 | 21 | 0 |
| Mode M0 | |||
|---|---|---|---|
| Quadrant | BADHDUFLAG | Total packets | Discarded packets |
| A | 0 | 10817 | 2 |
| B | 0 | 10967 | 1 |
| C | 0 | 15661 | 1 |
| D | 0 | 16046 | 1 |
| Mode SS | |||
|---|---|---|---|
| Quadrant | BADHDUFLAG | Total packets | Discarded packets |
| A | 0 | 100 | 0 |
| B | 0 | 100 | 0 |
| C | 0 | 100 | 0 |
| D | 0 | 100 | 0 |
| Quadrant | Total seconds | Saturated seconds | Saturation percentage |
|---|---|---|---|
| A | 4867 | 22 | 0.452024% |
| B | 4867 | 36 | 0.739675% |
| C | 4867 | 573 | 11.773166% |
| D | 4867 | 263 | 5.403739% |
Noise dominated data is calculated using 1-second bins in cleaned event files. If a bin has >2000 counts, and if more than 50% of those come from <1% of pixels, then it is considered to be noise-dominated and hence unusable.
| Quadrant | # 1 sec bins | Bins with >0 counts | Bins with >2000 counts | High rate bins dominated by noise | Noise dominated (total time) | Noise dominated (detector-on time) | Marked lightcurve |
|---|---|---|---|---|---|---|---|
| A | 6990 | 4868 | 14 | 14 | 0.20% | 0.29% | 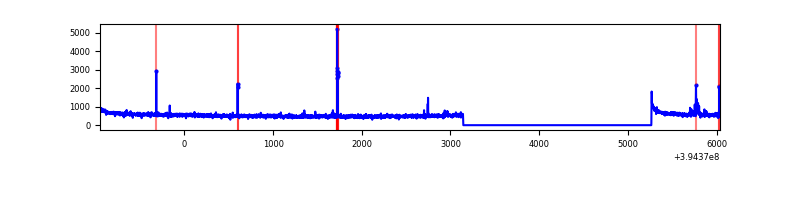 |
| B | 6990 | 4868 | 19 | 19 | 0.27% | 0.39% | 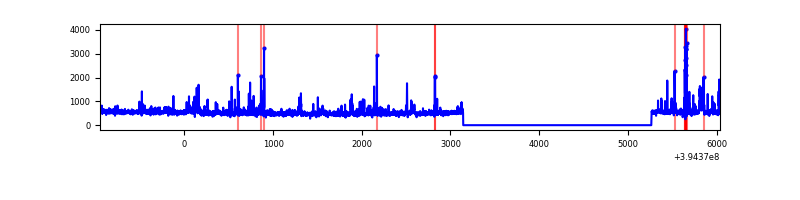 |
| C | 6990 | 4868 | 464 | 464 | 6.64% | 9.53% | 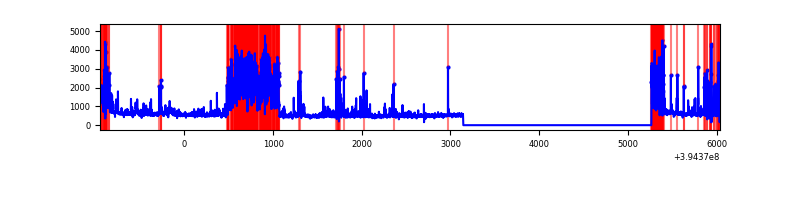 |
| D | 6990 | 4868 | 252 | 252 | 3.61% | 5.18% | 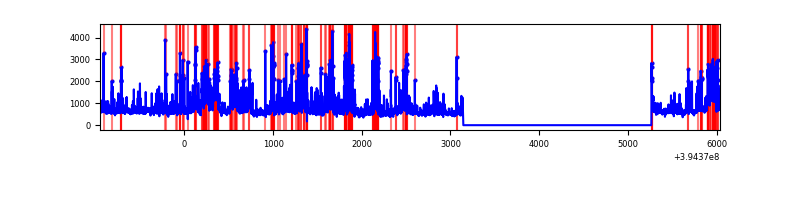 |
Top three noisy pixels from each quadrant. If the there are fewer than three noisy pixels in the level2.evt file, extra rows are filled as -1
| Pixel properties | Quadrant properties | ||||||
|---|---|---|---|---|---|---|---|
| Quadrant | DetID | PixID | Counts | Sigma | Mean | Median | Sigma |
| A | 10 | 83 | 177888 | 1437.55 | 619 | 610 | 123.3 |
| A | 15 | 223 | 76729 | 617.25 | 619 | 610 | 123.3 |
| A | 13 | 254 | 7395 | 55.02 | 619 | 610 | 123.3 |
| B | 5 | 172 | 142335 | 1235.78 | 604 | 590 | 114.7 |
| B | 5 | 255 | 57573 | 496.8 | 604 | 590 | 114.7 |
| B | 0 | 221 | 38518 | 330.67 | 604 | 590 | 114.7 |
| C | 14 | 254 | 1108336 | 8710.18 | 556 | 563 | 127.2 |
| C | 0 | 10 | 536430 | 4213.41 | 556 | 563 | 127.2 |
| C | 15 | 214 | 198477 | 1556.16 | 556 | 563 | 127.2 |
| D | 12 | 235 | 923135 | 6488.32 | 588 | 575 | 142.2 |
| D | 13 | 249 | 328842 | 2308.69 | 588 | 575 | 142.2 |
| D | 2 | 153 | 199821 | 1401.29 | 588 | 575 | 142.2 |
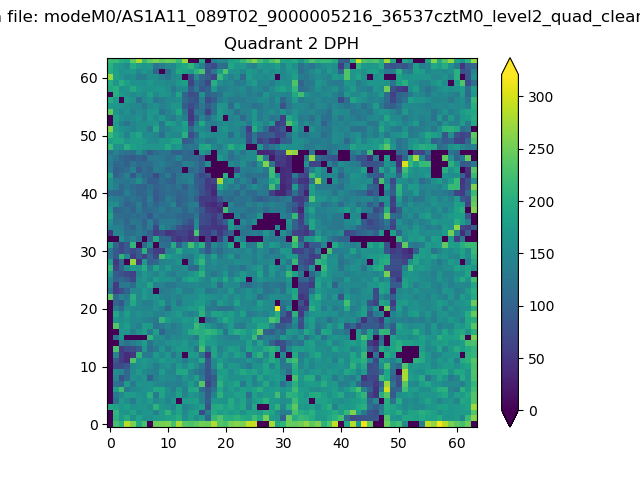
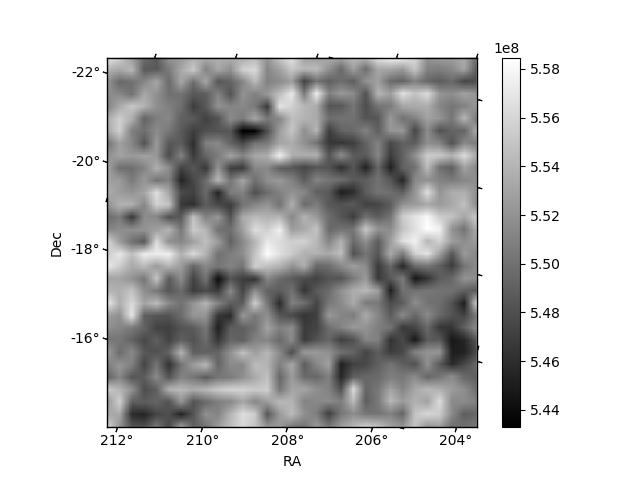
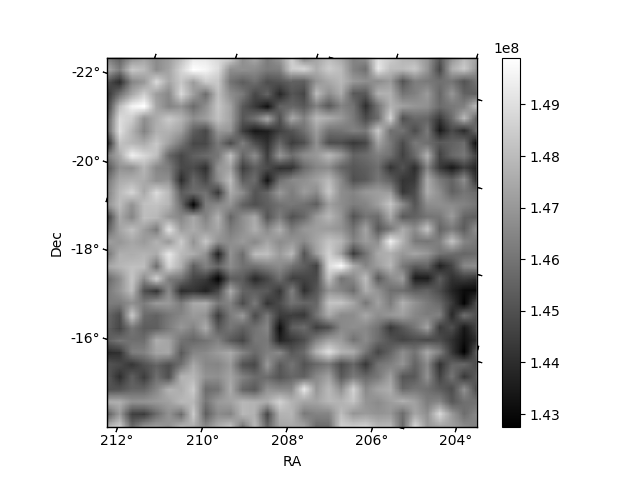
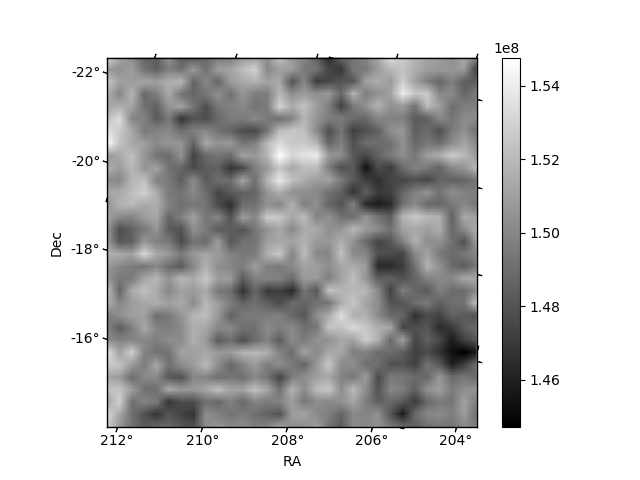
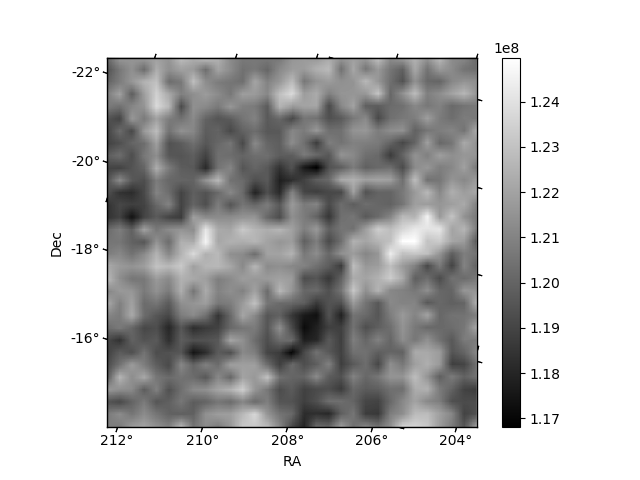
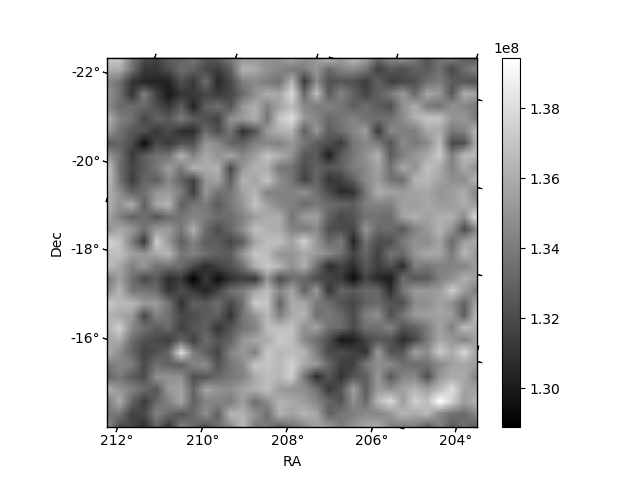
Histogram calculated using DETX and DETY for each event in the final _common_clean file
| Quadrant A | 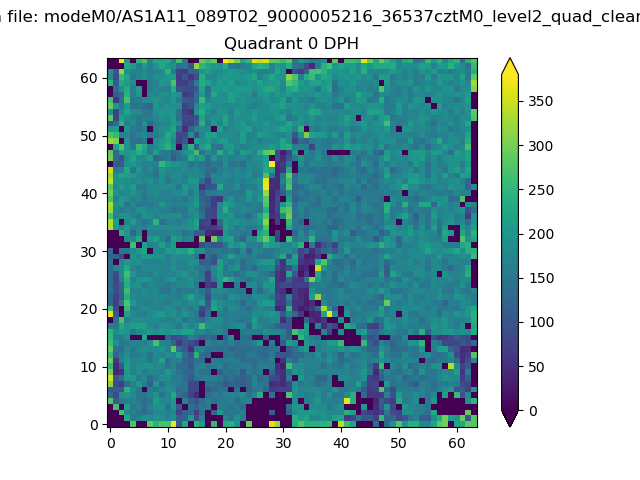 |
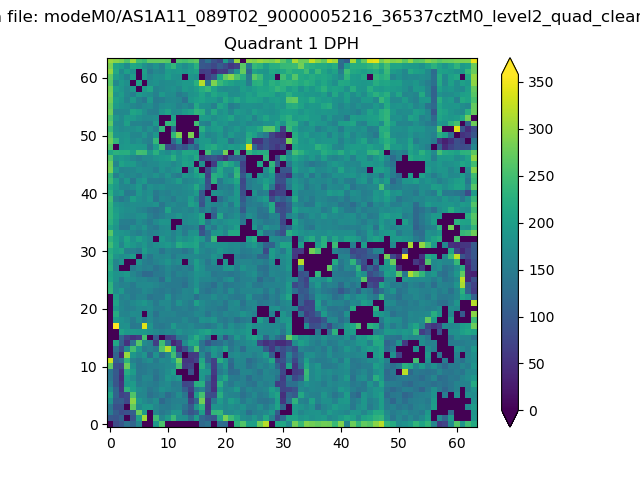 |
Quadrant B |
|---|---|---|---|
| Quadrant D | 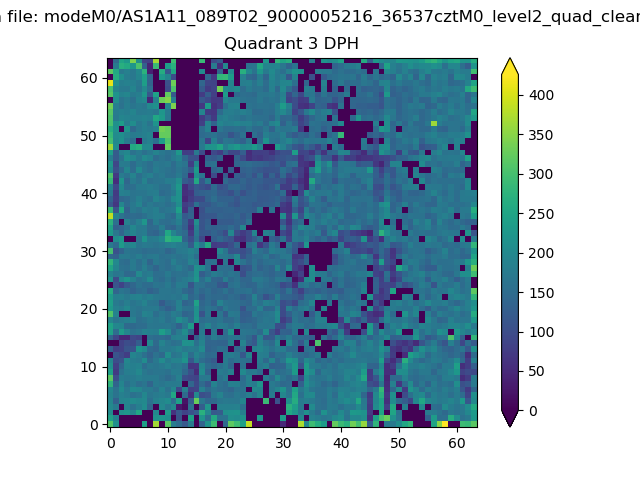 |
 |
Quadrant C |
| Plot type | Count rate plots | Images |
|---|---|---|
| Comparison with Poisson distribution Blue bars denote a histogram of data divided into 1 sec bins. Red curve is a Poisson curve with rate = median count rate of data. |
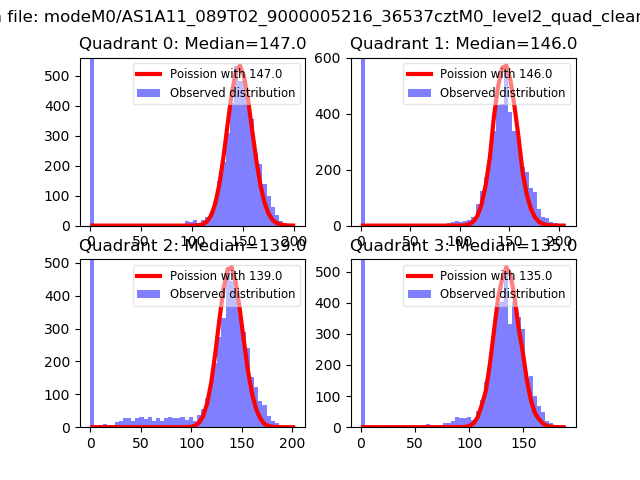 |
 |
| Quadrant-wise count rates Data is divided into 100 sec bins |
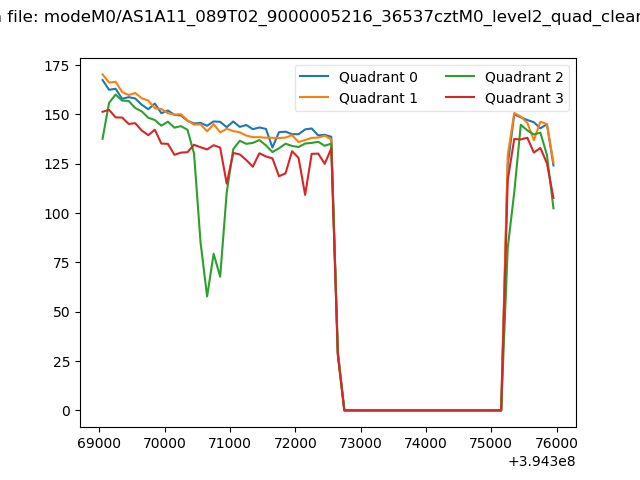 |
|
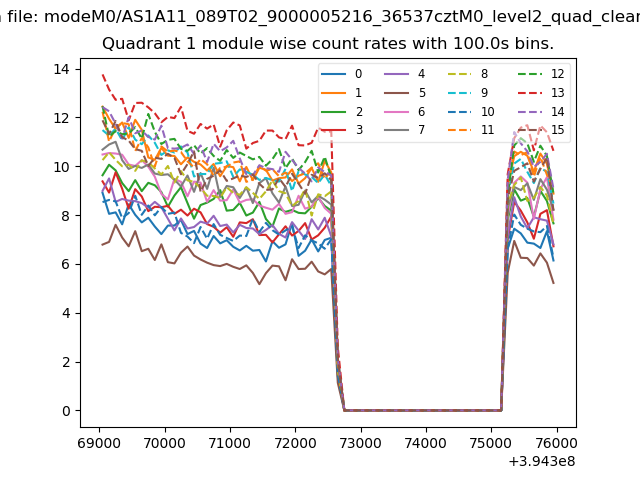
| Module-wise count rates for Quadrant A Data is divided into 100 sec bins |
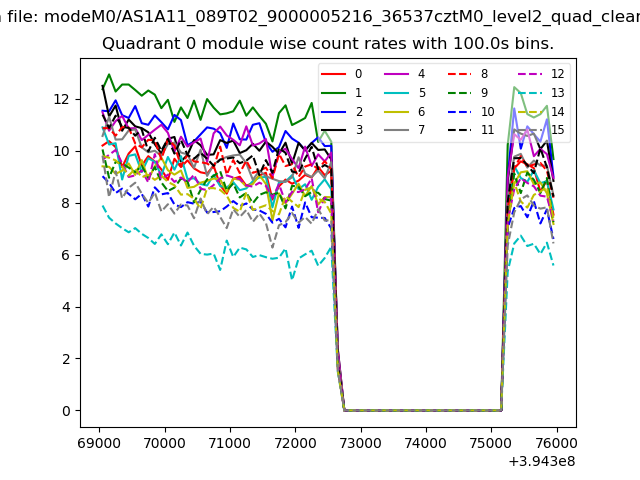 |
 |
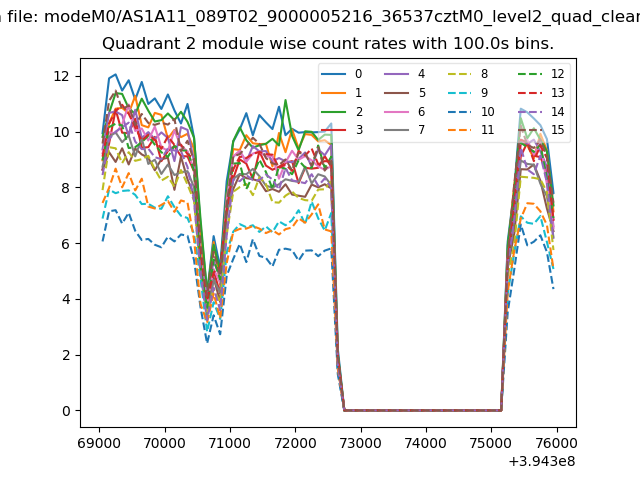
| Module-wise count rates for Quadrant B Data is divided into 100 sec bins |
 |
 |
| Module-wise count rates for Quadrant C Data is divided into 100 sec bins |
 |
 |
| Module-wise count rates for Quadrant D Data is divided into 100 sec bins |
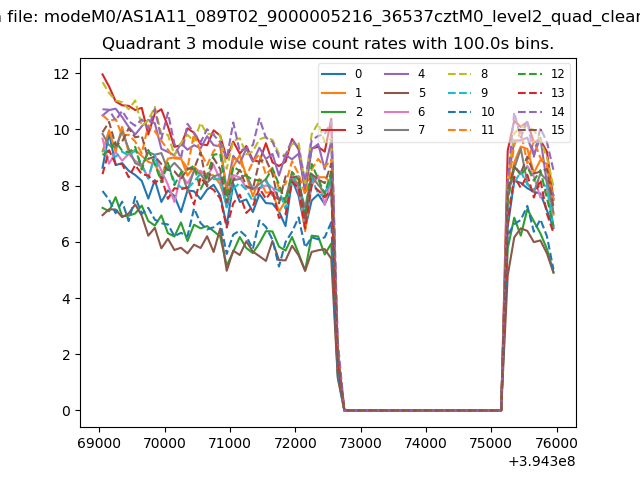 |
 |
| Parameter | Plot |
|---|---|
| CZT HV Monitor | 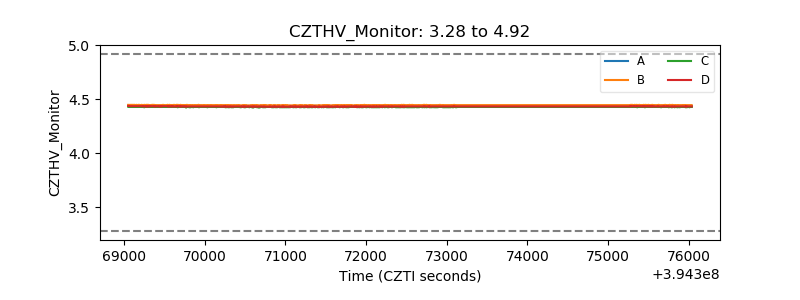 |
| D_VDD | 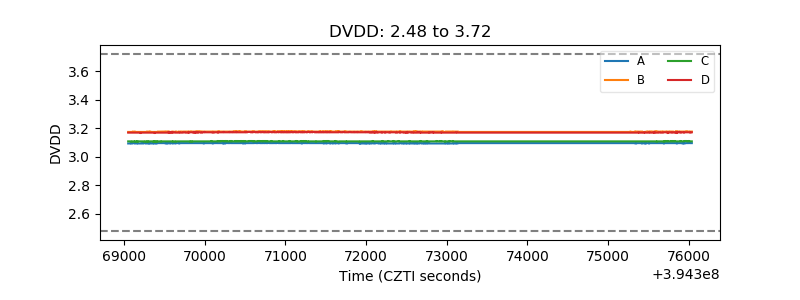 |
| Temperature 1 | 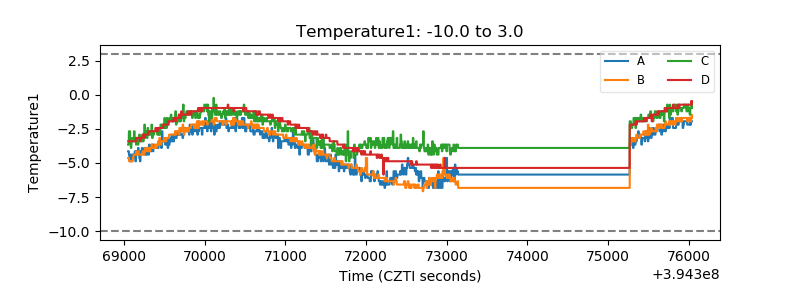 |
| Veto HV Monitor | 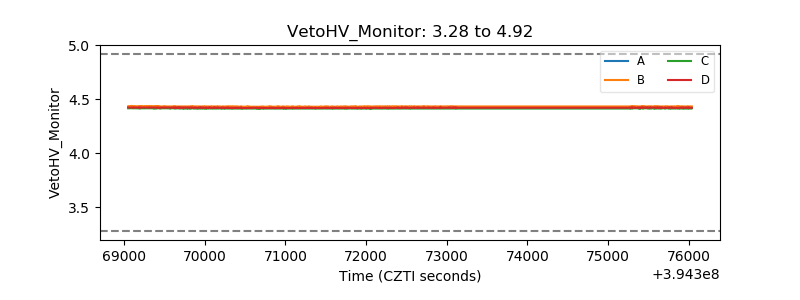 |
| Veto LLD | 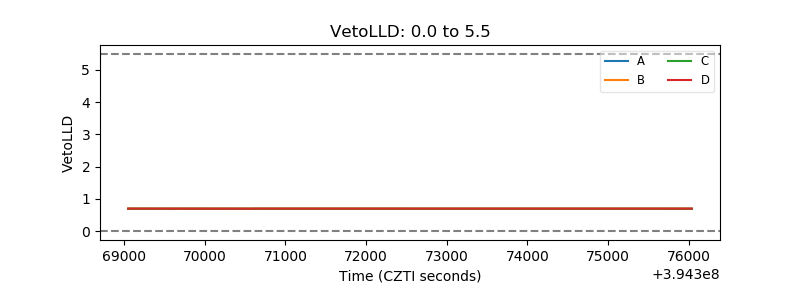 |
| Alpha Counter | 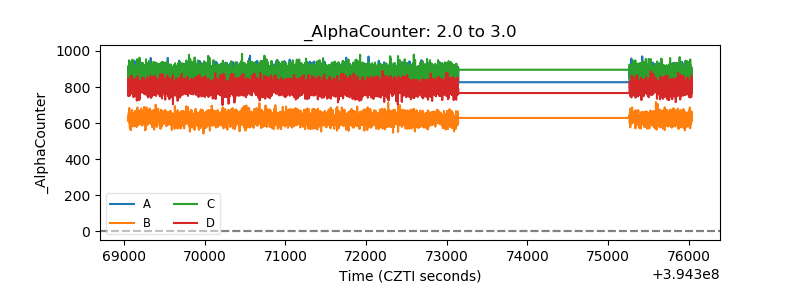 |
| _CPM_Rate | 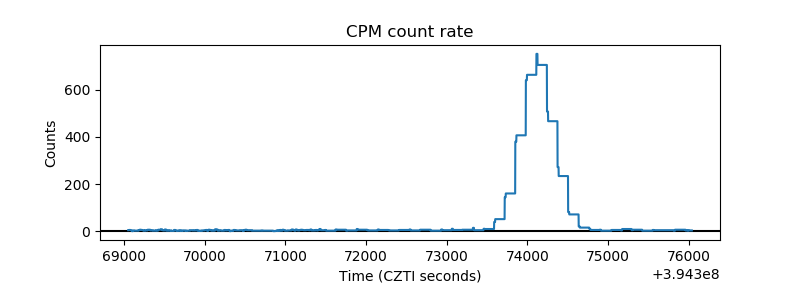 |
| CZT Counter | 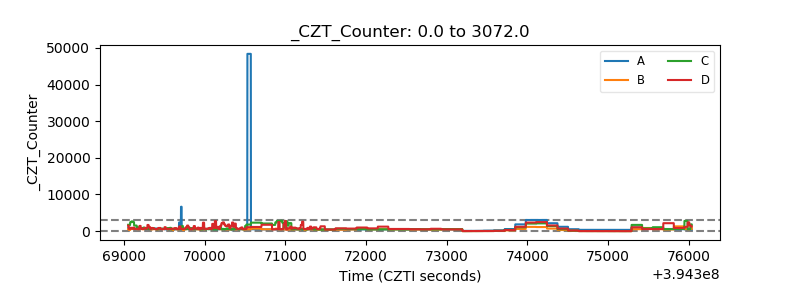 |
| +2.5 Volts monitor |  |
| +5 Volts monitor | 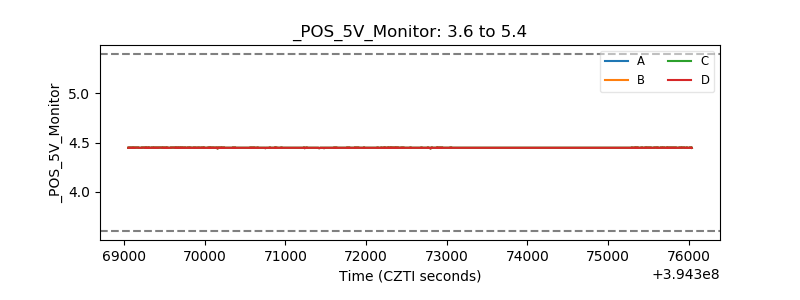 |
| _ROLL_ROT | 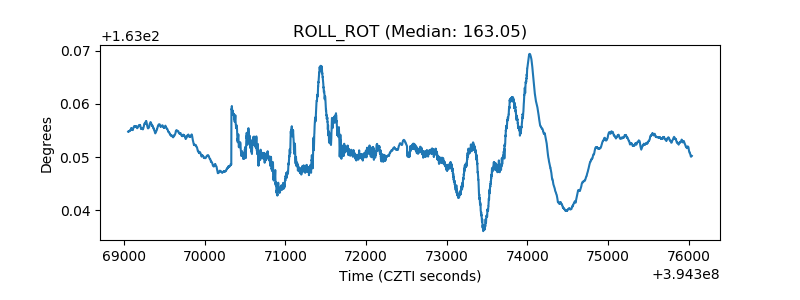 |
| _Roll_DEC | 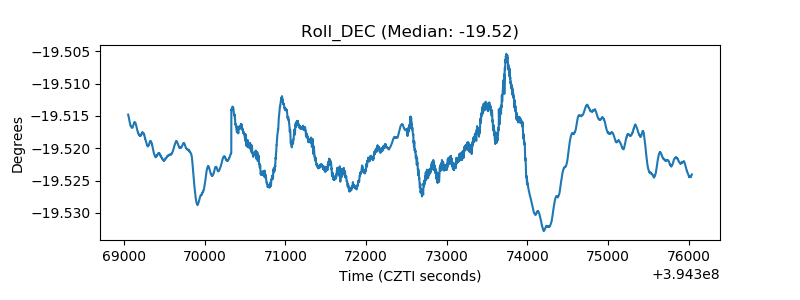 |
| _Roll_RA | 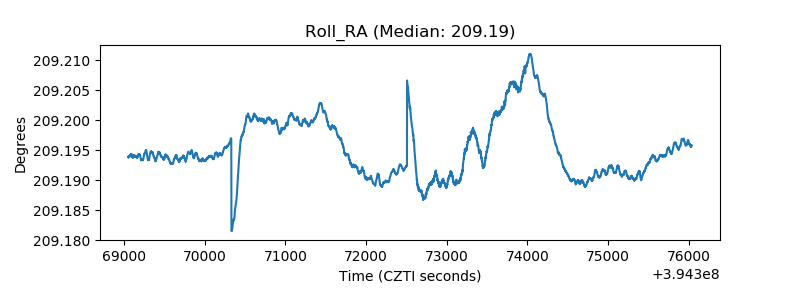 |
| Veto Counter | 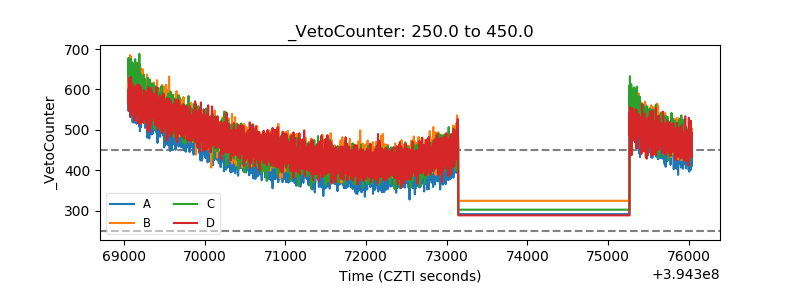 |