| Param | Original file | Final file |
|---|---|---|
| Filename | modeM0/AS1A11_089T02_9000005216_36540cztM0_level2.evt | modeM0/AS1A11_089T02_9000005216_36540cztM0_level2_quad_clean.evt |
| Size (bytes) | 459,959,040 | 67,806,720 |
| Size | 438.7 MB | 64.7 MB |
| Events in quadrant A | 2,968,933 | 431,389 |
| Events in quadrant B | 3,272,546 | 422,301 |
| Events in quadrant C | 3,575,331 | 401,594 |
| Events in quadrant D | 3,730,100 | 403,078 |
| Mode M9 | |||
|---|---|---|---|
| Quadrant | BADHDUFLAG | Total packets | Discarded packets |
| A | 0 | 22 | 0 |
| B | 0 | 22 | 0 |
| C | 0 | 22 | 0 |
| D | 0 | 23 | 0 |
| Mode M0 | |||
|---|---|---|---|
| Quadrant | BADHDUFLAG | Total packets | Discarded packets |
| A | 0 | 12452 | 3 |
| B | 0 | 13378 | 2 |
| C | 0 | 14102 | 2 |
| D | 0 | 14761 | 2 |
| Mode SS | |||
|---|---|---|---|
| Quadrant | BADHDUFLAG | Total packets | Discarded packets |
| A | 0 | 116 | 0 |
| B | 0 | 116 | 0 |
| C | 0 | 116 | 0 |
| D | 0 | 116 | 0 |
| Quadrant | Total seconds | Saturated seconds | Saturation percentage |
|---|---|---|---|
| A | 5640 | 58 | 1.028369% |
| B | 5640 | 88 | 1.560284% |
| C | 5640 | 232 | 4.113475% |
| D | 5640 | 106 | 1.879433% |
Noise dominated data is calculated using 1-second bins in cleaned event files. If a bin has >2000 counts, and if more than 50% of those come from <1% of pixels, then it is considered to be noise-dominated and hence unusable.
| Quadrant | # 1 sec bins | Bins with >0 counts | Bins with >2000 counts | High rate bins dominated by noise | Noise dominated (total time) | Noise dominated (detector-on time) | Marked lightcurve |
|---|---|---|---|---|---|---|---|
| A | 7133 | 5641 | 41 | 41 | 0.57% | 0.73% | 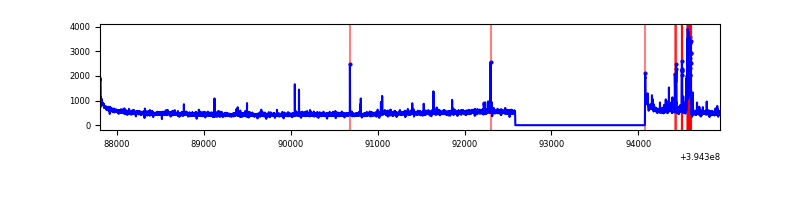 |
| B | 7133 | 5641 | 45 | 45 | 0.63% | 0.80% | 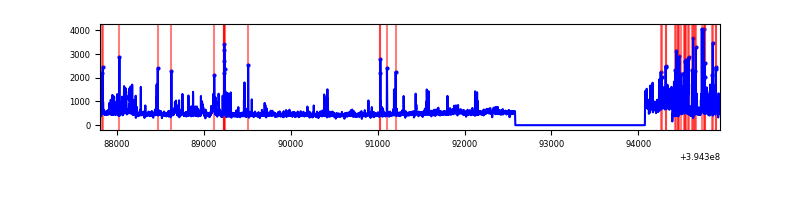 |
| C | 7133 | 5641 | 167 | 167 | 2.34% | 2.96% | 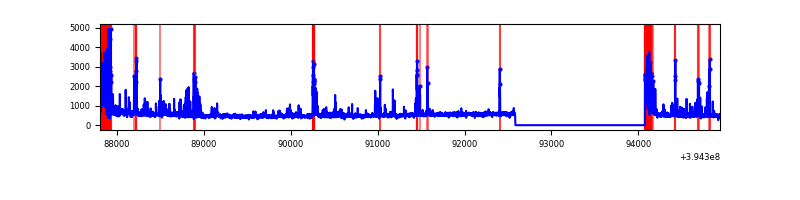 |
| D | 7133 | 5641 | 97 | 97 | 1.36% | 1.72% | 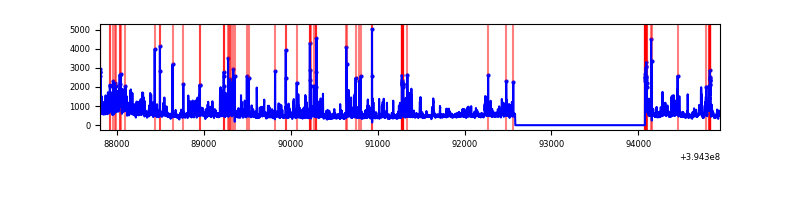 |
Top three noisy pixels from each quadrant. If the there are fewer than three noisy pixels in the level2.evt file, extra rows are filled as -1
| Pixel properties | Quadrant properties | ||||||
|---|---|---|---|---|---|---|---|
| Quadrant | DetID | PixID | Counts | Sigma | Mean | Median | Sigma |
| A | 15 | 223 | 232877 | 1789.54 | 646 | 633 | 129.8 |
| A | 10 | 83 | 215932 | 1658.97 | 646 | 633 | 129.8 |
| A | 13 | 254 | 9361 | 67.25 | 646 | 633 | 129.8 |
| B | 5 | 255 | 235598 | 1901.85 | 639 | 621 | 123.6 |
| B | 0 | 219 | 187964 | 1516.31 | 639 | 621 | 123.6 |
| B | 5 | 172 | 132795 | 1069.79 | 639 | 621 | 123.6 |
| C | 0 | 10 | 567624 | 3983.01 | 607 | 610 | 142.4 |
| C | 14 | 254 | 323451 | 2267.81 | 607 | 610 | 142.4 |
| C | 15 | 214 | 250399 | 1754.65 | 607 | 610 | 142.4 |
| D | 12 | 235 | 564567 | 3662.8 | 623 | 604 | 154.0 |
| D | 2 | 250 | 272996 | 1769.12 | 623 | 604 | 154.0 |
| D | 2 | 153 | 160949 | 1041.4 | 623 | 604 | 154.0 |
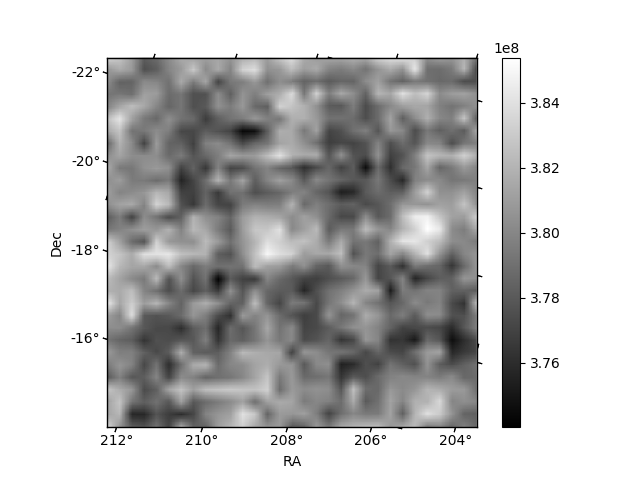
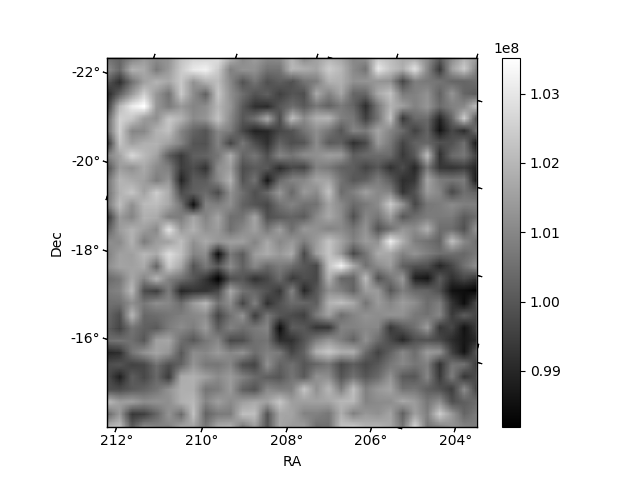
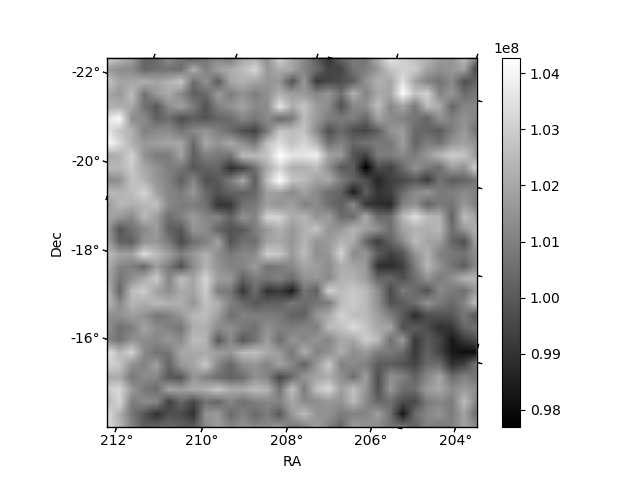
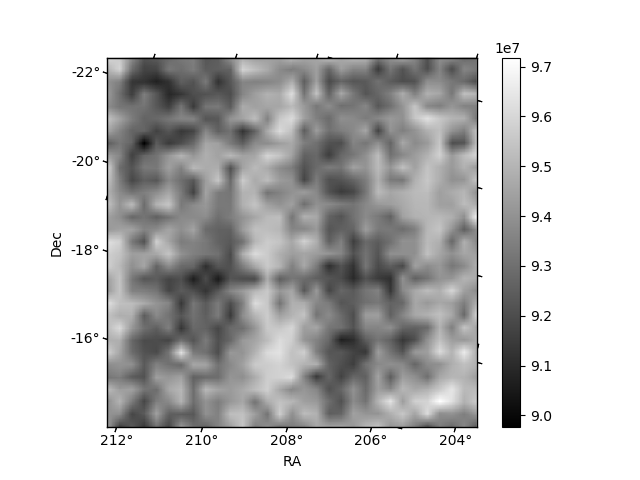
Histogram calculated using DETX and DETY for each event in the final _common_clean file
| Quadrant A | 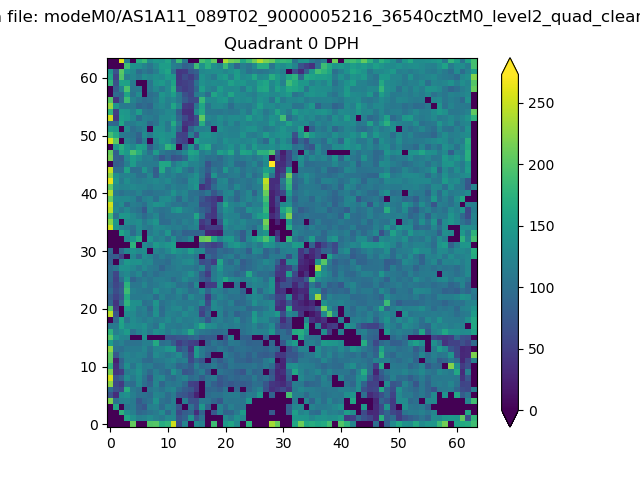 |
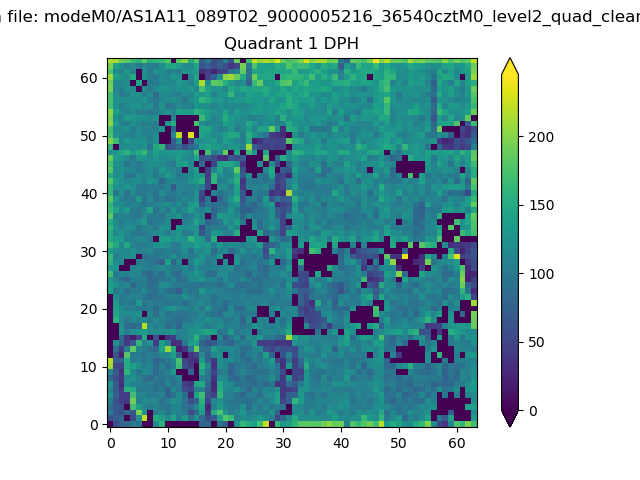 |
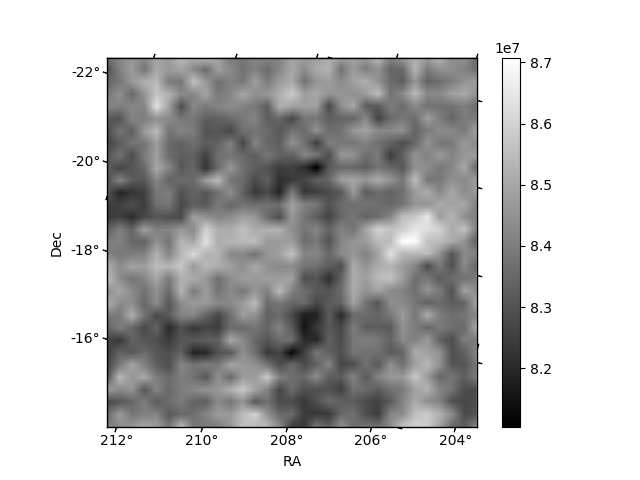
Quadrant B |
|---|---|---|---|
| Quadrant D | 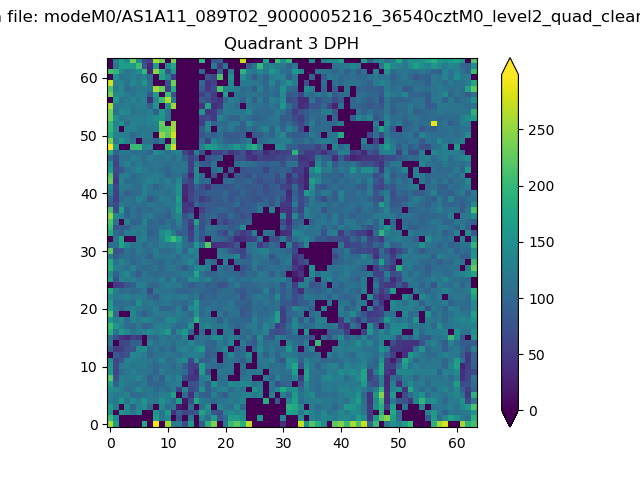 |
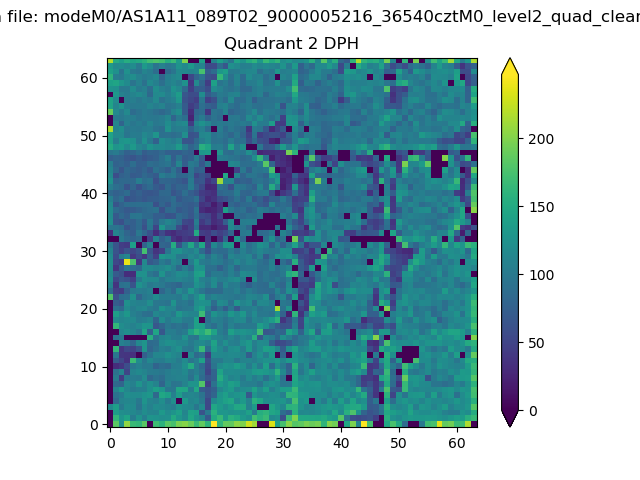 |
Quadrant C |
| Plot type | Count rate plots | Images |
|---|---|---|
| Comparison with Poisson distribution Blue bars denote a histogram of data divided into 1 sec bins. Red curve is a Poisson curve with rate = median count rate of data. |
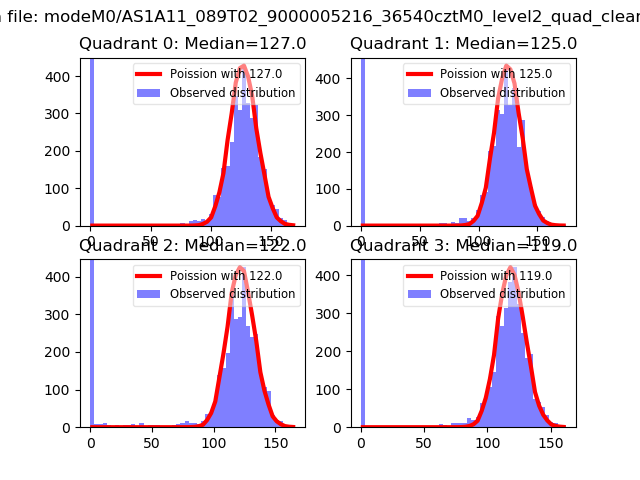 |
 |
| Quadrant-wise count rates Data is divided into 100 sec bins |
 |
|
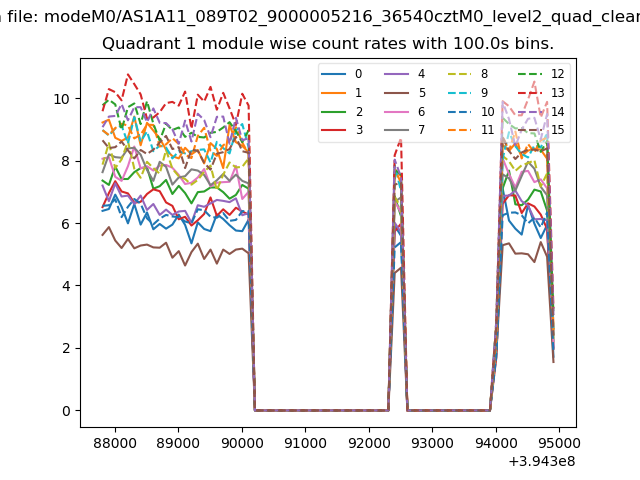
| Module-wise count rates for Quadrant A Data is divided into 100 sec bins |
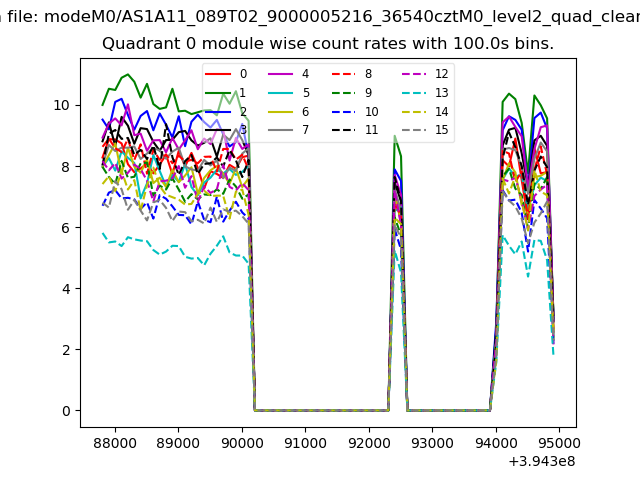 |
 |
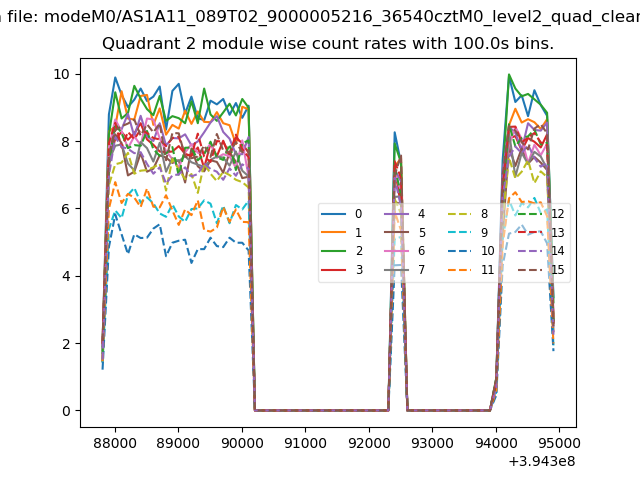
| Module-wise count rates for Quadrant B Data is divided into 100 sec bins |
 |
 |
| Module-wise count rates for Quadrant C Data is divided into 100 sec bins |
 |
 |
| Module-wise count rates for Quadrant D Data is divided into 100 sec bins |
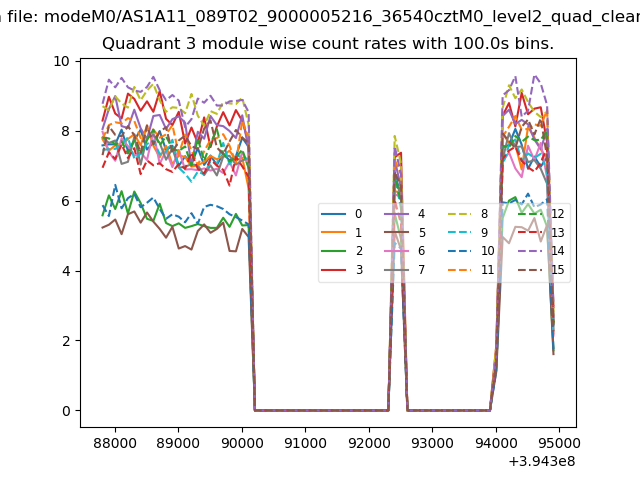 |
 |
| Parameter | Plot |
|---|---|
| CZT HV Monitor | 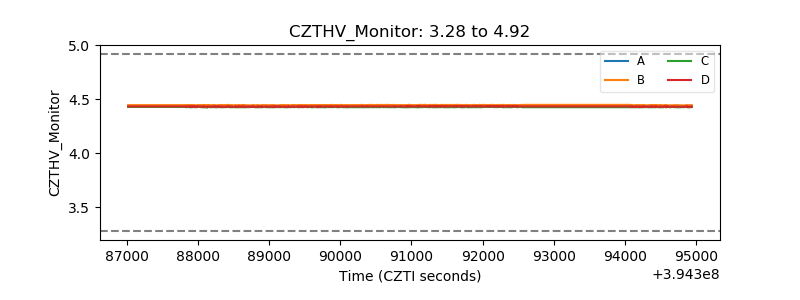 |
| D_VDD | 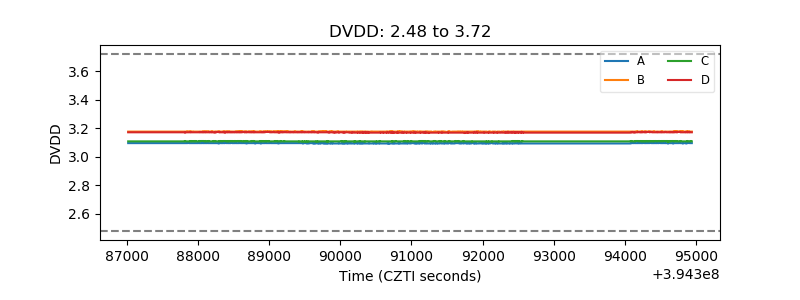 |
| Temperature 1 | 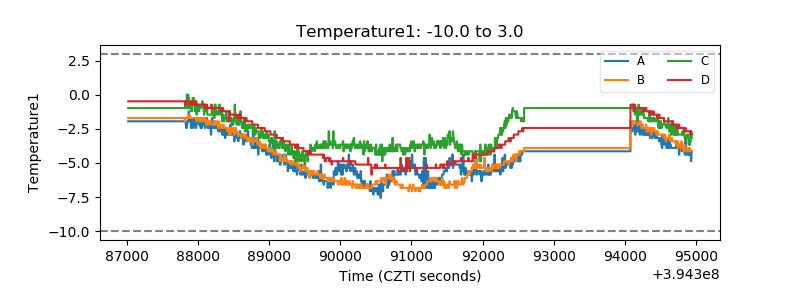 |
| Veto HV Monitor | 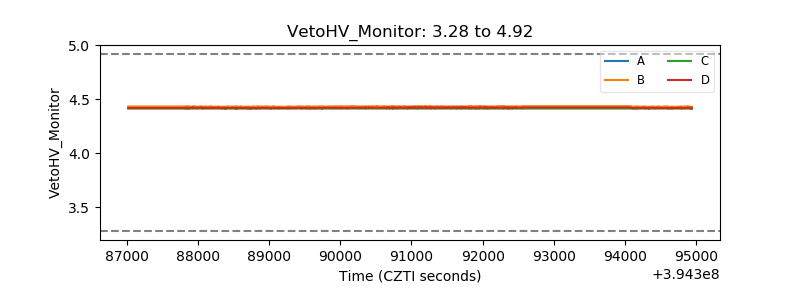 |
| Veto LLD | 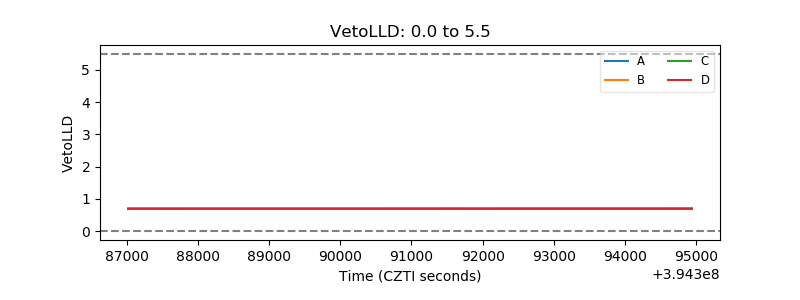 |
| Alpha Counter | 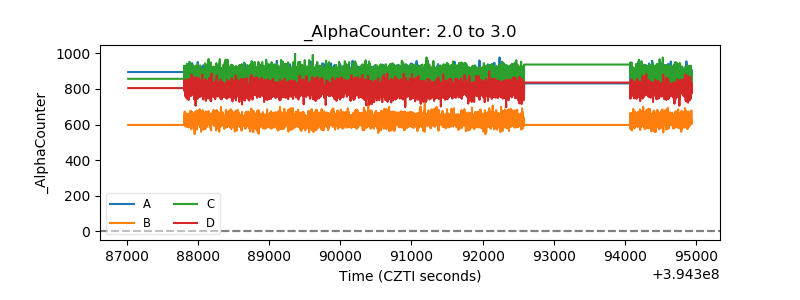 |
| _CPM_Rate | 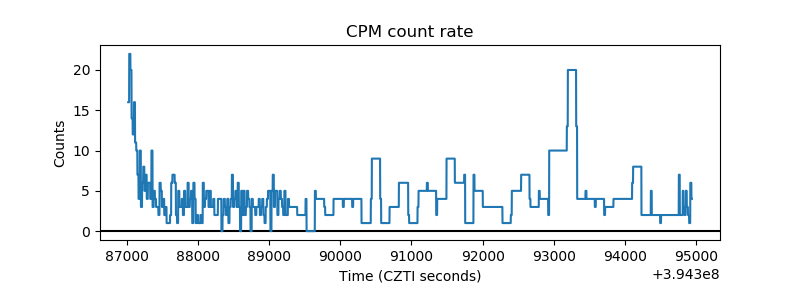 |
| CZT Counter | 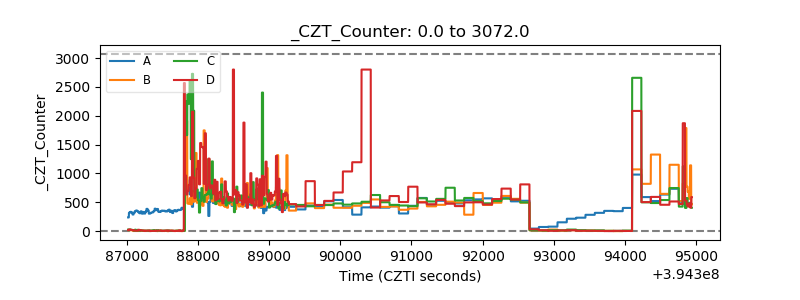 |
| +2.5 Volts monitor |  |
| +5 Volts monitor |  |
| _ROLL_ROT | 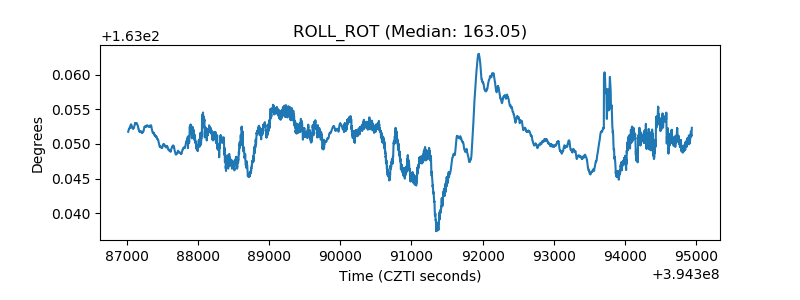 |
| _Roll_DEC | 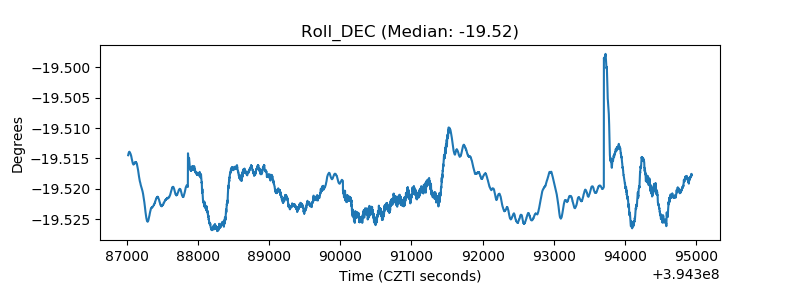 |
| _Roll_RA | 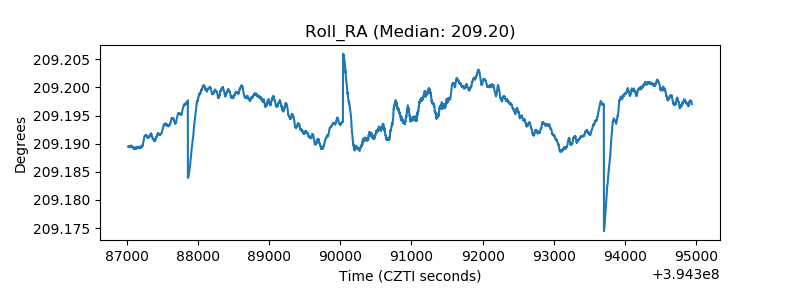 |
| Veto Counter | 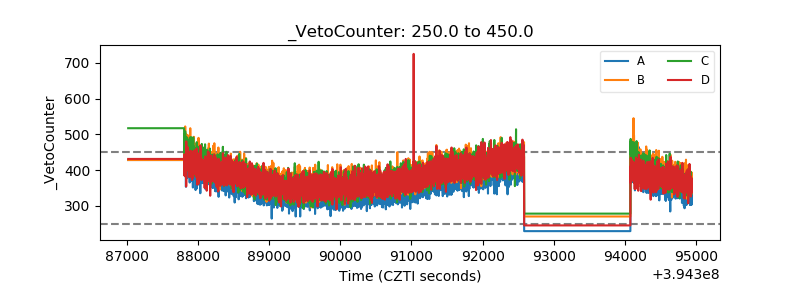 |