| Param | Original file | Final file |
|---|---|---|
| Filename | modeM0/AS1A11_089T02_9000005216_36541cztM0_level2.evt | modeM0/AS1A11_089T02_9000005216_36541cztM0_level2_quad_clean.evt |
| Size (bytes) | 499,440,960 | 72,872,640 |
| Size | 476.3 MB | 69.5 MB |
| Events in quadrant A | 3,364,149 | 462,824 |
| Events in quadrant B | 3,735,823 | 448,381 |
| Events in quadrant C | 3,497,373 | 445,677 |
| Events in quadrant D | 4,125,386 | 434,604 |
| Mode M9 | |||
|---|---|---|---|
| Quadrant | BADHDUFLAG | Total packets | Discarded packets |
| A | 0 | 22 | 0 |
| B | 0 | 22 | 0 |
| C | 0 | 22 | 0 |
| D | 0 | 23 | 0 |
| Mode M0 | |||
|---|---|---|---|
| Quadrant | BADHDUFLAG | Total packets | Discarded packets |
| A | 0 | 13828 | 3 |
| B | 0 | 14836 | 2 |
| C | 0 | 14018 | 2 |
| D | 0 | 16216 | 2 |
| Mode SS | |||
|---|---|---|---|
| Quadrant | BADHDUFLAG | Total packets | Discarded packets |
| A | 0 | 122 | 0 |
| B | 0 | 122 | 0 |
| C | 0 | 122 | 0 |
| D | 0 | 122 | 0 |
| Quadrant | Total seconds | Saturated seconds | Saturation percentage |
|---|---|---|---|
| A | 5935 | 86 | 1.449031% |
| B | 5935 | 241 | 4.060657% |
| C | 5935 | 154 | 2.594777% |
| D | 5935 | 164 | 2.763269% |
Noise dominated data is calculated using 1-second bins in cleaned event files. If a bin has >2000 counts, and if more than 50% of those come from <1% of pixels, then it is considered to be noise-dominated and hence unusable.
| Quadrant | # 1 sec bins | Bins with >0 counts | Bins with >2000 counts | High rate bins dominated by noise | Noise dominated (total time) | Noise dominated (detector-on time) | Marked lightcurve |
|---|---|---|---|---|---|---|---|
| A | 7247 | 5936 | 52 | 52 | 0.72% | 0.88% | 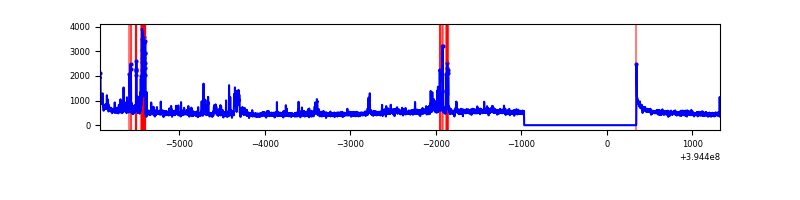 |
| B | 7247 | 5936 | 101 | 101 | 1.39% | 1.70% | 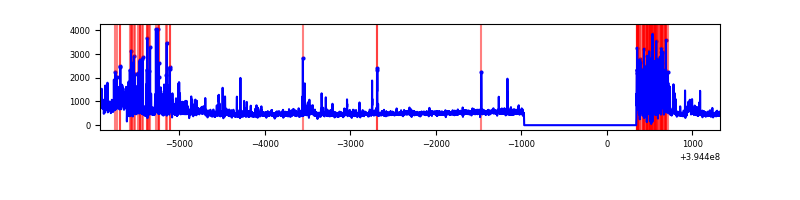 |
| C | 7247 | 5936 | 119 | 119 | 1.64% | 2.00% | 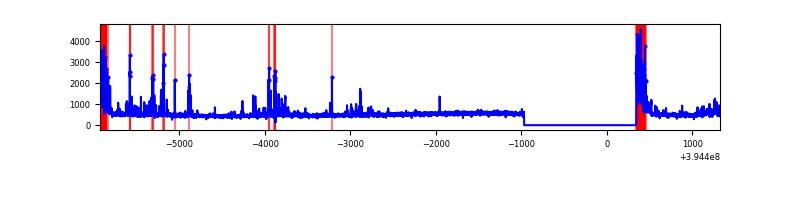 |
| D | 7247 | 5936 | 146 | 146 | 2.01% | 2.46% | 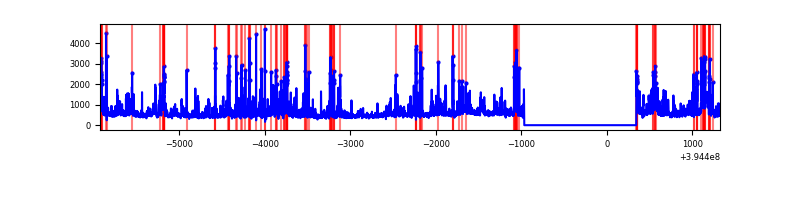 |
Top three noisy pixels from each quadrant. If the there are fewer than three noisy pixels in the level2.evt file, extra rows are filled as -1
| Pixel properties | Quadrant properties | ||||||
|---|---|---|---|---|---|---|---|
| Quadrant | DetID | PixID | Counts | Sigma | Mean | Median | Sigma |
| A | 15 | 223 | 517152 | 3800.19 | 675 | 664 | 135.9 |
| A | 10 | 83 | 217439 | 1594.98 | 675 | 664 | 135.9 |
| A | 13 | 254 | 9170 | 62.59 | 675 | 664 | 135.9 |
| B | 0 | 219 | 497982 | 3887.77 | 662 | 645 | 127.9 |
| B | 5 | 255 | 218987 | 1706.82 | 662 | 645 | 127.9 |
| B | 0 | 189 | 103450 | 803.64 | 662 | 645 | 127.9 |
| C | 0 | 10 | 484696 | 3173.03 | 646 | 650 | 152.6 |
| C | 15 | 214 | 253043 | 1654.49 | 646 | 650 | 152.6 |
| C | 14 | 254 | 158356 | 1033.8 | 646 | 650 | 152.6 |
| D | 12 | 235 | 749964 | 4742.65 | 649 | 632 | 158.0 |
| D | 13 | 249 | 235990 | 1489.62 | 649 | 632 | 158.0 |
| D | 2 | 137 | 133075 | 838.25 | 649 | 632 | 158.0 |
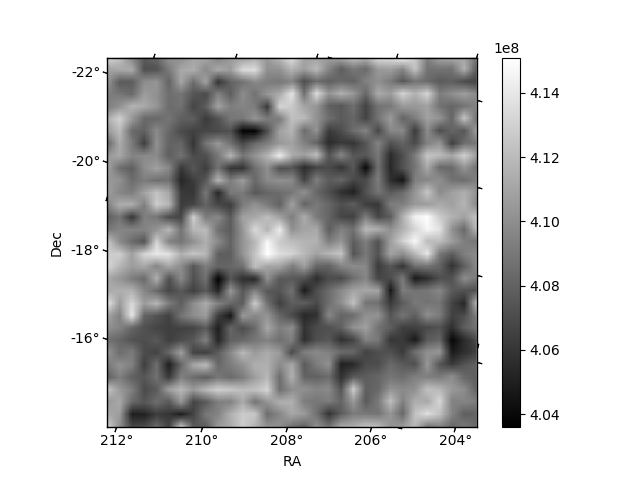
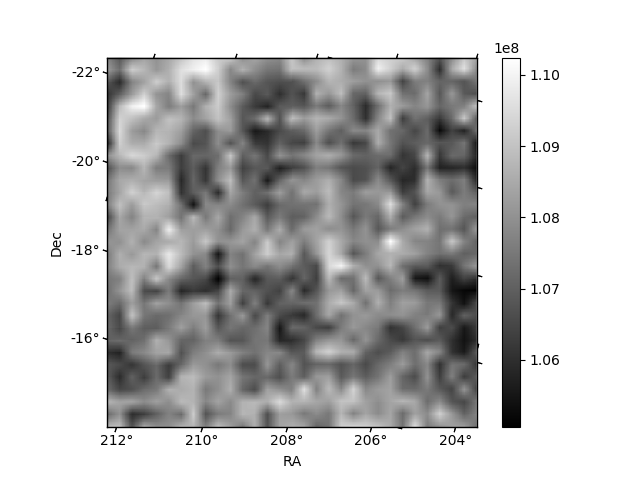
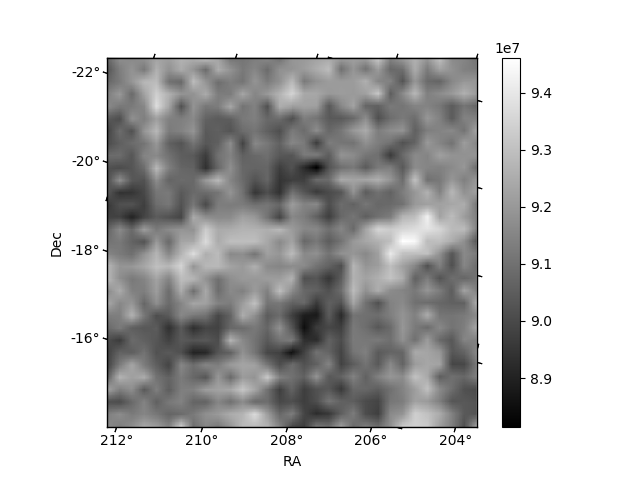
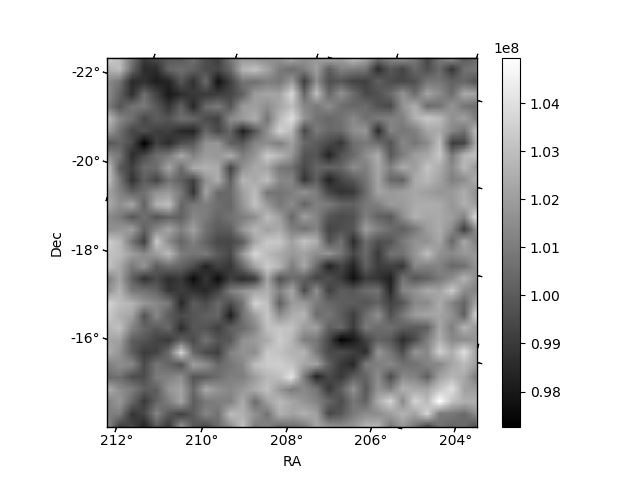
Histogram calculated using DETX and DETY for each event in the final _common_clean file
| Quadrant A |  |
 |
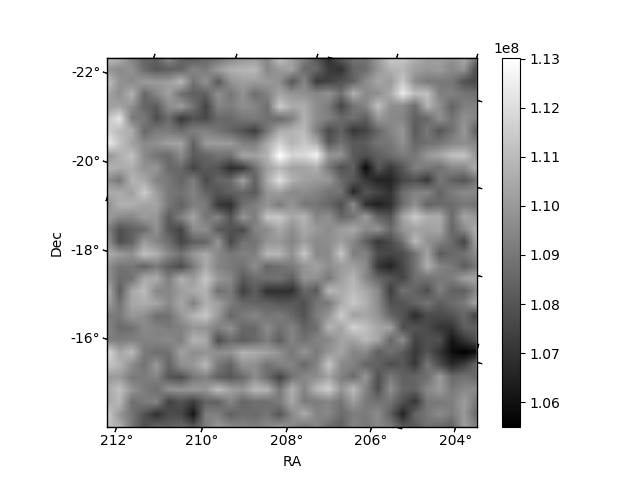
Quadrant B |
|---|---|---|---|
| Quadrant D |  |
 |
Quadrant C |
| Plot type | Count rate plots | Images |
|---|---|---|
| Comparison with Poisson distribution Blue bars denote a histogram of data divided into 1 sec bins. Red curve is a Poisson curve with rate = median count rate of data. |
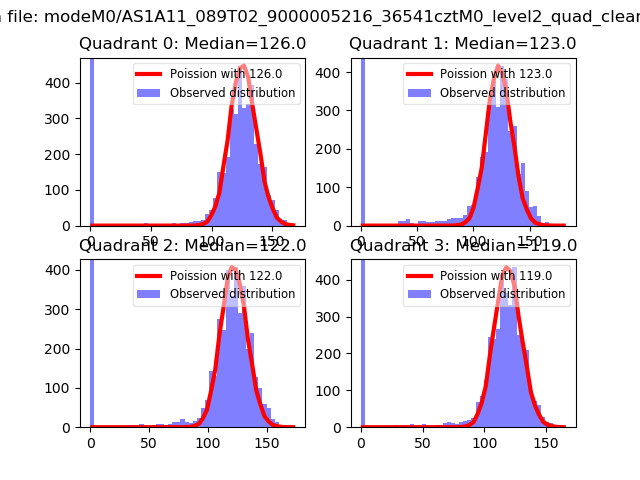 |
 |
| Quadrant-wise count rates Data is divided into 100 sec bins |
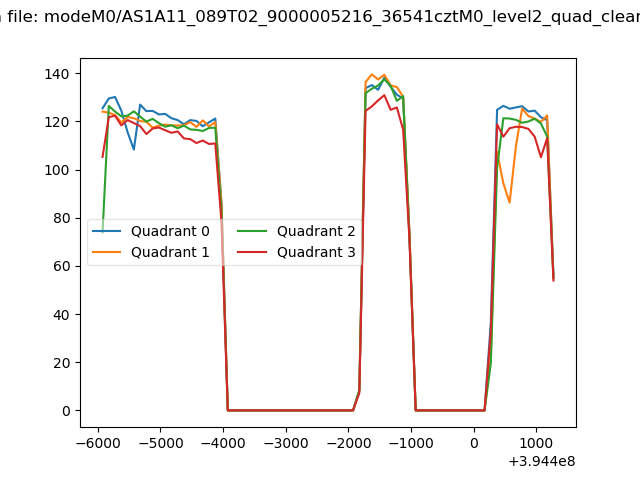 |
|
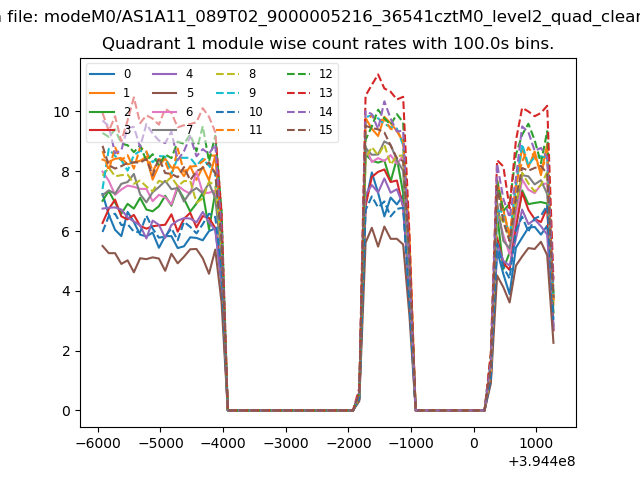
| Module-wise count rates for Quadrant A Data is divided into 100 sec bins |
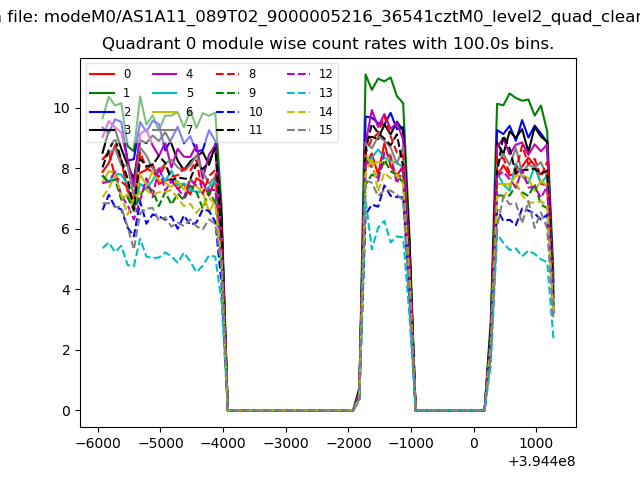 |
 |
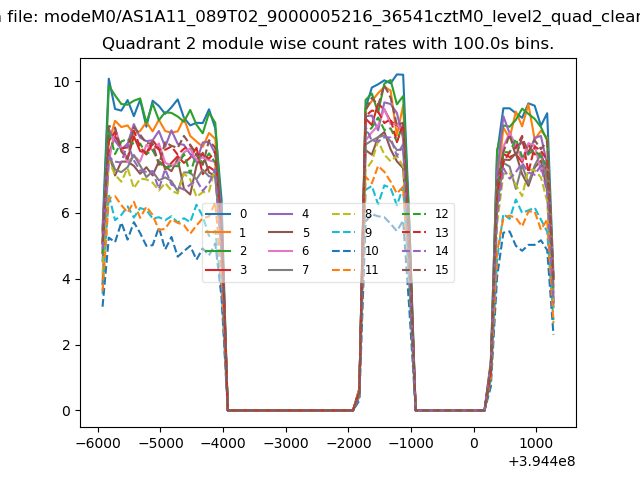
| Module-wise count rates for Quadrant B Data is divided into 100 sec bins |
 |
 |
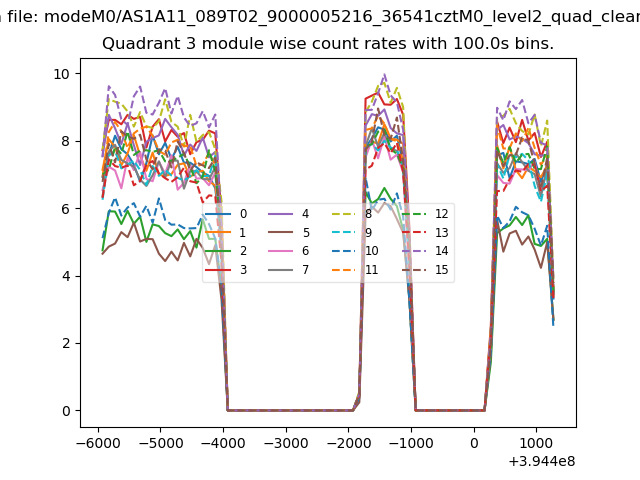
| Module-wise count rates for Quadrant C Data is divided into 100 sec bins |
 |
 |
| Module-wise count rates for Quadrant D Data is divided into 100 sec bins |
 |
 |
| Parameter | Plot |
|---|---|
| CZT HV Monitor | 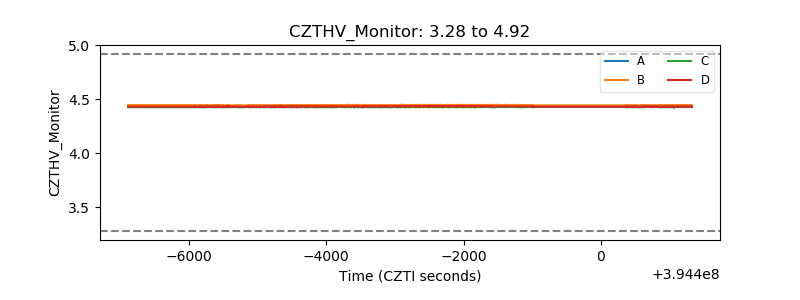 |
| D_VDD | 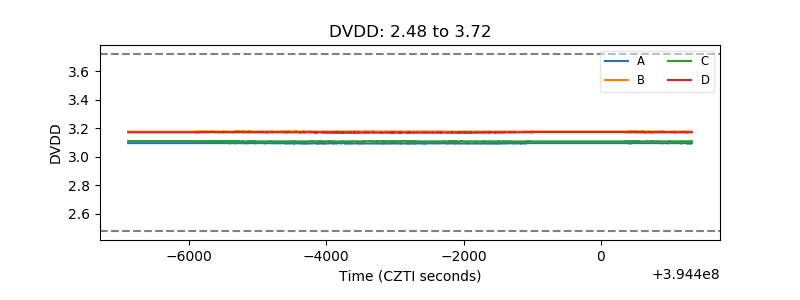 |
| Temperature 1 | 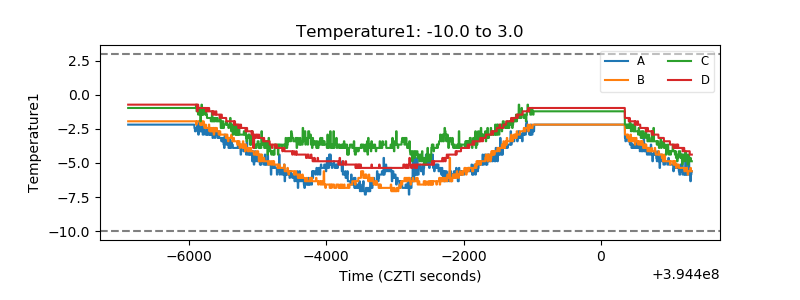 |
| Veto HV Monitor |  |
| Veto LLD | 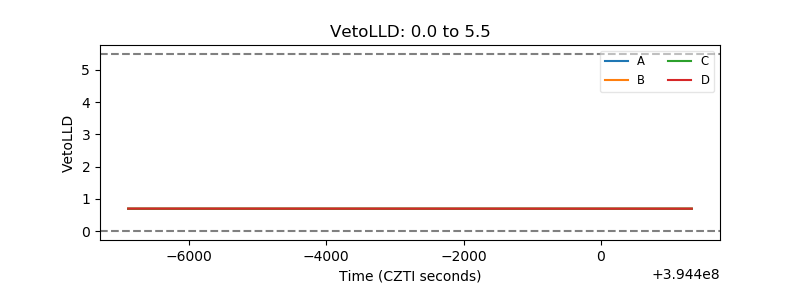 |
| Alpha Counter | 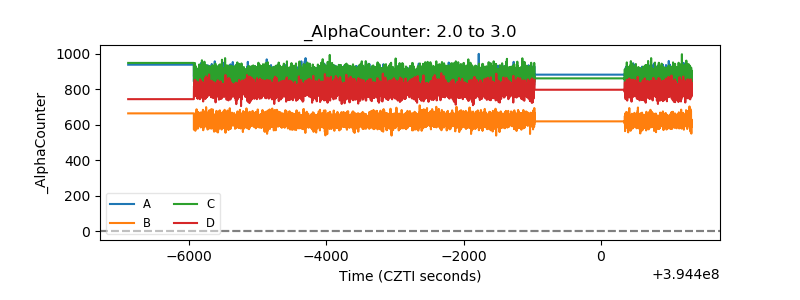 |
| _CPM_Rate | 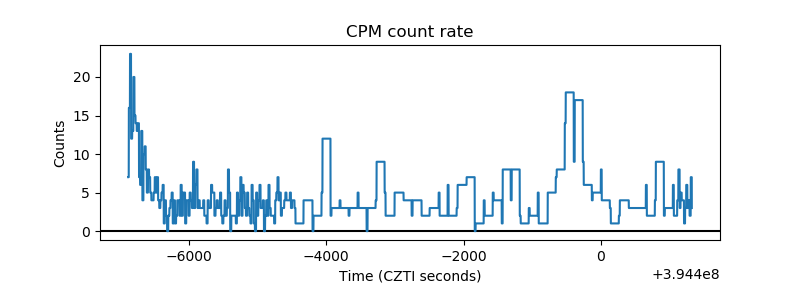 |
| CZT Counter |  |
| +2.5 Volts monitor |  |
| +5 Volts monitor | 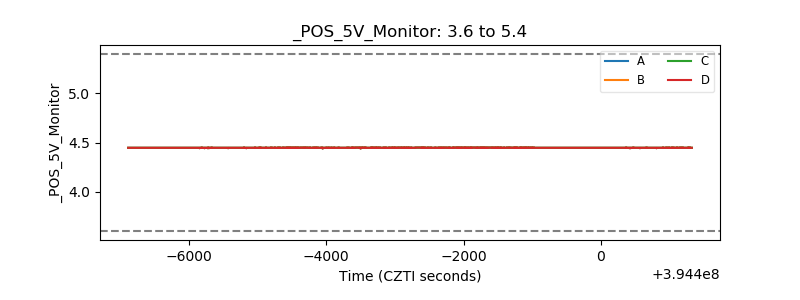 |
| _ROLL_ROT | 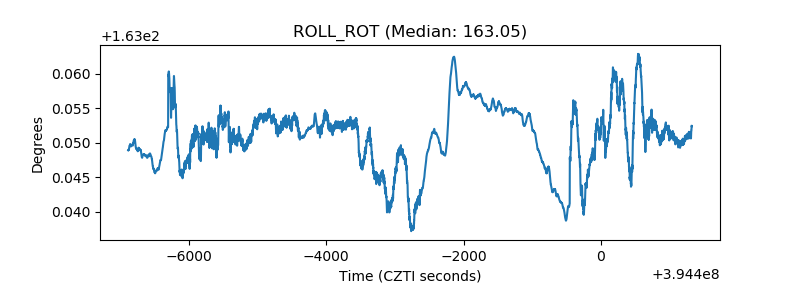 |
| _Roll_DEC |  |
| _Roll_RA | 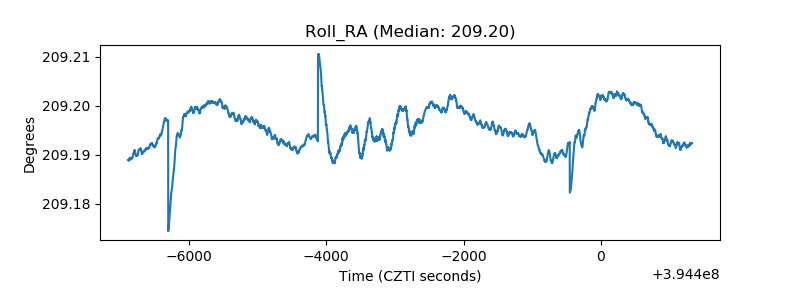 |
| Veto Counter | 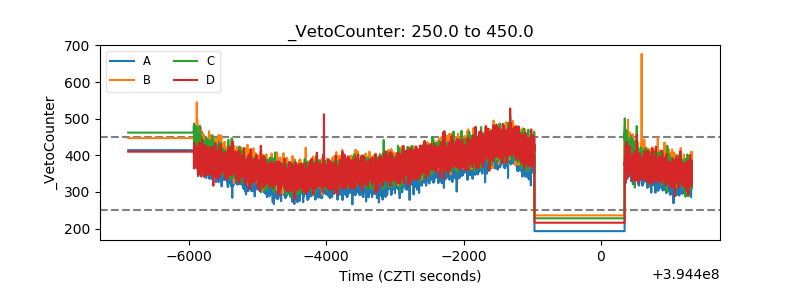 |