| Param | Original file | Final file |
|---|---|---|
| Filename | modeM0/AS1A11_089T02_9000005216_36542cztM0_level2.evt | modeM0/AS1A11_089T02_9000005216_36542cztM0_level2_quad_clean.evt |
| Size (bytes) | 531,371,520 | 73,848,960 |
| Size | 506.8 MB | 70.4 MB |
| Events in quadrant A | 3,302,884 | 475,048 |
| Events in quadrant B | 3,739,848 | 459,524 |
| Events in quadrant C | 3,943,067 | 447,503 |
| Events in quadrant D | 4,699,491 | 433,858 |
| Mode M9 | |||
|---|---|---|---|
| Quadrant | BADHDUFLAG | Total packets | Discarded packets |
| A | 0 | 24 | 0 |
| B | 0 | 24 | 0 |
| C | 0 | 24 | 0 |
| D | 0 | 25 | 0 |
| Mode M0 | |||
|---|---|---|---|
| Quadrant | BADHDUFLAG | Total packets | Discarded packets |
| A | 0 | 13565 | 3 |
| B | 0 | 15026 | 2 |
| C | 0 | 15461 | 2 |
| D | 0 | 18066 | 2 |
| Mode SS | |||
|---|---|---|---|
| Quadrant | BADHDUFLAG | Total packets | Discarded packets |
| A | 0 | 122 | 0 |
| B | 0 | 122 | 0 |
| C | 0 | 122 | 0 |
| D | 0 | 122 | 0 |
| Quadrant | Total seconds | Saturated seconds | Saturation percentage |
|---|---|---|---|
| A | 6013 | 14 | 0.232829% |
| B | 6013 | 263 | 4.373857% |
| C | 6013 | 287 | 4.772992% |
| D | 6013 | 310 | 5.155496% |
Noise dominated data is calculated using 1-second bins in cleaned event files. If a bin has >2000 counts, and if more than 50% of those come from <1% of pixels, then it is considered to be noise-dominated and hence unusable.
| Quadrant | # 1 sec bins | Bins with >0 counts | Bins with >2000 counts | High rate bins dominated by noise | Noise dominated (total time) | Noise dominated (detector-on time) | Marked lightcurve |
|---|---|---|---|---|---|---|---|
| A | 7326 | 6014 | 3 | 3 | 0.04% | 0.05% | 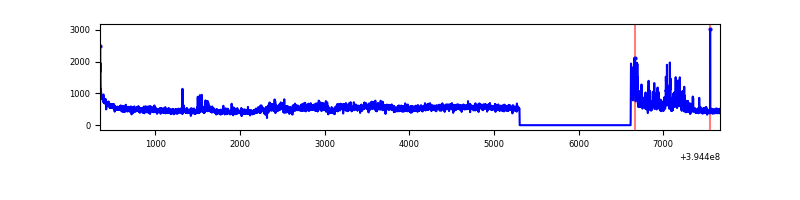 |
| B | 7326 | 6014 | 128 | 128 | 1.75% | 2.13% | 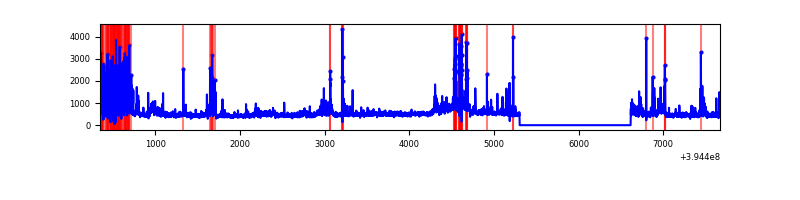 |
| C | 7326 | 6014 | 213 | 213 | 2.91% | 3.54% | 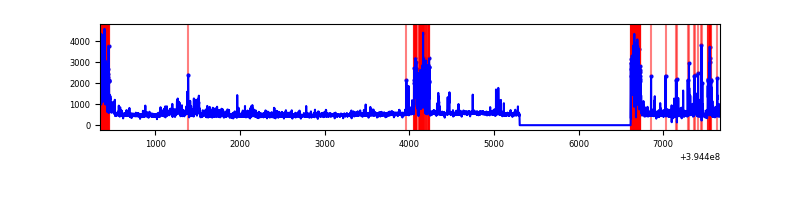 |
| D | 7326 | 6014 | 270 | 270 | 3.69% | 4.49% | 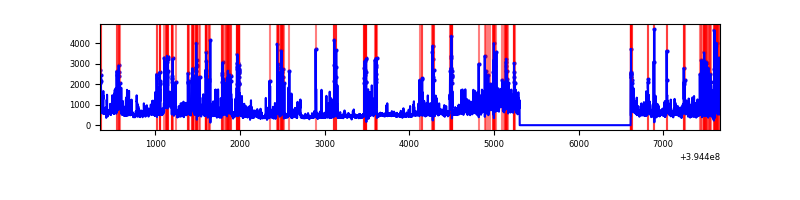 |
Top three noisy pixels from each quadrant. If the there are fewer than three noisy pixels in the level2.evt file, extra rows are filled as -1
| Pixel properties | Quadrant properties | ||||||
|---|---|---|---|---|---|---|---|
| Quadrant | DetID | PixID | Counts | Sigma | Mean | Median | Sigma |
| A | 15 | 223 | 393255 | 2813.94 | 687 | 673 | 139.5 |
| A | 10 | 83 | 217393 | 1553.4 | 687 | 673 | 139.5 |
| A | 13 | 6 | 19991 | 138.47 | 687 | 673 | 139.5 |
| B | 5 | 255 | 322275 | 2475.4 | 669 | 652 | 129.9 |
| B | 0 | 219 | 319508 | 2454.1 | 669 | 652 | 129.9 |
| B | 0 | 189 | 223802 | 1717.49 | 669 | 652 | 129.9 |
| C | 0 | 10 | 577906 | 3788.28 | 649 | 653 | 152.4 |
| C | 10 | 49 | 370650 | 2428.14 | 649 | 653 | 152.4 |
| C | 15 | 214 | 251533 | 1646.42 | 649 | 653 | 152.4 |
| D | 12 | 235 | 821855 | 5100.62 | 652 | 635 | 161.0 |
| D | 13 | 249 | 493281 | 3059.84 | 652 | 635 | 161.0 |
| D | 2 | 250 | 261580 | 1620.74 | 652 | 635 | 161.0 |
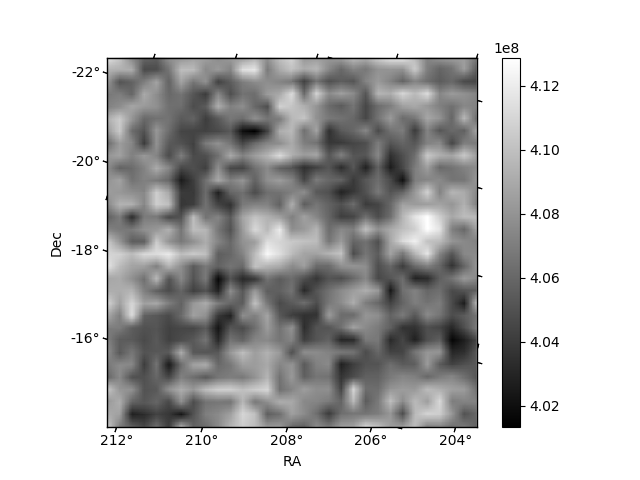
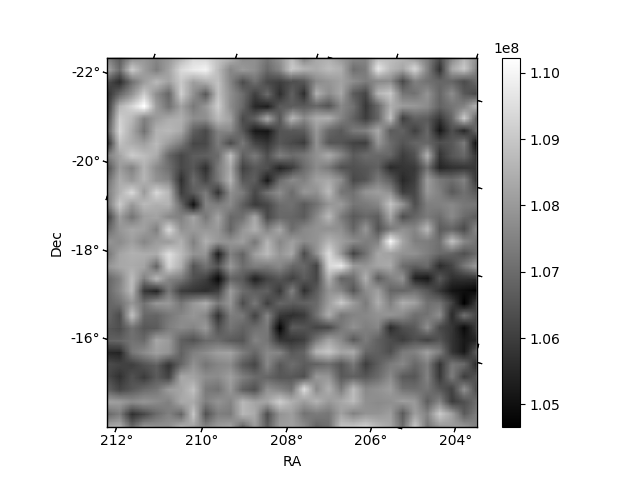
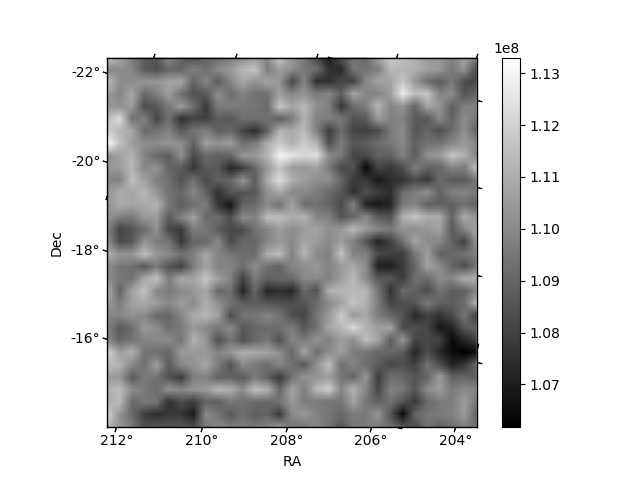
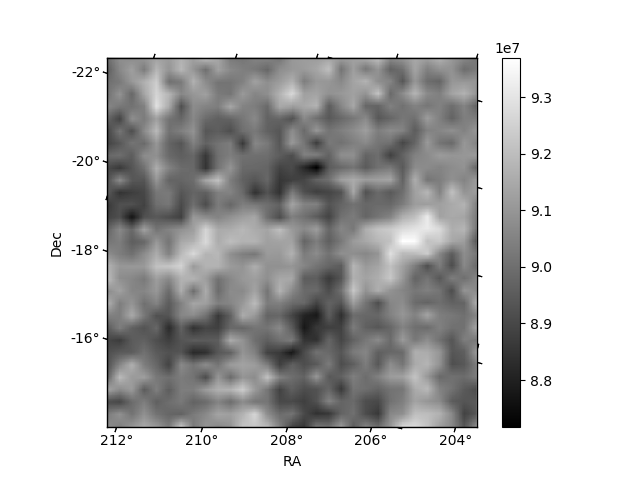
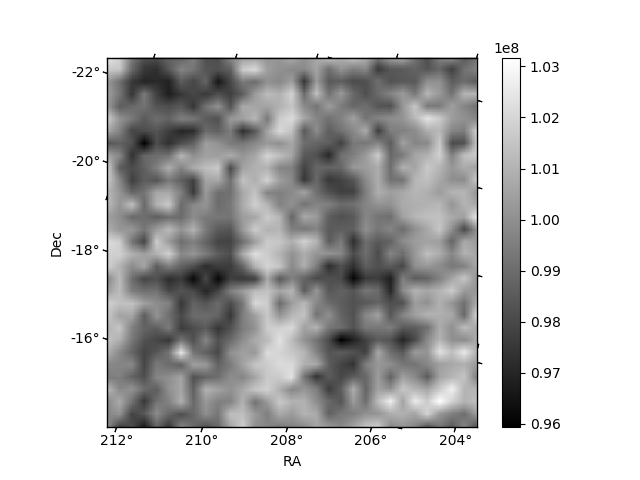
Histogram calculated using DETX and DETY for each event in the final _common_clean file
| Quadrant A |  |
 |
Quadrant B |
|---|---|---|---|
| Quadrant D |  |
 |
Quadrant C |
| Plot type | Count rate plots | Images |
|---|---|---|
| Comparison with Poisson distribution Blue bars denote a histogram of data divided into 1 sec bins. Red curve is a Poisson curve with rate = median count rate of data. |
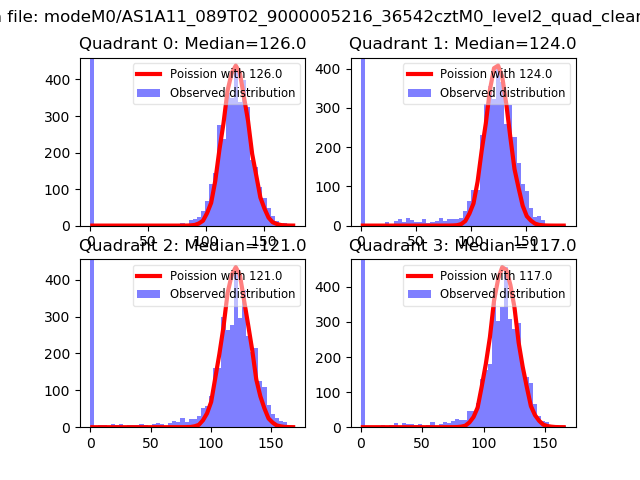 |
 |
| Quadrant-wise count rates Data is divided into 100 sec bins |
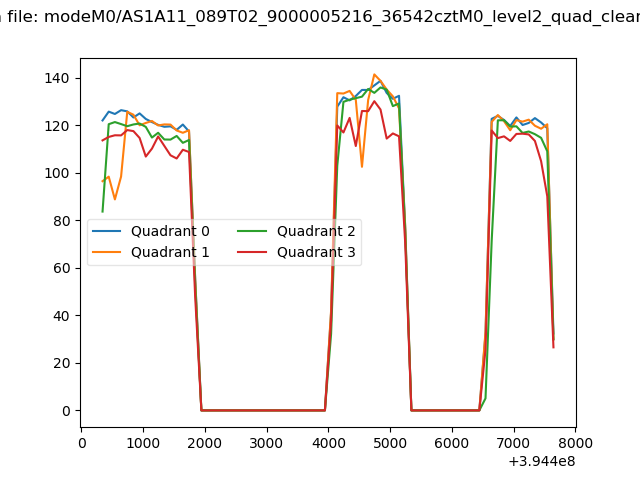 |
|
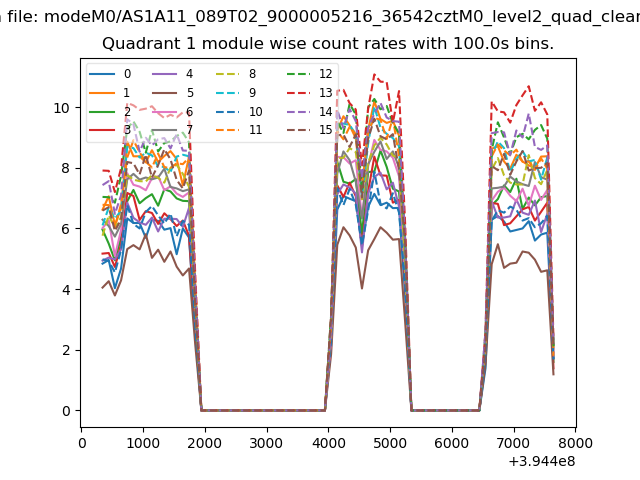
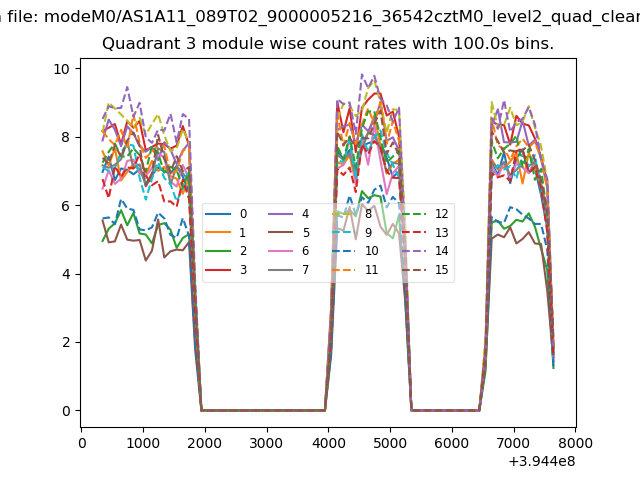
| Module-wise count rates for Quadrant A Data is divided into 100 sec bins |
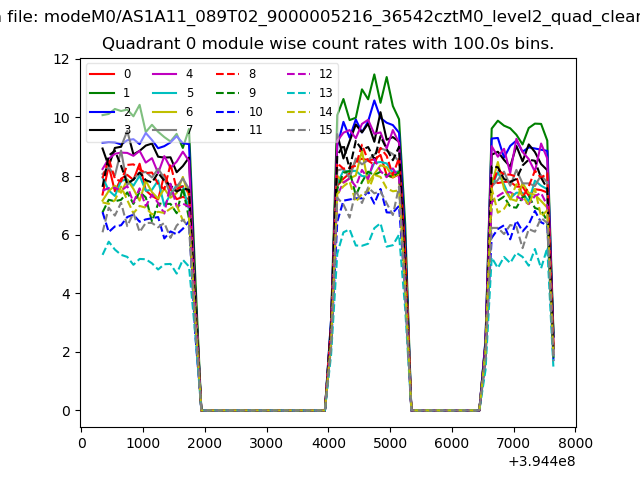 |
 |
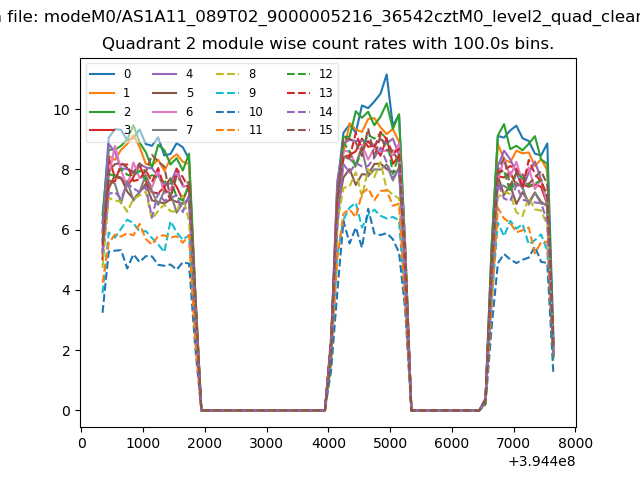
| Module-wise count rates for Quadrant B Data is divided into 100 sec bins |
 |
 |
| Module-wise count rates for Quadrant C Data is divided into 100 sec bins |
 |
 |
| Module-wise count rates for Quadrant D Data is divided into 100 sec bins |
 |
 |
| Parameter | Plot |
|---|---|
| CZT HV Monitor | 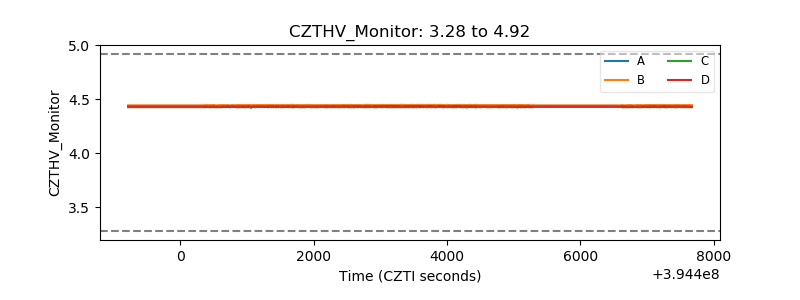 |
| D_VDD | 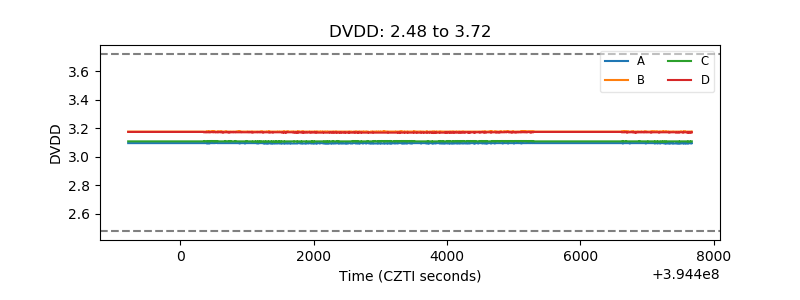 |
| Temperature 1 | 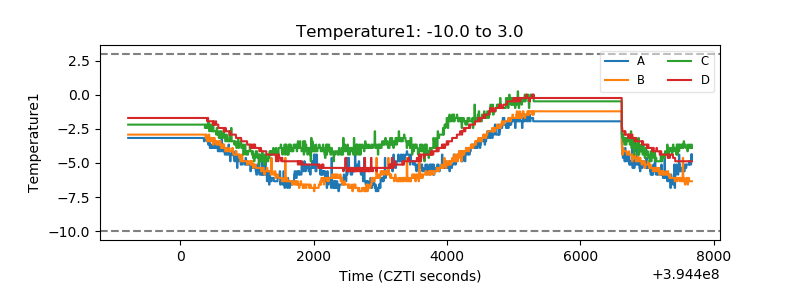 |
| Veto HV Monitor |  |
| Veto LLD | 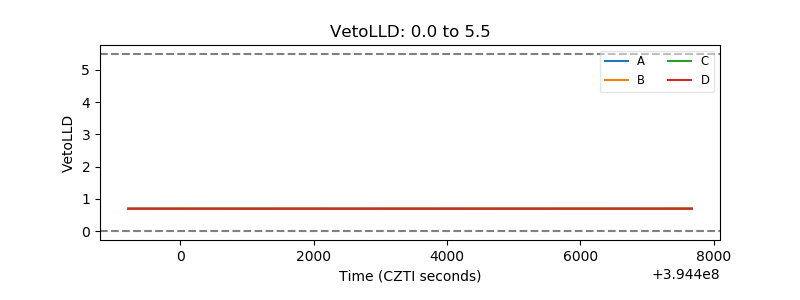 |
| Alpha Counter | 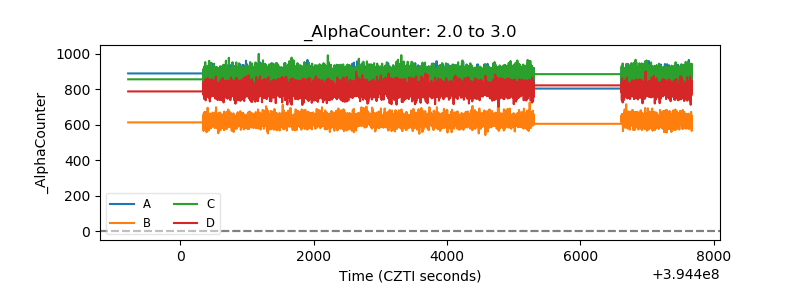 |
| _CPM_Rate | 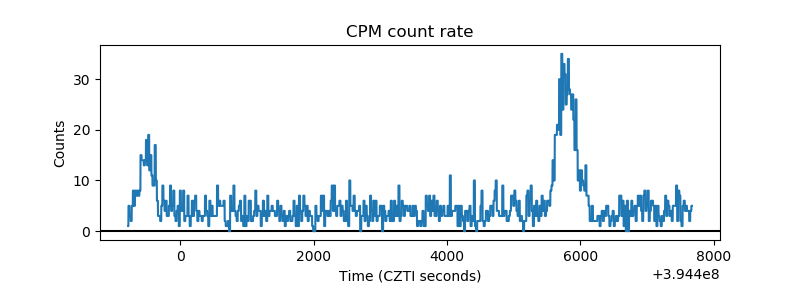 |
| CZT Counter | 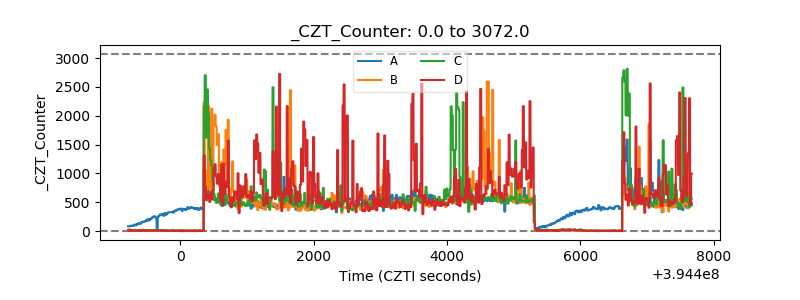 |
| +2.5 Volts monitor |  |
| +5 Volts monitor | 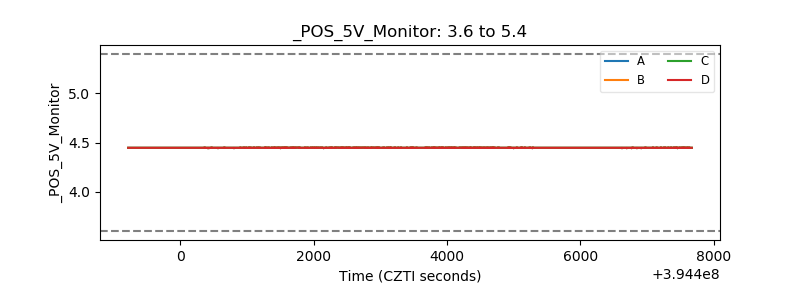 |
| _ROLL_ROT | 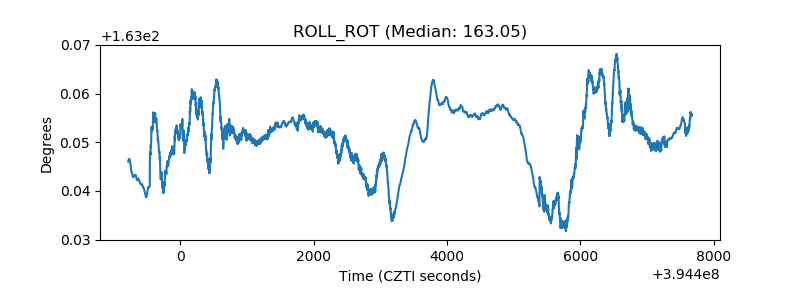 |
| _Roll_DEC |  |
| _Roll_RA | 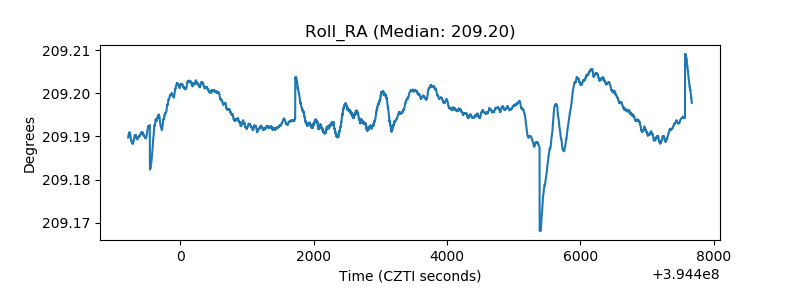 |
| Veto Counter | 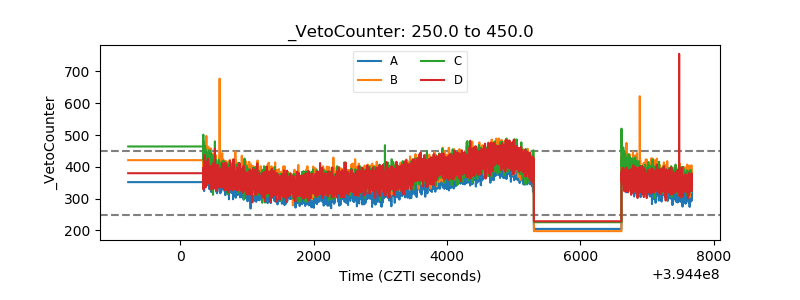 |