| Param | Original file | Final file |
|---|---|---|
| Filename | modeM0/AS1A11_089T02_9000005216_36544cztM0_level2.evt | modeM0/AS1A11_089T02_9000005216_36544cztM0_level2_quad_clean.evt |
| Size (bytes) | 915,442,560 | 115,081,920 |
| Size | 873.0 MB | 109.8 MB |
| Events in quadrant A | 5,549,704 | 713,085 |
| Events in quadrant B | 6,067,990 | 706,107 |
| Events in quadrant C | 6,922,299 | 676,759 |
| Events in quadrant D | 8,458,926 | 645,192 |
| Mode M9 | |||
|---|---|---|---|
| Quadrant | BADHDUFLAG | Total packets | Discarded packets |
| A | 0 | 42 | 0 |
| B | 0 | 42 | 0 |
| C | 0 | 42 | 0 |
| D | 0 | 42 | 0 |
| Mode M0 | |||
|---|---|---|---|
| Quadrant | BADHDUFLAG | Total packets | Discarded packets |
| A | 0 | 23110 | 4 |
| B | 0 | 25081 | 3 |
| C | 0 | 27247 | 3 |
| D | 0 | 32641 | 3 |
| Mode SS | |||
|---|---|---|---|
| Quadrant | BADHDUFLAG | Total packets | Discarded packets |
| A | 0 | 220 | 0 |
| B | 0 | 220 | 0 |
| C | 0 | 220 | 0 |
| D | 0 | 220 | 0 |
| Quadrant | Total seconds | Saturated seconds | Saturation percentage |
|---|---|---|---|
| A | 10742 | 24 | 0.223422% |
| B | 10742 | 210 | 1.954943% |
| C | 10742 | 420 | 3.909886% |
| D | 10742 | 608 | 5.660026% |
Noise dominated data is calculated using 1-second bins in cleaned event files. If a bin has >2000 counts, and if more than 50% of those come from <1% of pixels, then it is considered to be noise-dominated and hence unusable.
| Quadrant | # 1 sec bins | Bins with >0 counts | Bins with >2000 counts | High rate bins dominated by noise | Noise dominated (total time) | Noise dominated (detector-on time) | Marked lightcurve |
|---|---|---|---|---|---|---|---|
| A | 14891 | 10745 | 8 | 8 | 0.05% | 0.07% | 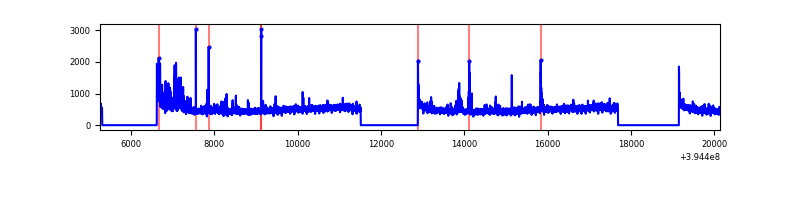 |
| B | 14891 | 10745 | 112 | 112 | 0.75% | 1.04% | 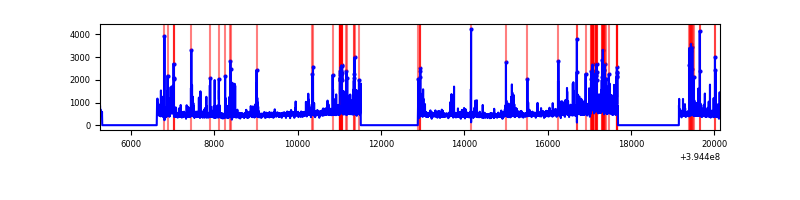 |
| C | 14891 | 10745 | 337 | 337 | 2.26% | 3.14% | 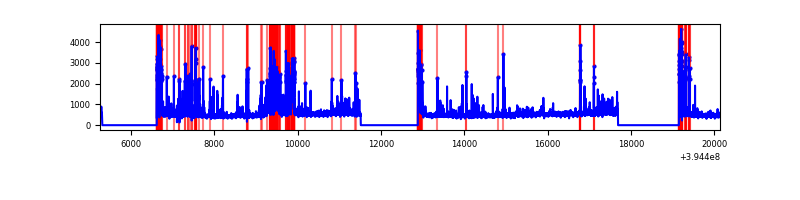 |
| D | 14891 | 10745 | 506 | 506 | 3.40% | 4.71% | 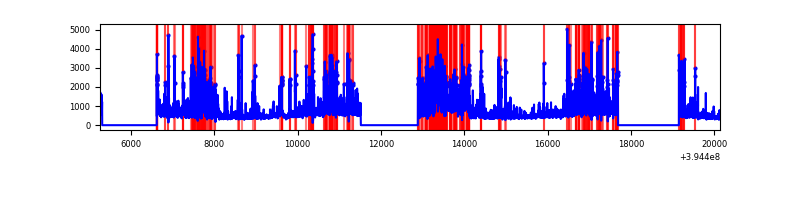 |
Top three noisy pixels from each quadrant. If the there are fewer than three noisy pixels in the level2.evt file, extra rows are filled as -1
| Pixel properties | Quadrant properties | ||||||
|---|---|---|---|---|---|---|---|
| Quadrant | DetID | PixID | Counts | Sigma | Mean | Median | Sigma |
| A | 10 | 83 | 356957 | 1432.84 | 1239 | 1215 | 248.3 |
| A | 15 | 223 | 341167 | 1369.24 | 1239 | 1215 | 248.3 |
| A | 7 | 3 | 25933 | 99.56 | 1239 | 1215 | 248.3 |
| B | 5 | 255 | 312190 | 1321.51 | 1226 | 1194 | 235.3 |
| B | 5 | 172 | 307987 | 1303.65 | 1226 | 1194 | 235.3 |
| B | 4 | 171 | 156877 | 661.54 | 1226 | 1194 | 235.3 |
| C | 0 | 10 | 824461 | 2992.46 | 1175 | 1180 | 275.1 |
| C | 10 | 49 | 498585 | 1807.97 | 1175 | 1180 | 275.1 |
| C | 14 | 254 | 478659 | 1735.54 | 1175 | 1180 | 275.1 |
| D | 12 | 235 | 1683270 | 5870.27 | 1174 | 1140 | 286.6 |
| D | 2 | 250 | 601999 | 2096.87 | 1174 | 1140 | 286.6 |
| D | 13 | 249 | 594469 | 2070.59 | 1174 | 1140 | 286.6 |
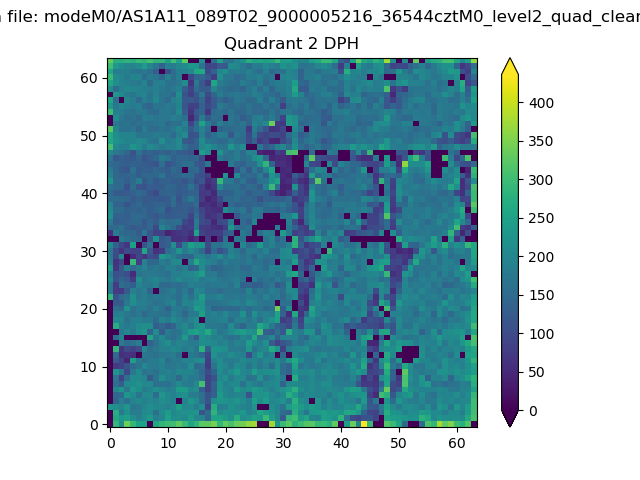
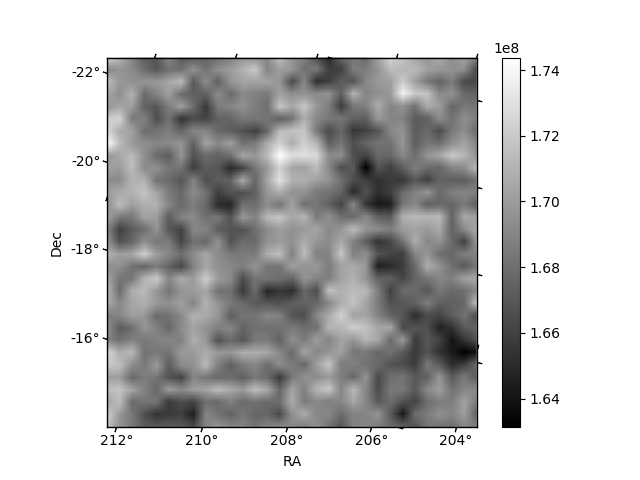
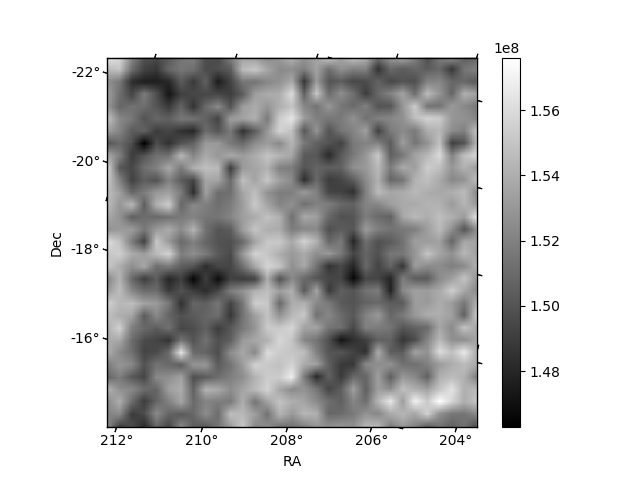
Histogram calculated using DETX and DETY for each event in the final _common_clean file
| Quadrant A | 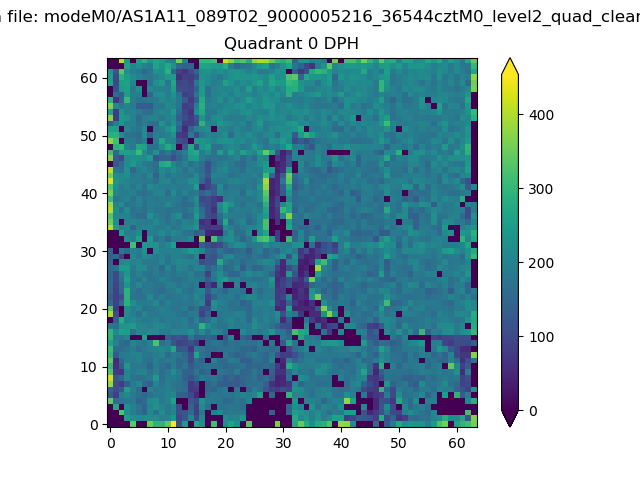 |
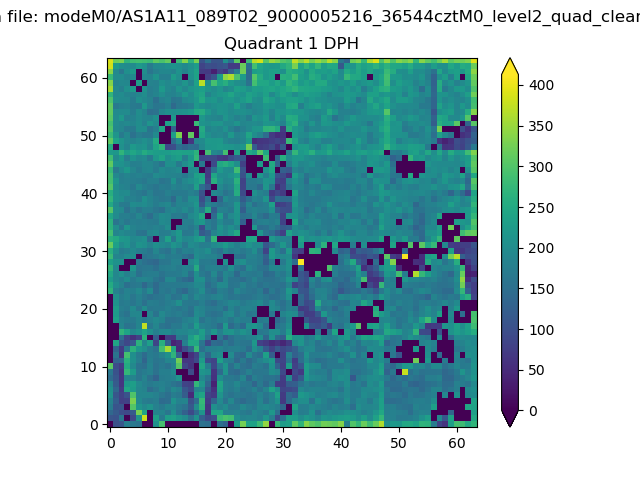 |
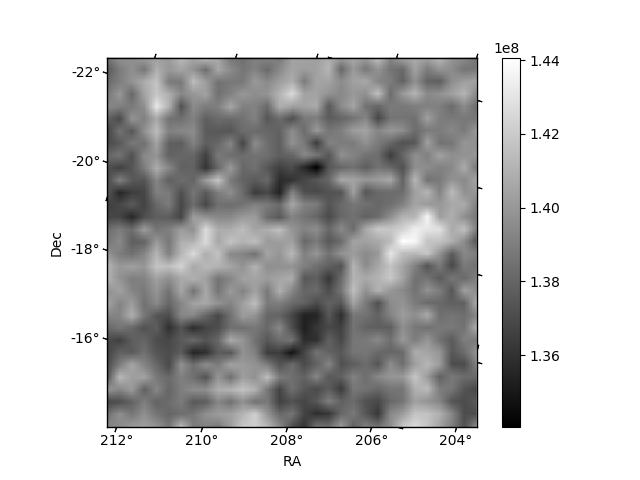
Quadrant B |
|---|---|---|---|
| Quadrant D | 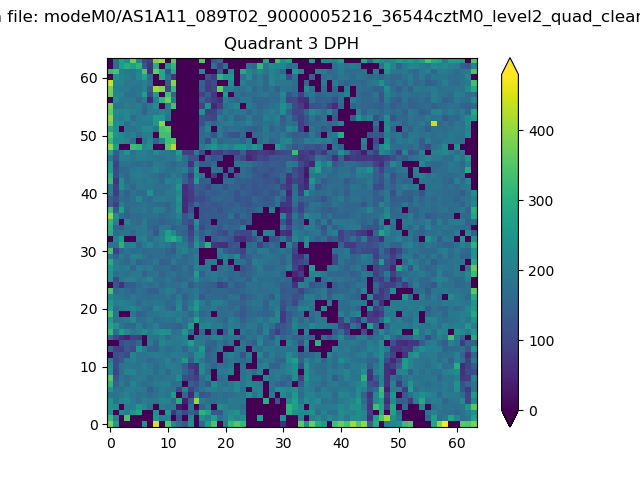 |
 |
Quadrant C |
| Plot type | Count rate plots | Images |
|---|---|---|
| Comparison with Poisson distribution Blue bars denote a histogram of data divided into 1 sec bins. Red curve is a Poisson curve with rate = median count rate of data. |
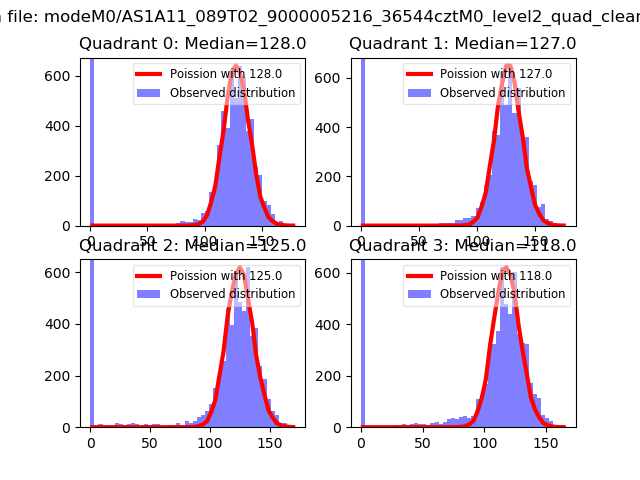 |
 |
| Quadrant-wise count rates Data is divided into 100 sec bins |
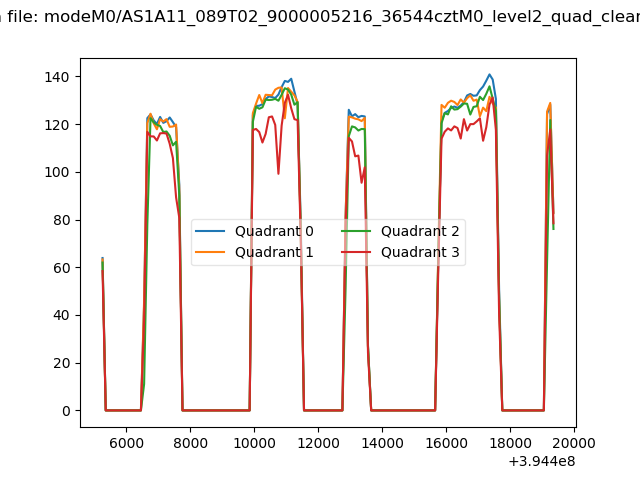 |
|
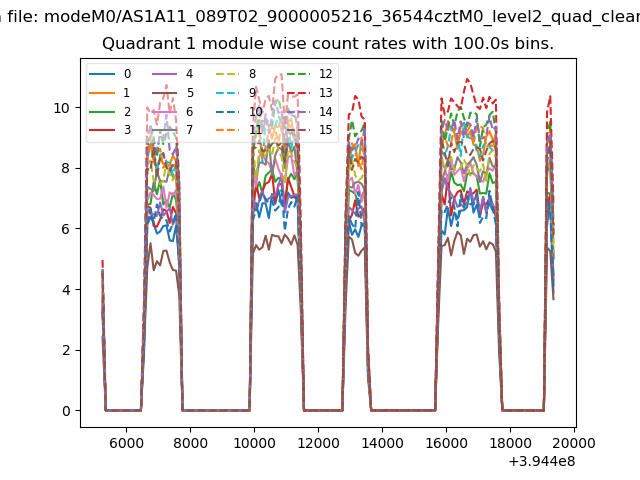
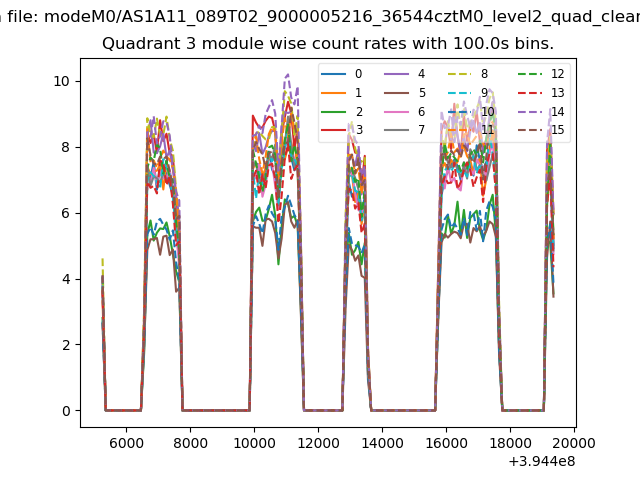
| Module-wise count rates for Quadrant A Data is divided into 100 sec bins |
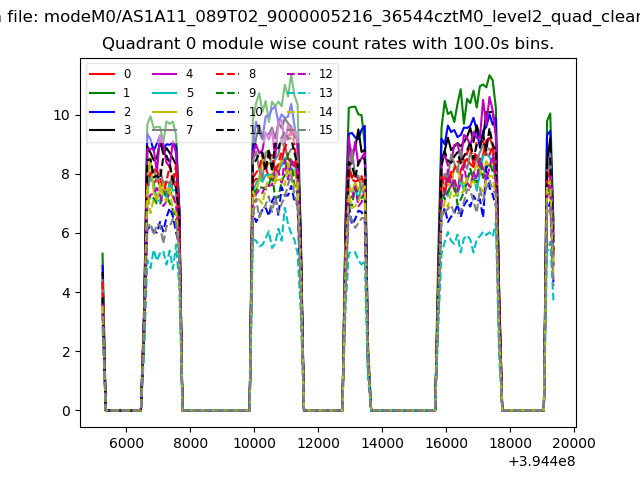 |
 |
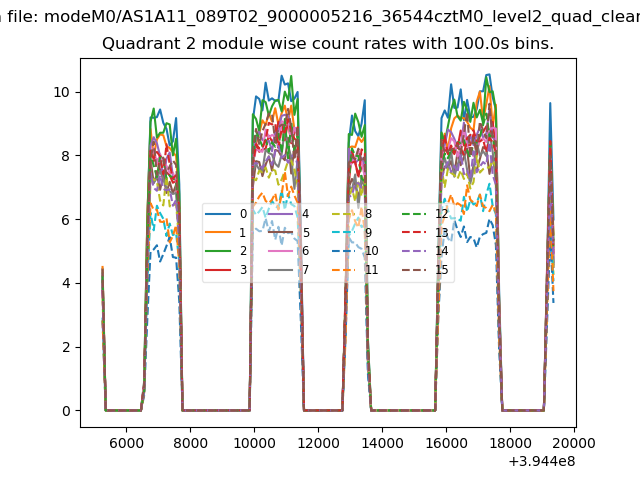
| Module-wise count rates for Quadrant B Data is divided into 100 sec bins |
 |
 |
| Module-wise count rates for Quadrant C Data is divided into 100 sec bins |
 |
 |
| Module-wise count rates for Quadrant D Data is divided into 100 sec bins |
 |
 |
| Parameter | Plot |
|---|---|
| CZT HV Monitor | 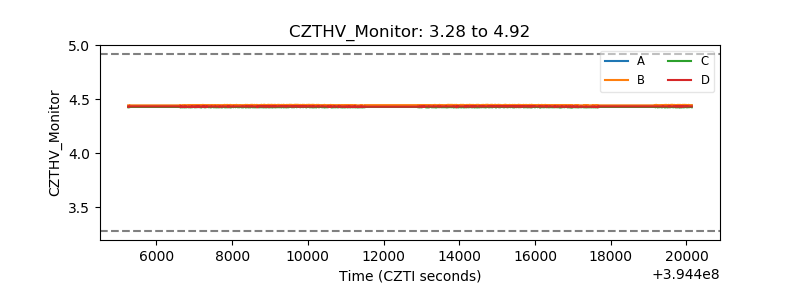 |
| D_VDD | 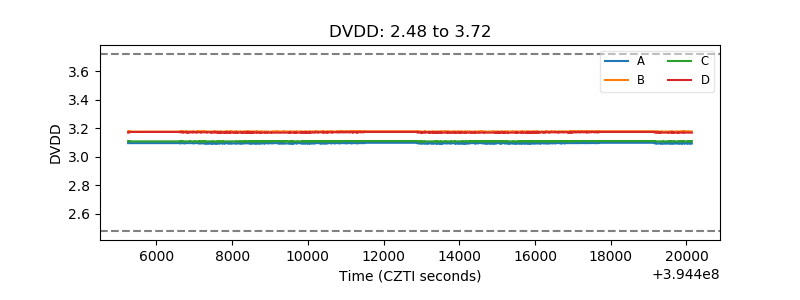 |
| Temperature 1 |  |
| Veto HV Monitor | 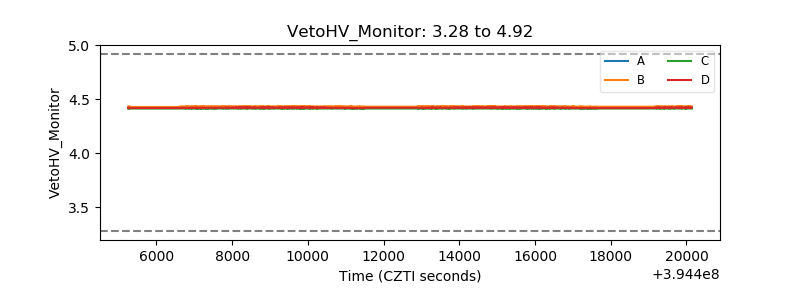 |
| Veto LLD | 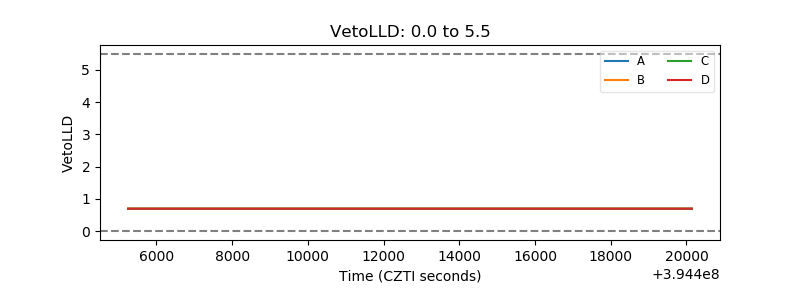 |
| Alpha Counter | 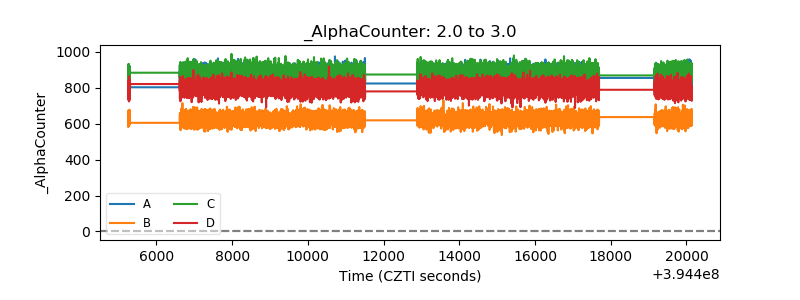 |
| _CPM_Rate |  |
| CZT Counter |  |
| +2.5 Volts monitor |  |
| +5 Volts monitor |  |
| _ROLL_ROT | 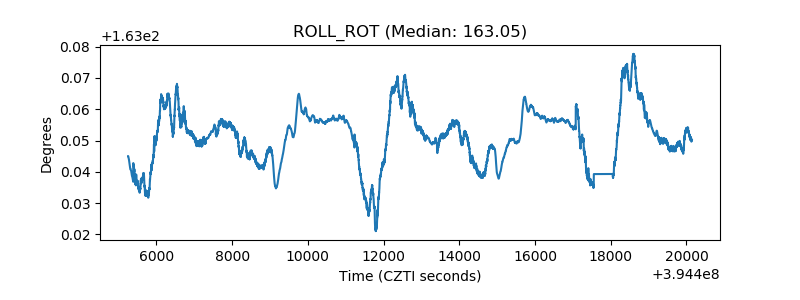 |
| _Roll_DEC | 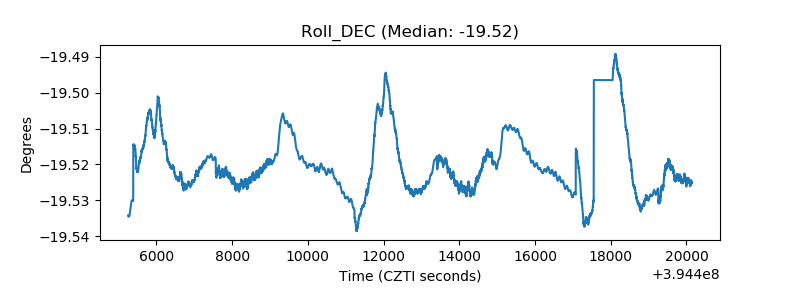 |
| _Roll_RA |  |
| Veto Counter | 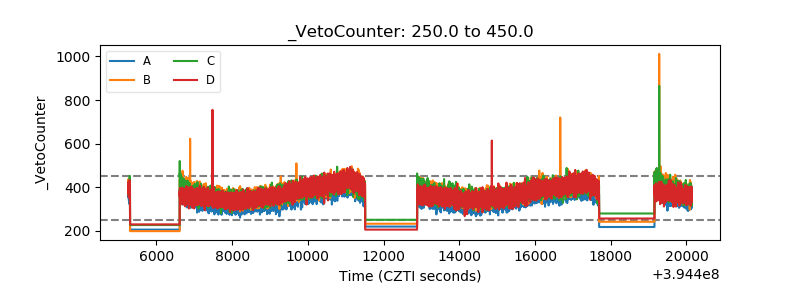 |