| Param | Original file | Final file |
|---|---|---|
| Filename | modeM0/AS1A11_089T02_9000005216_36546cztM0_level2.evt | modeM0/AS1A11_089T02_9000005216_36546cztM0_level2_quad_clean.evt |
| Size (bytes) | 2,017,759,680 | 260,703,360 |
| Size | 1.9 GB | 248.6 MB |
| Events in quadrant A | 12,744,391 | 1,605,692 |
| Events in quadrant B | 14,321,221 | 1,593,126 |
| Events in quadrant C | 15,053,791 | 1,540,644 |
| Events in quadrant D | 17,333,979 | 1,466,137 |
| Mode M9 | |||
|---|---|---|---|
| Quadrant | BADHDUFLAG | Total packets | Discarded packets |
| A | 0 | 75 | 0 |
| B | 0 | 75 | 0 |
| C | 0 | 75 | 0 |
| D | 0 | 75 | 0 |
| Mode M0 | |||
|---|---|---|---|
| Quadrant | BADHDUFLAG | Total packets | Discarded packets |
| A | 0 | 52844 | 6 |
| B | 0 | 58477 | 5 |
| C | 0 | 59497 | 5 |
| D | 0 | 68420 | 5 |
| Mode SS | |||
|---|---|---|---|
| Quadrant | BADHDUFLAG | Total packets | Discarded packets |
| A | 0 | 500 | 0 |
| B | 0 | 500 | 0 |
| C | 0 | 500 | 0 |
| D | 0 | 500 | 0 |
| Quadrant | Total seconds | Saturated seconds | Saturation percentage |
|---|---|---|---|
| A | 24563 | 95 | 0.386761% |
| B | 24563 | 475 | 1.933803% |
| C | 24563 | 724 | 2.947523% |
| D | 24563 | 1040 | 4.234011% |
Noise dominated data is calculated using 1-second bins in cleaned event files. If a bin has >2000 counts, and if more than 50% of those come from <1% of pixels, then it is considered to be noise-dominated and hence unusable.
| Quadrant | # 1 sec bins | Bins with >0 counts | Bins with >2000 counts | High rate bins dominated by noise | Noise dominated (total time) | Noise dominated (detector-on time) | Marked lightcurve |
|---|---|---|---|---|---|---|---|
| A | 31998 | 24568 | 50 | 50 | 0.16% | 0.20% | 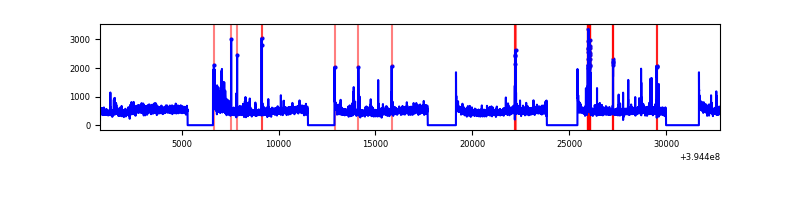 |
| B | 31998 | 24568 | 277 | 277 | 0.87% | 1.13% | 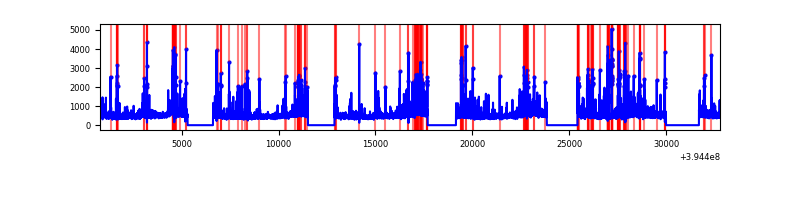 |
| C | 31998 | 24568 | 564 | 564 | 1.76% | 2.30% | 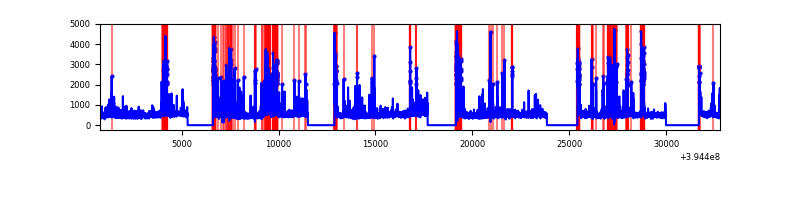 |
| D | 31998 | 24568 | 875 | 875 | 2.73% | 3.56% | 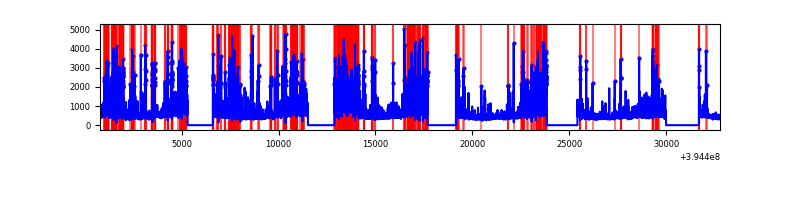 |
Top three noisy pixels from each quadrant. If the there are fewer than three noisy pixels in the level2.evt file, extra rows are filled as -1
| Pixel properties | Quadrant properties | ||||||
|---|---|---|---|---|---|---|---|
| Quadrant | DetID | PixID | Counts | Sigma | Mean | Median | Sigma |
| A | 15 | 223 | 730048 | 1275.0 | 2861 | 2802 | 570.4 |
| A | 10 | 83 | 714324 | 1247.43 | 2861 | 2802 | 570.4 |
| A | 9 | 143 | 162369 | 279.75 | 2861 | 2802 | 570.4 |
| B | 5 | 255 | 1279768 | 2387.97 | 2820 | 2741 | 534.8 |
| B | 5 | 172 | 670451 | 1248.58 | 2820 | 2741 | 534.8 |
| B | 0 | 189 | 413289 | 767.7 | 2820 | 2741 | 534.8 |
| C | 0 | 10 | 1444160 | 2281.39 | 2725 | 2739 | 631.8 |
| C | 15 | 214 | 1028832 | 1624.04 | 2725 | 2739 | 631.8 |
| C | 14 | 254 | 925635 | 1460.7 | 2725 | 2739 | 631.8 |
| D | 12 | 235 | 2382319 | 3574.27 | 2728 | 2656 | 665.8 |
| D | 13 | 249 | 1168907 | 1751.72 | 2728 | 2656 | 665.8 |
| D | 2 | 250 | 767271 | 1148.46 | 2728 | 2656 | 665.8 |
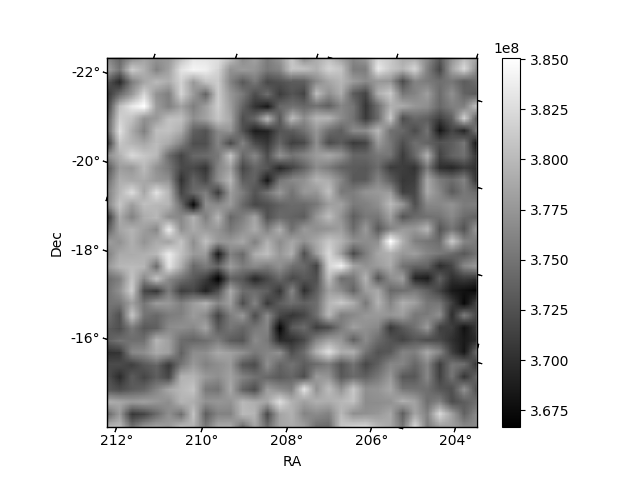
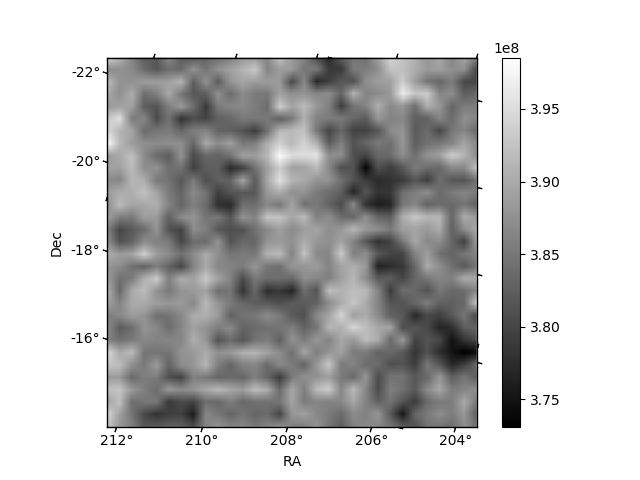
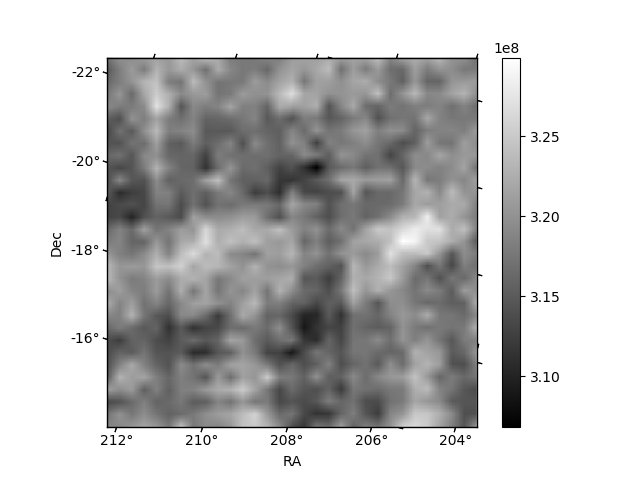
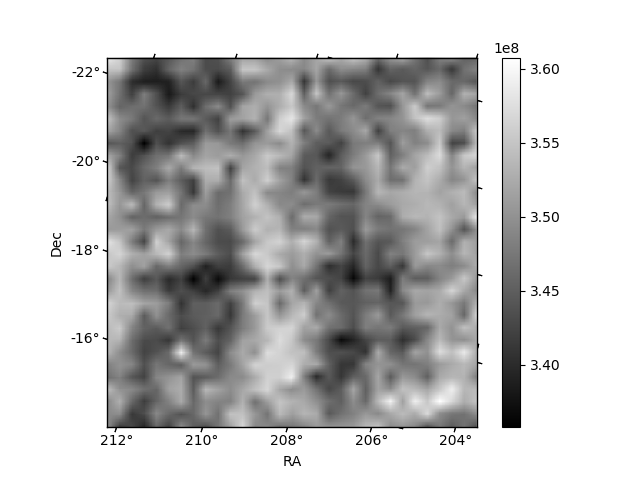
Histogram calculated using DETX and DETY for each event in the final _common_clean file
| Quadrant A | 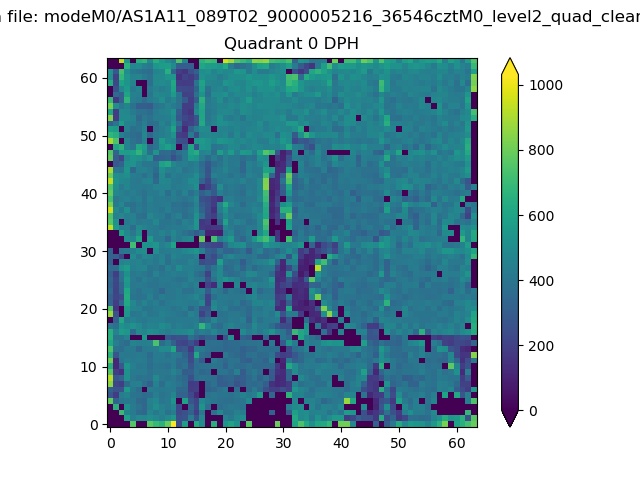 |
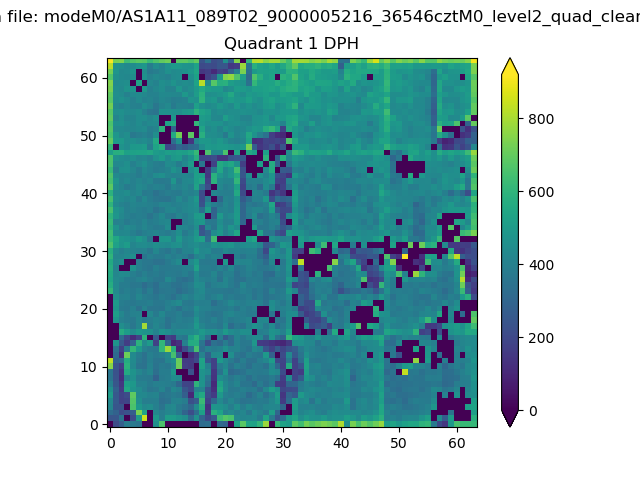 |
Quadrant B |
|---|---|---|---|
| Quadrant D | 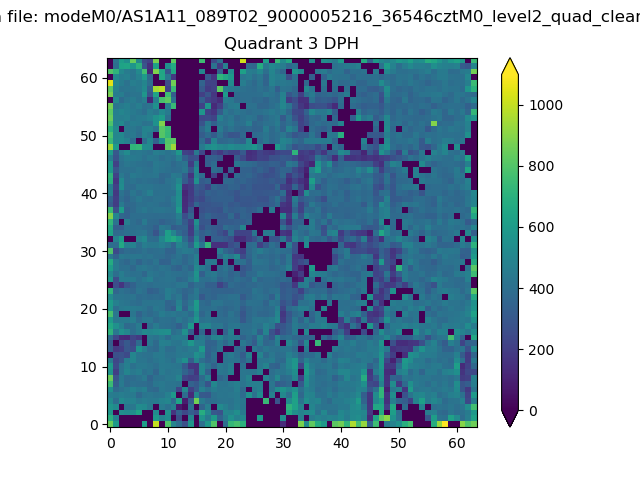 |
 |
Quadrant C |
| Plot type | Count rate plots | Images |
|---|---|---|
| Comparison with Poisson distribution Blue bars denote a histogram of data divided into 1 sec bins. Red curve is a Poisson curve with rate = median count rate of data. |
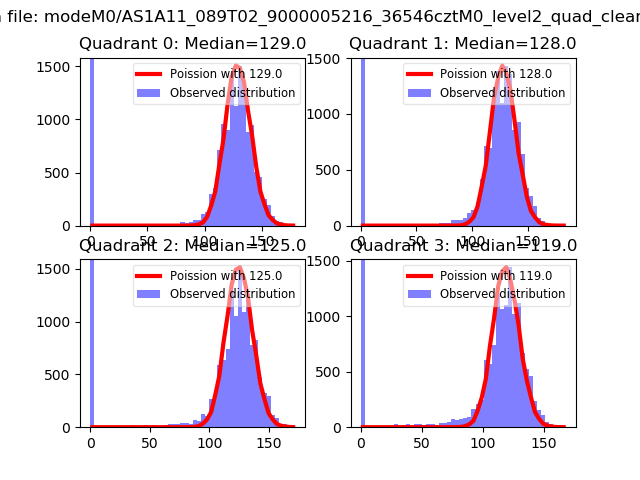 |
 |
| Quadrant-wise count rates Data is divided into 100 sec bins |
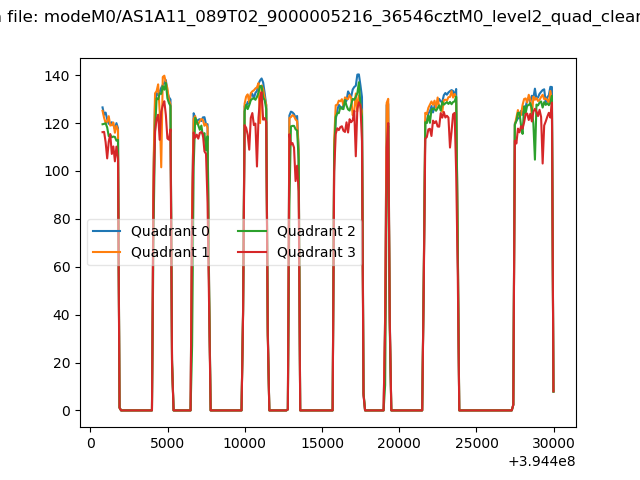 |
|
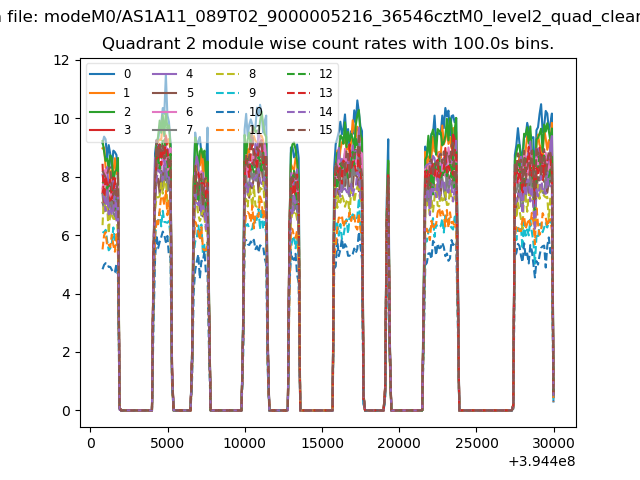
| Module-wise count rates for Quadrant A Data is divided into 100 sec bins |
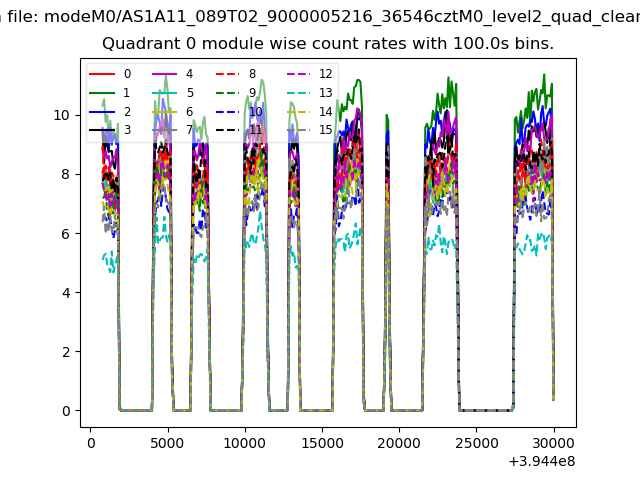 |
 |
| Module-wise count rates for Quadrant B Data is divided into 100 sec bins |
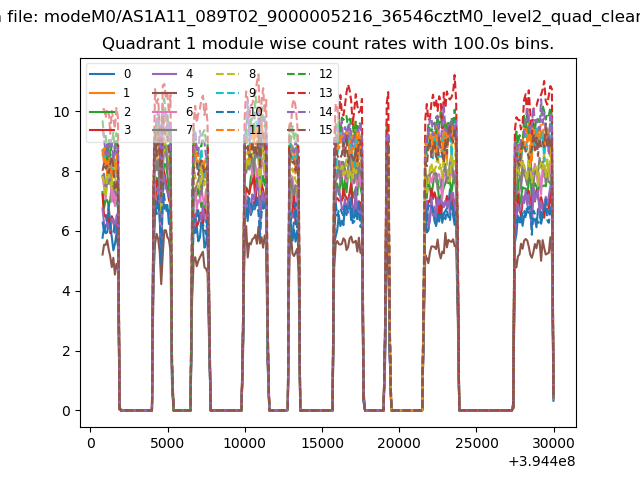 |
 |
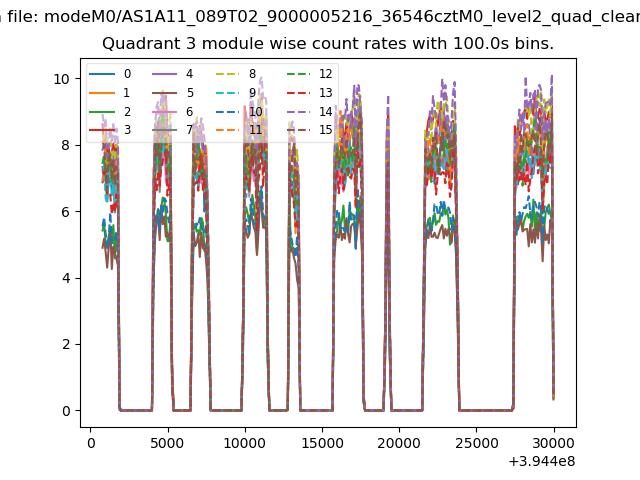
| Module-wise count rates for Quadrant C Data is divided into 100 sec bins |
 |
 |
| Module-wise count rates for Quadrant D Data is divided into 100 sec bins |
 |
 |
| Parameter | Plot |
|---|---|
| CZT HV Monitor | 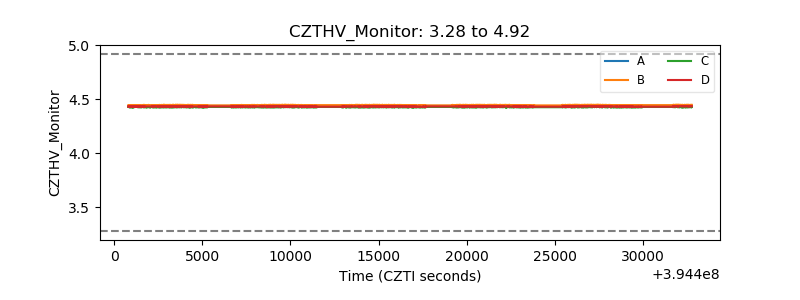 |
| D_VDD | 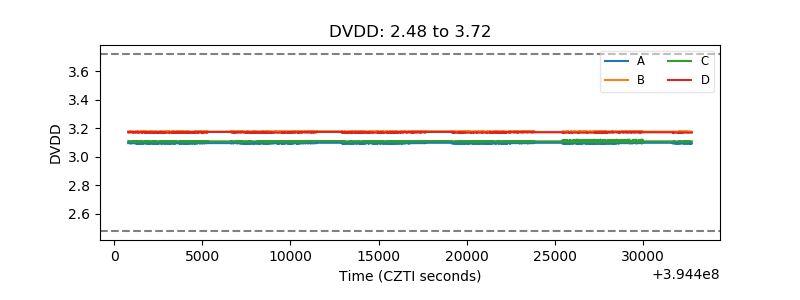 |
| Temperature 1 |  |
| Veto HV Monitor | 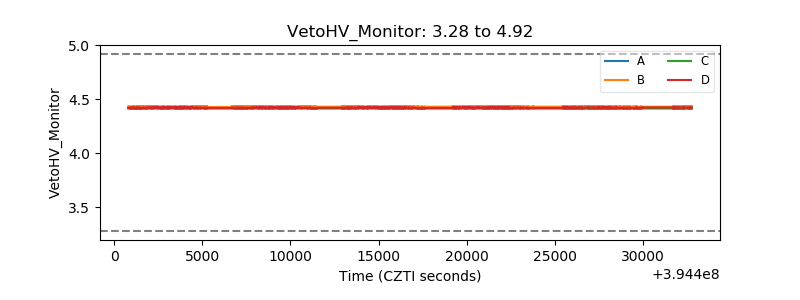 |
| Veto LLD | 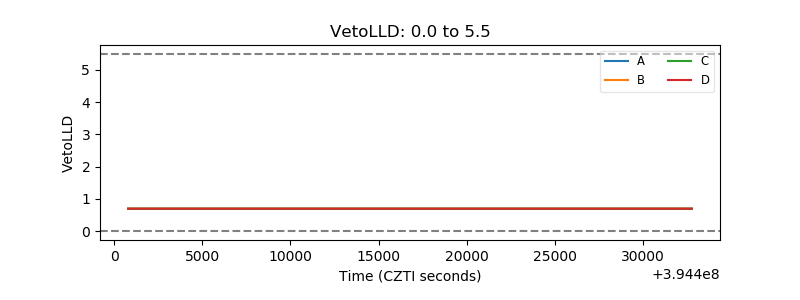 |
| Alpha Counter | 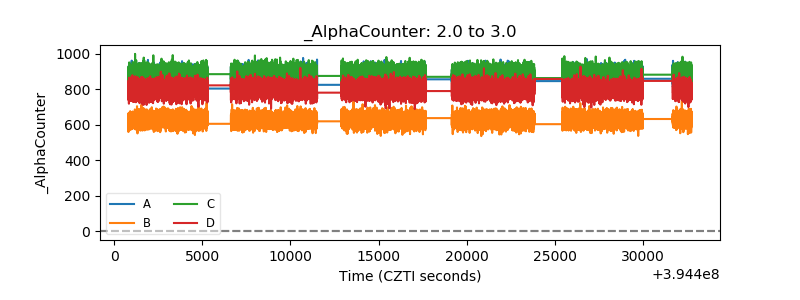 |
| _CPM_Rate |  |
| CZT Counter | 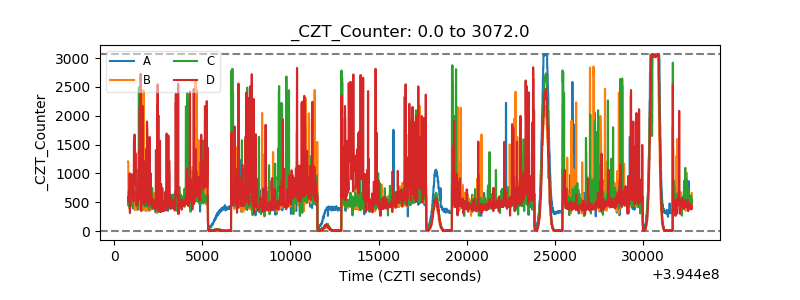 |
| +2.5 Volts monitor |  |
| +5 Volts monitor |  |
| _ROLL_ROT | 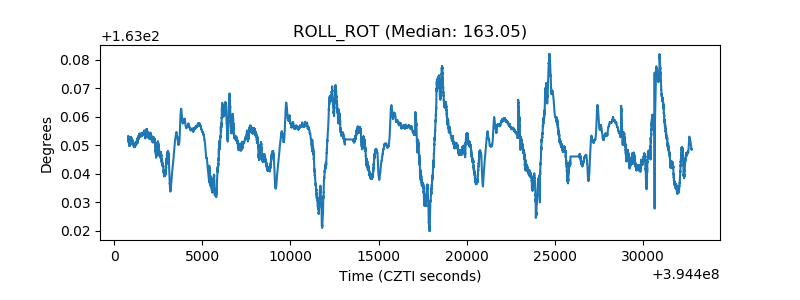 |
| _Roll_DEC | 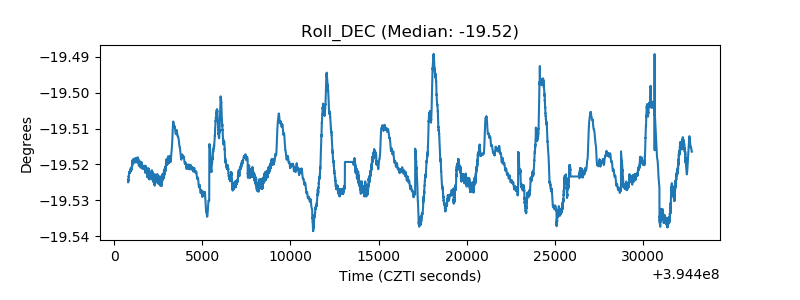 |
| _Roll_RA |  |
| Veto Counter | 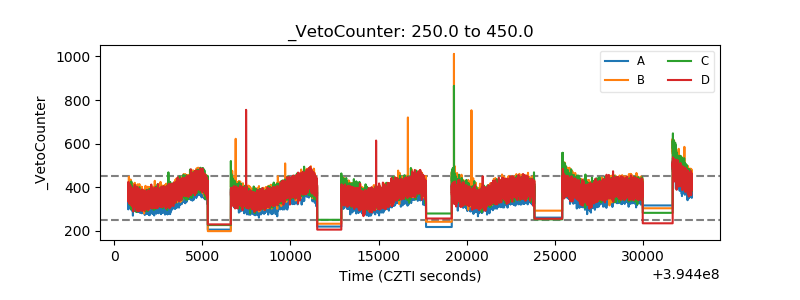 |