| Param | Original file | Final file |
|---|---|---|
| Filename | modeM0/AS1A11_089T02_9000005216_36548cztM0_level2.evt | modeM0/AS1A11_089T02_9000005216_36548cztM0_level2_quad_clean.evt |
| Size (bytes) | 464,725,440 | 59,457,600 |
| Size | 443.2 MB | 56.7 MB |
| Events in quadrant A | 2,885,646 | 370,259 |
| Events in quadrant B | 3,494,330 | 366,271 |
| Events in quadrant C | 3,249,580 | 361,290 |
| Events in quadrant D | 4,076,007 | 321,789 |
| Mode M9 | |||
|---|---|---|---|
| Quadrant | BADHDUFLAG | Total packets | Discarded packets |
| A | 0 | 28 | 0 |
| B | 0 | 28 | 0 |
| C | 0 | 28 | 0 |
| D | 0 | 29 | 0 |
| Mode M0 | |||
|---|---|---|---|
| Quadrant | BADHDUFLAG | Total packets | Discarded packets |
| A | 0 | 11764 | 3 |
| B | 0 | 13765 | 2 |
| C | 0 | 12779 | 2 |
| D | 0 | 15668 | 2 |
| Mode SS | |||
|---|---|---|---|
| Quadrant | BADHDUFLAG | Total packets | Discarded packets |
| A | 0 | 110 | 0 |
| B | 0 | 110 | 0 |
| C | 0 | 110 | 0 |
| D | 0 | 110 | 0 |
| Quadrant | Total seconds | Saturated seconds | Saturation percentage |
|---|---|---|---|
| A | 5435 | 13 | 0.239190% |
| B | 5435 | 119 | 2.189512% |
| C | 5435 | 100 | 1.839926% |
| D | 5435 | 369 | 6.789328% |
Noise dominated data is calculated using 1-second bins in cleaned event files. If a bin has >2000 counts, and if more than 50% of those come from <1% of pixels, then it is considered to be noise-dominated and hence unusable.
| Quadrant | # 1 sec bins | Bins with >0 counts | Bins with >2000 counts | High rate bins dominated by noise | Noise dominated (total time) | Noise dominated (detector-on time) | Marked lightcurve |
|---|---|---|---|---|---|---|---|
| A | 7288 | 5436 | 3 | 3 | 0.04% | 0.06% | 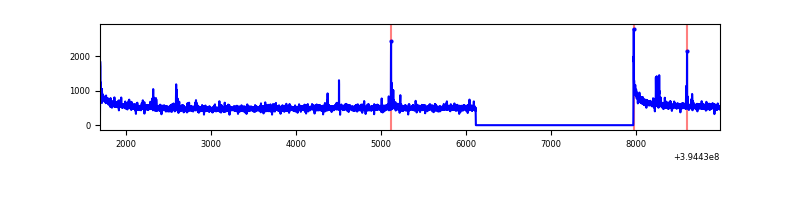 |
| B | 7288 | 5436 | 54 | 54 | 0.74% | 0.99% | 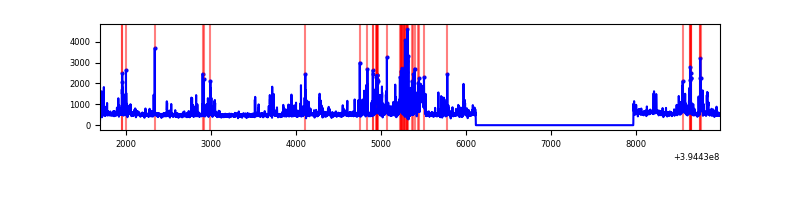 |
| C | 7288 | 5436 | 68 | 68 | 0.93% | 1.25% | 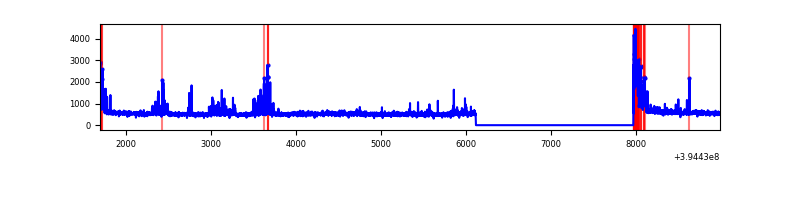 |
| D | 7288 | 5436 | 325 | 325 | 4.46% | 5.98% | 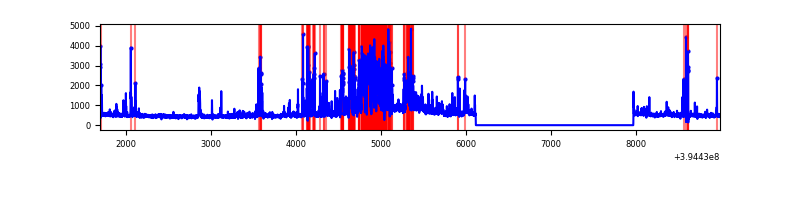 |
Top three noisy pixels from each quadrant. If the there are fewer than three noisy pixels in the level2.evt file, extra rows are filled as -1
| Pixel properties | Quadrant properties | ||||||
|---|---|---|---|---|---|---|---|
| Quadrant | DetID | PixID | Counts | Sigma | Mean | Median | Sigma |
| A | 10 | 83 | 201231 | 1494.13 | 672 | 661 | 134.2 |
| A | 15 | 223 | 43530 | 319.35 | 672 | 661 | 134.2 |
| A | 9 | 143 | 25303 | 183.57 | 672 | 661 | 134.2 |
| B | 5 | 172 | 610300 | 4857.15 | 663 | 646 | 125.5 |
| B | 5 | 255 | 112648 | 892.33 | 663 | 646 | 125.5 |
| B | 0 | 190 | 33104 | 258.59 | 663 | 646 | 125.5 |
| C | 0 | 10 | 481303 | 3251.88 | 643 | 648 | 147.8 |
| C | 15 | 214 | 234921 | 1584.98 | 643 | 648 | 147.8 |
| C | 1 | 16 | 11501 | 73.43 | 643 | 648 | 147.8 |
| D | 12 | 217 | 674757 | 4341.53 | 631 | 613 | 155.3 |
| D | 12 | 235 | 320606 | 2060.78 | 631 | 613 | 155.3 |
| D | 2 | 250 | 159945 | 1026.11 | 631 | 613 | 155.3 |
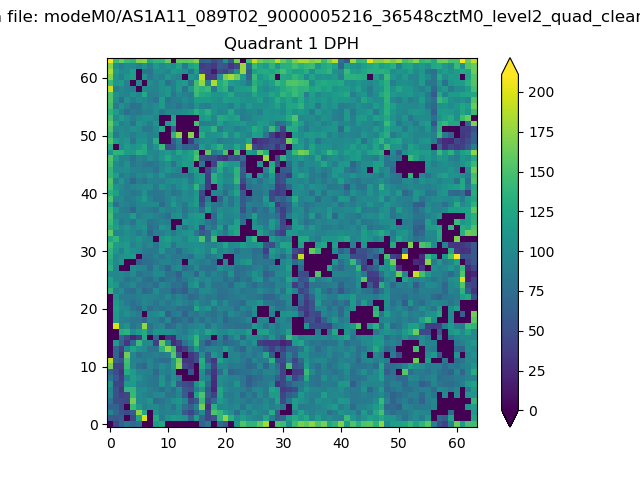
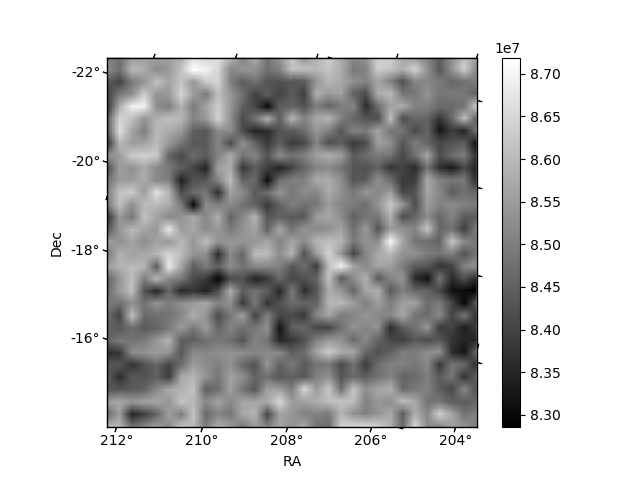
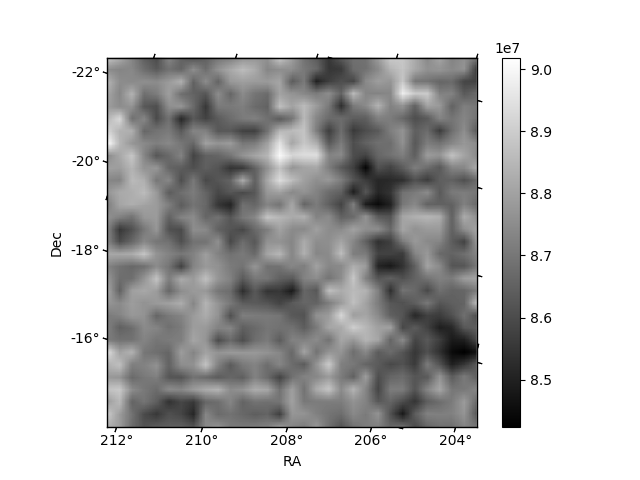
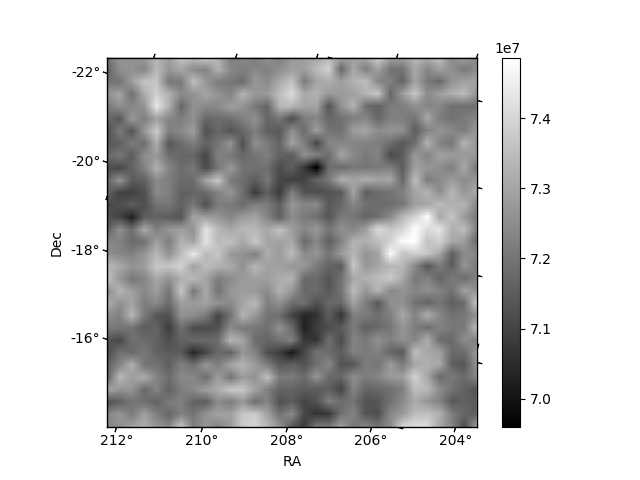
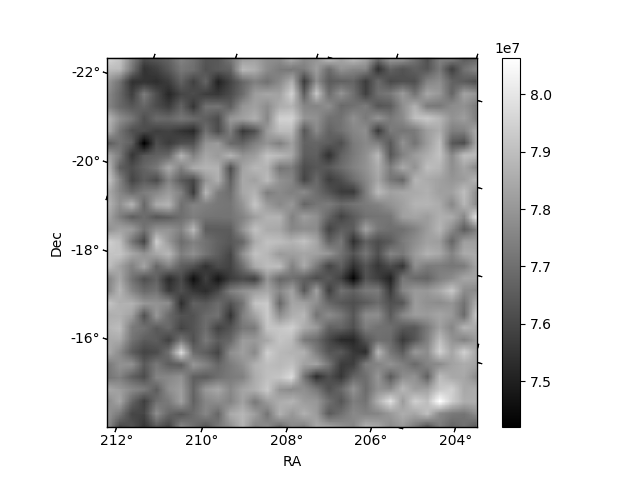
Histogram calculated using DETX and DETY for each event in the final _common_clean file
| Quadrant A |  |
 |
Quadrant B |
|---|---|---|---|
| Quadrant D | 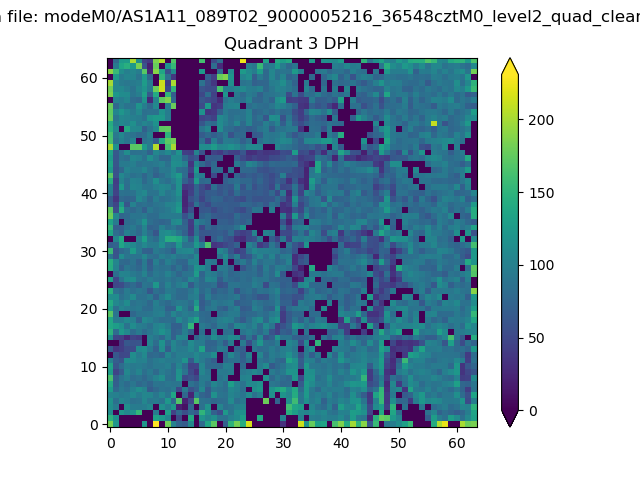 |
 |
Quadrant C |
| Plot type | Count rate plots | Images |
|---|---|---|
| Comparison with Poisson distribution Blue bars denote a histogram of data divided into 1 sec bins. Red curve is a Poisson curve with rate = median count rate of data. |
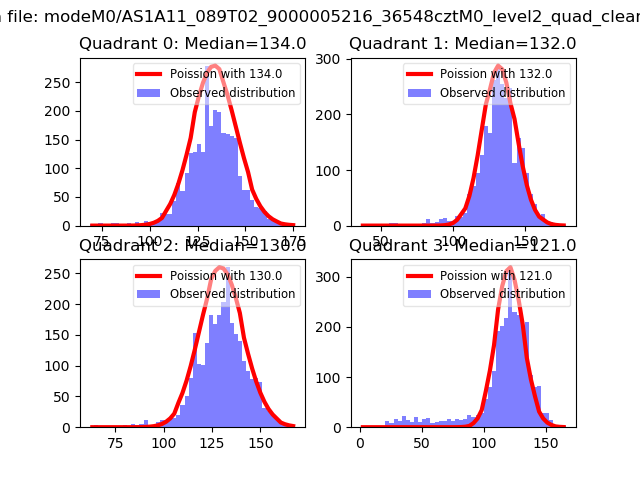 |
 |
| Quadrant-wise count rates Data is divided into 100 sec bins |
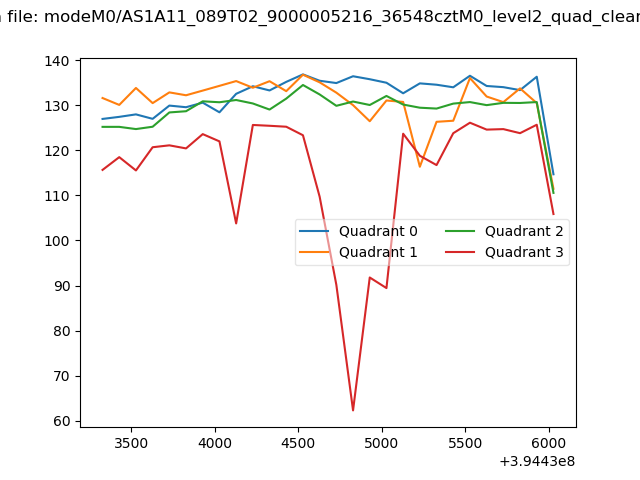 |
|
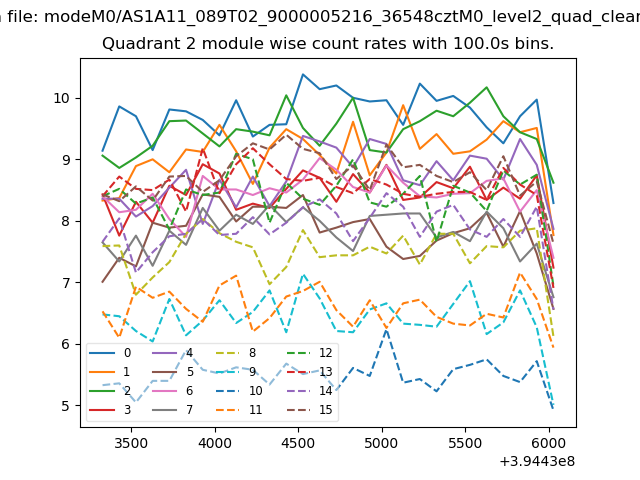
| Module-wise count rates for Quadrant A Data is divided into 100 sec bins |
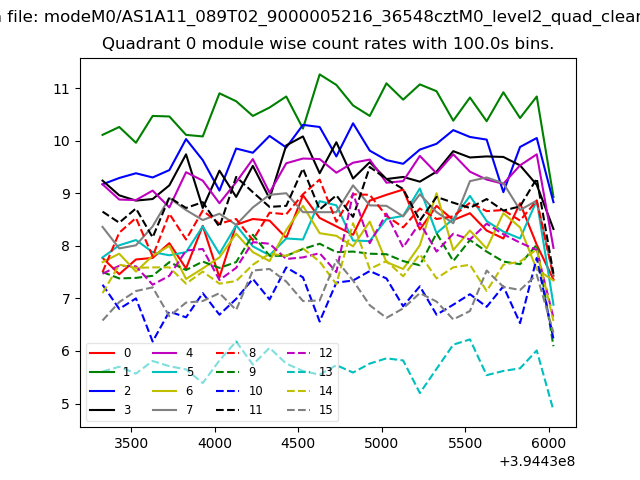 |
 |
| Module-wise count rates for Quadrant B Data is divided into 100 sec bins |
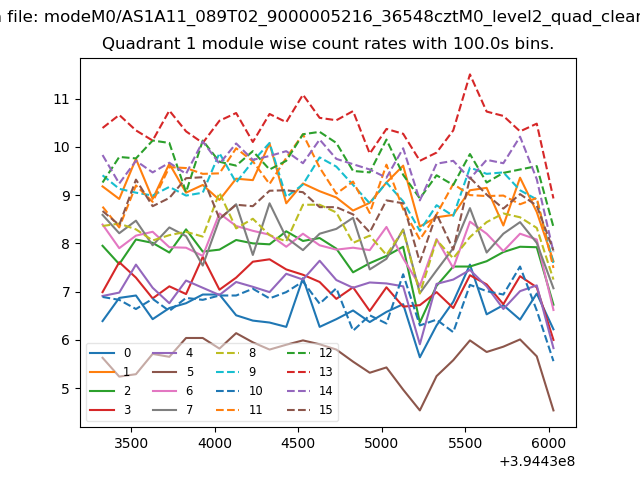 |
 |
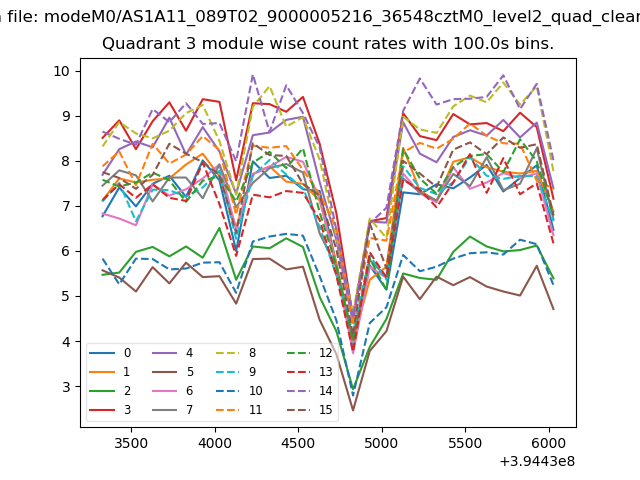
| Module-wise count rates for Quadrant C Data is divided into 100 sec bins |
 |
 |
| Module-wise count rates for Quadrant D Data is divided into 100 sec bins |
 |
 |
| Parameter | Plot |
|---|---|
| CZT HV Monitor | 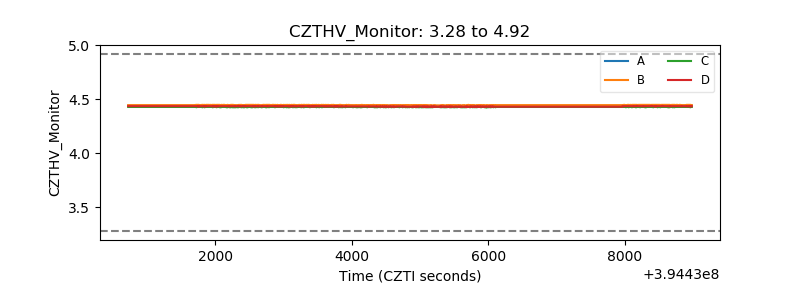 |
| D_VDD | 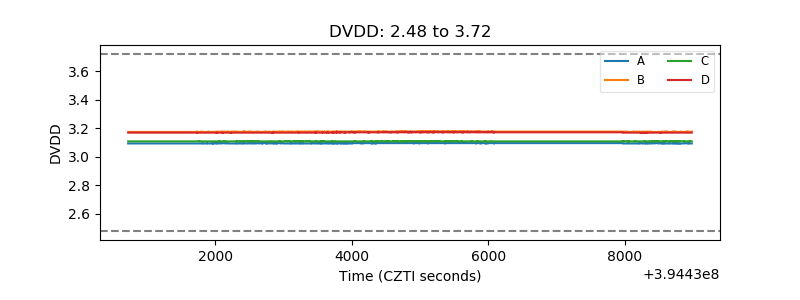 |
| Temperature 1 | 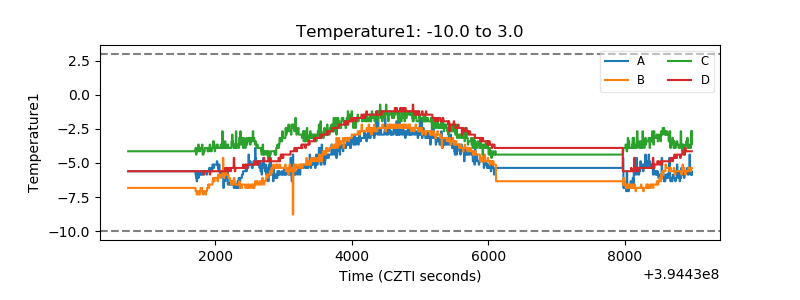 |
| Veto HV Monitor | 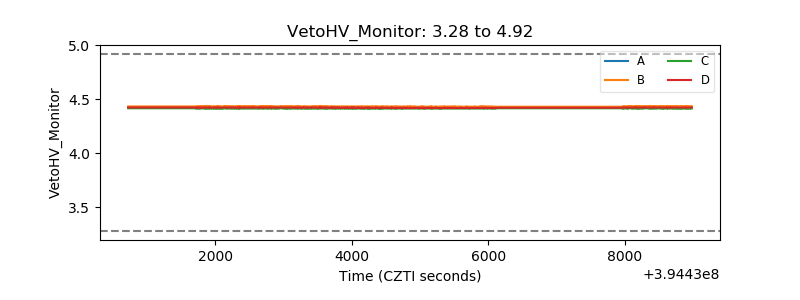 |
| Veto LLD | 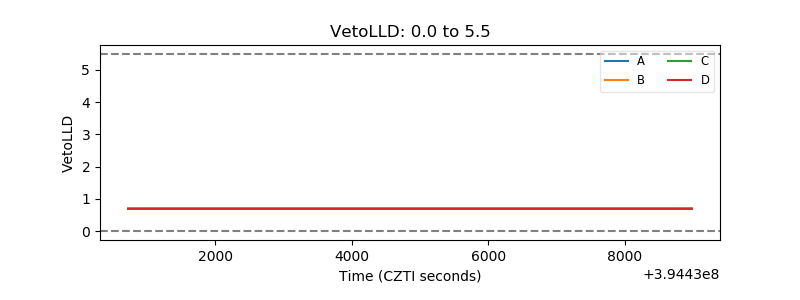 |
| Alpha Counter | 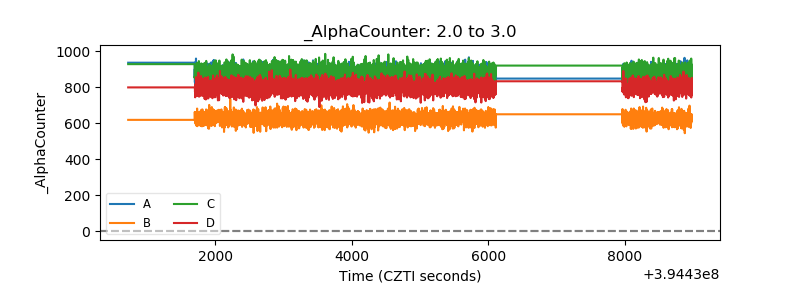 |
| _CPM_Rate | 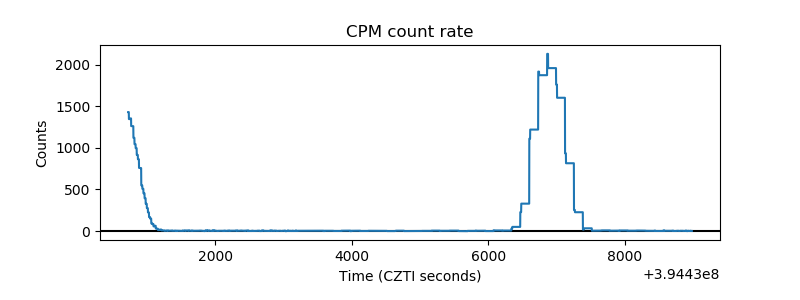 |
| CZT Counter | 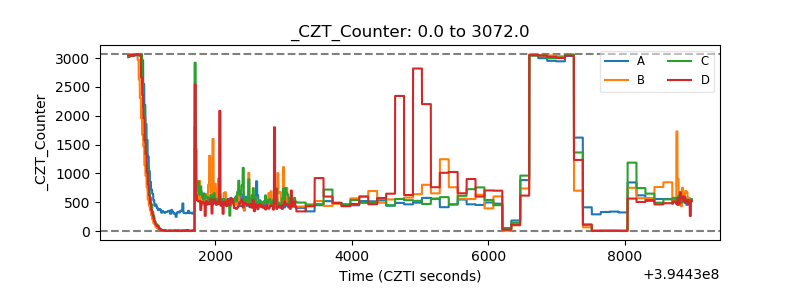 |
| +2.5 Volts monitor |  |
| +5 Volts monitor |  |
| _ROLL_ROT | 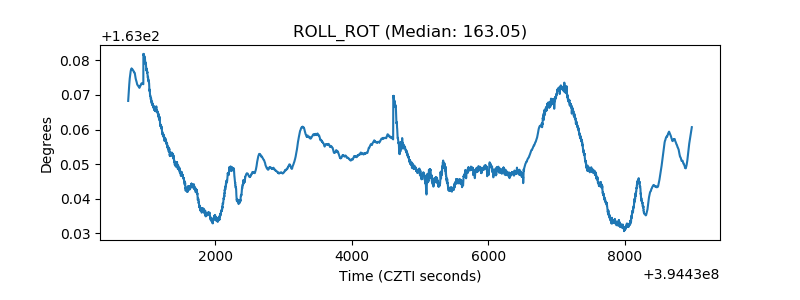 |
| _Roll_DEC | 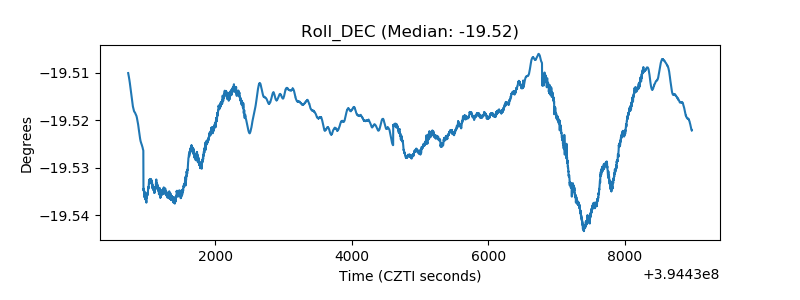 |
| _Roll_RA | 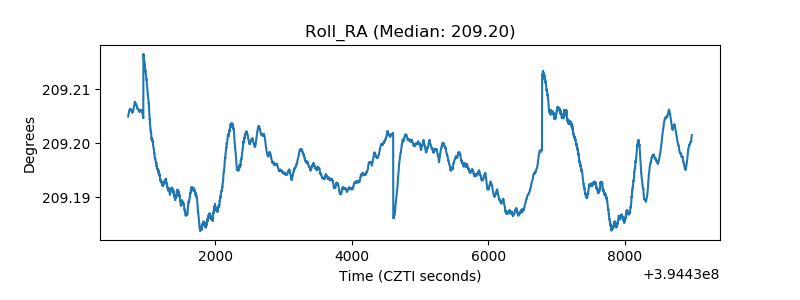 |
| Veto Counter | 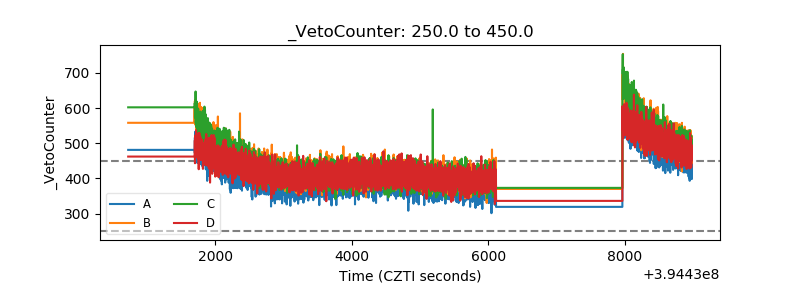 |