| Param | Original file | Final file |
|---|---|---|
| Filename | modeM0/AS1A11_089T02_9000005216_36551cztM0_level2.evt | modeM0/AS1A11_089T02_9000005216_36551cztM0_level2_quad_clean.evt |
| Size (bytes) | 431,199,360 | 94,625,280 |
| Size | 411.2 MB | 90.2 MB |
| Events in quadrant A | 2,959,627 | 648,358 |
| Events in quadrant B | 2,953,953 | 645,658 |
| Events in quadrant C | 3,169,696 | 627,440 |
| Events in quadrant D | 3,641,251 | 598,678 |
| Mode M9 | |||
|---|---|---|---|
| Quadrant | BADHDUFLAG | Total packets | Discarded packets |
| A | 0 | 38 | 0 |
| B | 0 | 38 | 0 |
| C | 0 | 38 | 0 |
| D | 0 | 39 | 0 |
| Mode M0 | |||
|---|---|---|---|
| Quadrant | BADHDUFLAG | Total packets | Discarded packets |
| A | 0 | 11780 | 3 |
| B | 0 | 11733 | 2 |
| C | 0 | 12389 | 2 |
| D | 0 | 14256 | 2 |
| Mode SS | |||
|---|---|---|---|
| Quadrant | BADHDUFLAG | Total packets | Discarded packets |
| A | 0 | 102 | 0 |
| B | 0 | 102 | 0 |
| C | 0 | 102 | 0 |
| D | 0 | 102 | 0 |
| Quadrant | Total seconds | Saturated seconds | Saturation percentage |
|---|---|---|---|
| A | 4922 | 32 | 0.650142% |
| B | 4922 | 72 | 1.462820% |
| C | 4922 | 157 | 3.189760% |
| D | 4922 | 88 | 1.787891% |
Noise dominated data is calculated using 1-second bins in cleaned event files. If a bin has >2000 counts, and if more than 50% of those come from <1% of pixels, then it is considered to be noise-dominated and hence unusable.
| Quadrant | # 1 sec bins | Bins with >0 counts | Bins with >2000 counts | High rate bins dominated by noise | Noise dominated (total time) | Noise dominated (detector-on time) | Marked lightcurve |
|---|---|---|---|---|---|---|---|
| A | 7075 | 4923 | 29 | 29 | 0.41% | 0.59% | 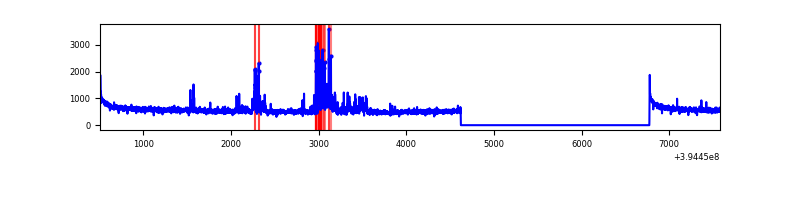 |
| B | 7075 | 4923 | 40 | 40 | 0.57% | 0.81% | 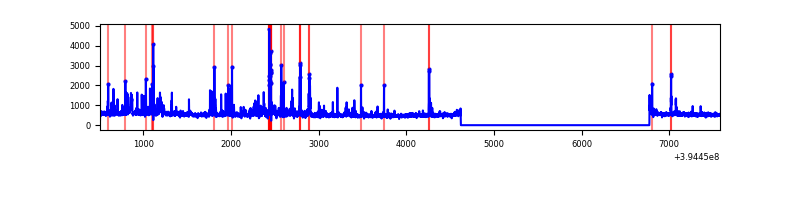 |
| C | 7075 | 4923 | 95 | 95 | 1.34% | 1.93% | 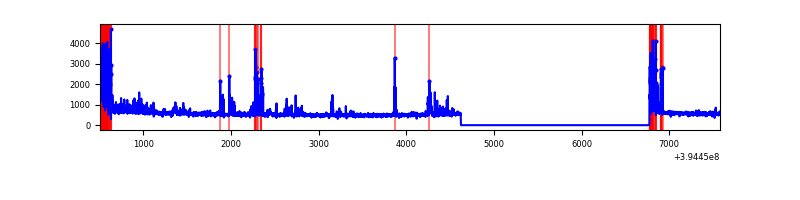 |
| D | 7075 | 4923 | 71 | 71 | 1.00% | 1.44% | 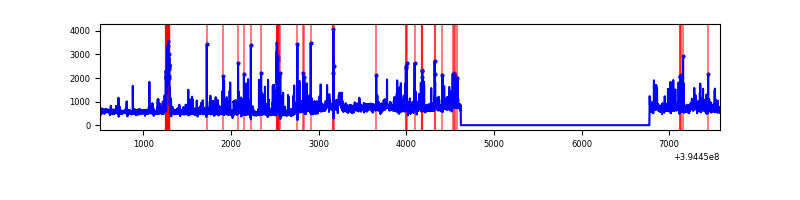 |
Top three noisy pixels from each quadrant. If the there are fewer than three noisy pixels in the level2.evt file, extra rows are filled as -1
| Pixel properties | Quadrant properties | ||||||
|---|---|---|---|---|---|---|---|
| Quadrant | DetID | PixID | Counts | Sigma | Mean | Median | Sigma |
| A | 15 | 223 | 280199 | 2201.38 | 639 | 628 | 127.0 |
| A | 10 | 83 | 194080 | 1523.27 | 639 | 628 | 127.0 |
| A | 9 | 143 | 8090 | 58.76 | 639 | 628 | 127.0 |
| B | 5 | 255 | 253710 | 2160.24 | 620 | 605 | 117.2 |
| B | 5 | 172 | 79984 | 677.49 | 620 | 605 | 117.2 |
| B | 15 | 32 | 48656 | 410.11 | 620 | 605 | 117.2 |
| C | 0 | 10 | 585270 | 4226.97 | 600 | 605 | 138.3 |
| C | 15 | 214 | 213525 | 1539.35 | 600 | 605 | 138.3 |
| C | 6 | 255 | 26374 | 186.3 | 600 | 605 | 138.3 |
| D | 12 | 235 | 629869 | 4205.38 | 613 | 597 | 149.6 |
| D | 2 | 153 | 164707 | 1096.74 | 613 | 597 | 149.6 |
| D | 10 | 199 | 115553 | 768.24 | 613 | 597 | 149.6 |
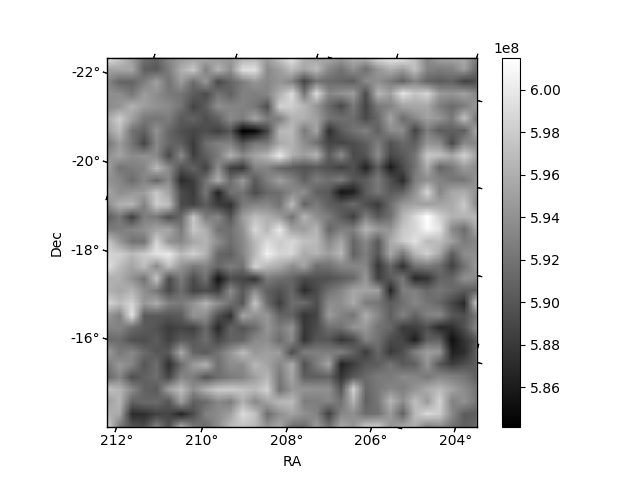
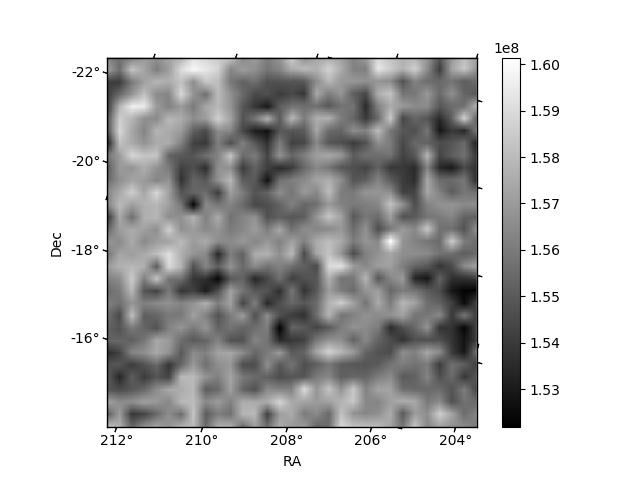
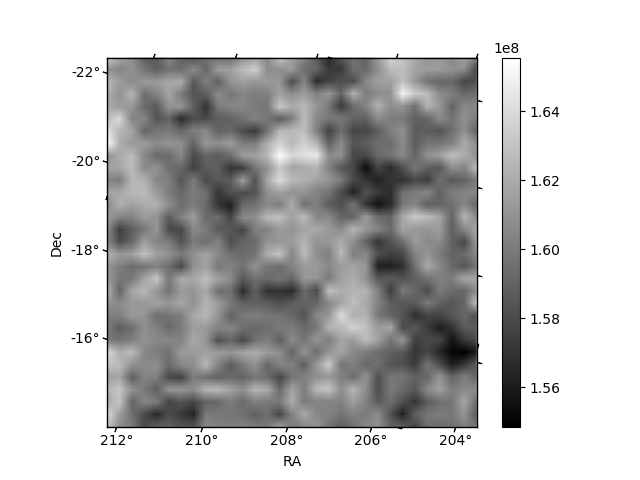
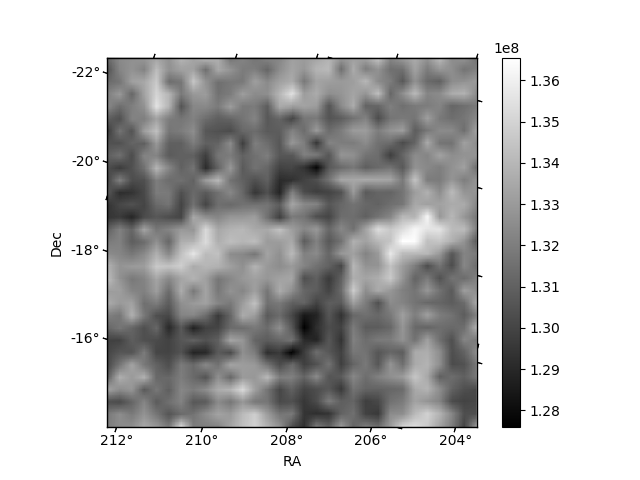
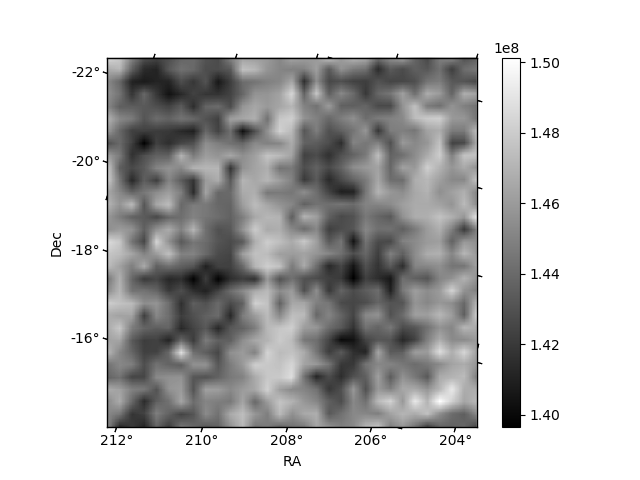
Histogram calculated using DETX and DETY for each event in the final _common_clean file
| Quadrant A | 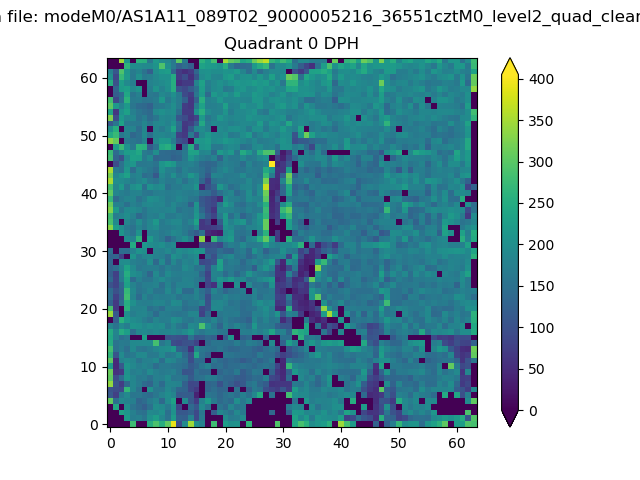 |
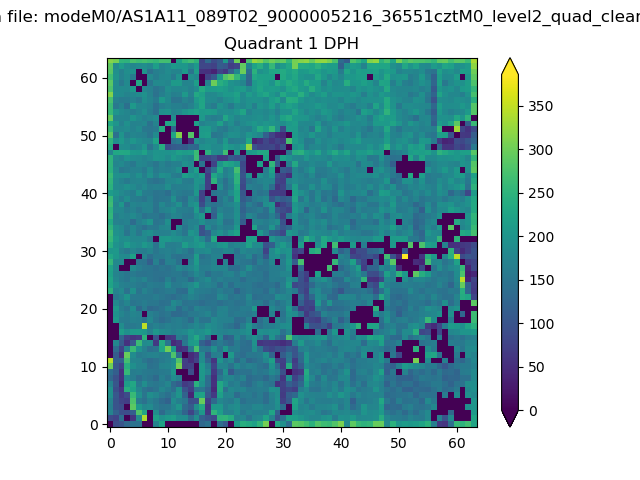 |
Quadrant B |
|---|---|---|---|
| Quadrant D | 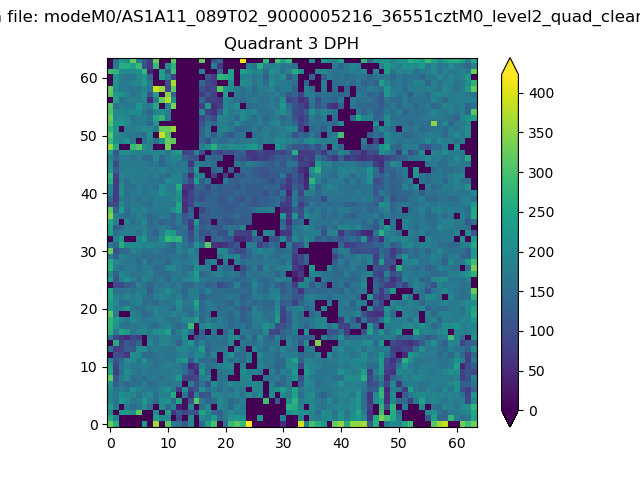 |
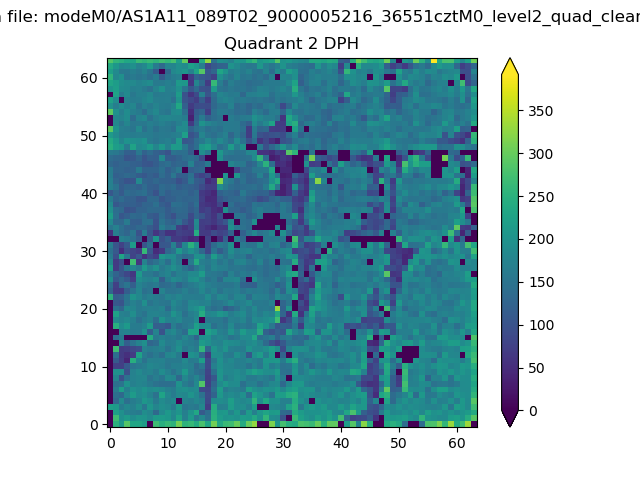 |
Quadrant C |
| Plot type | Count rate plots | Images |
|---|---|---|
| Comparison with Poisson distribution Blue bars denote a histogram of data divided into 1 sec bins. Red curve is a Poisson curve with rate = median count rate of data. |
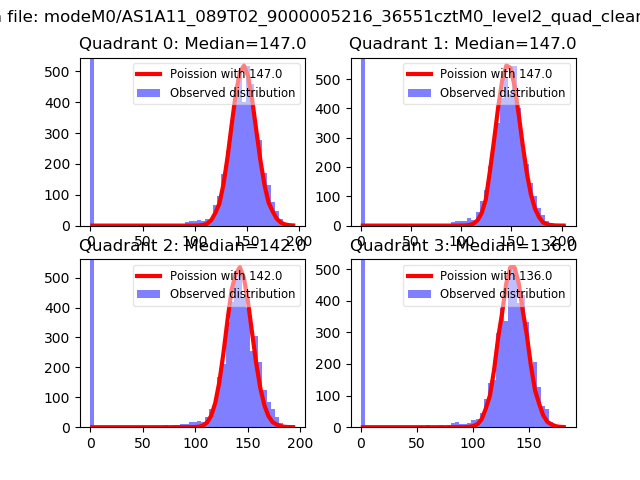 |
 |
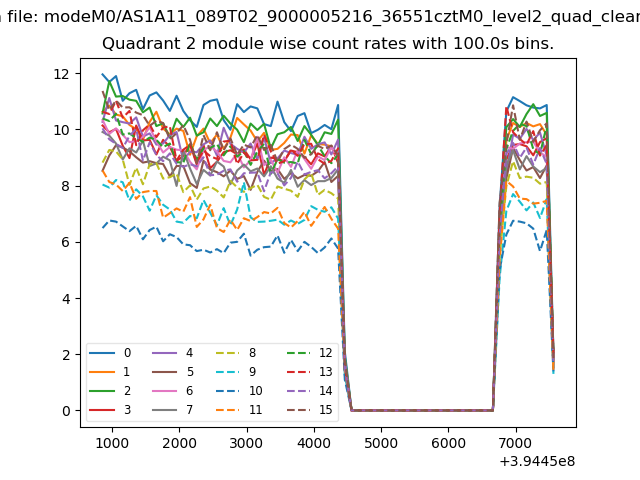
| Quadrant-wise count rates Data is divided into 100 sec bins |
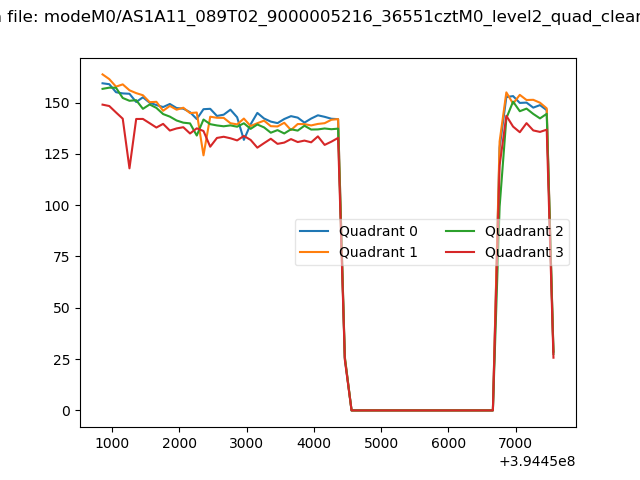 |
|
| Module-wise count rates for Quadrant A Data is divided into 100 sec bins |
 |
 |
| Module-wise count rates for Quadrant B Data is divided into 100 sec bins |
 |
 |
| Module-wise count rates for Quadrant C Data is divided into 100 sec bins |
 |
 |
| Module-wise count rates for Quadrant D Data is divided into 100 sec bins |
 |
 |
| Parameter | Plot |
|---|---|
| CZT HV Monitor | 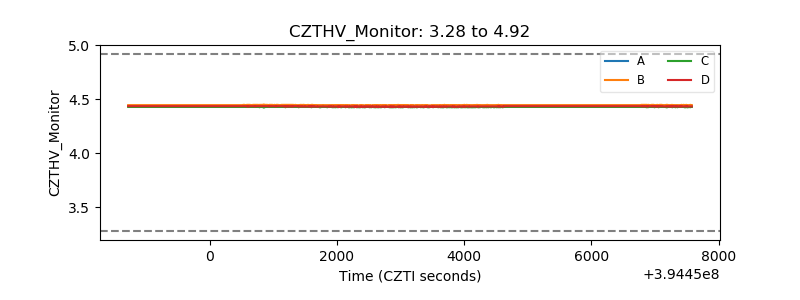 |
| D_VDD | 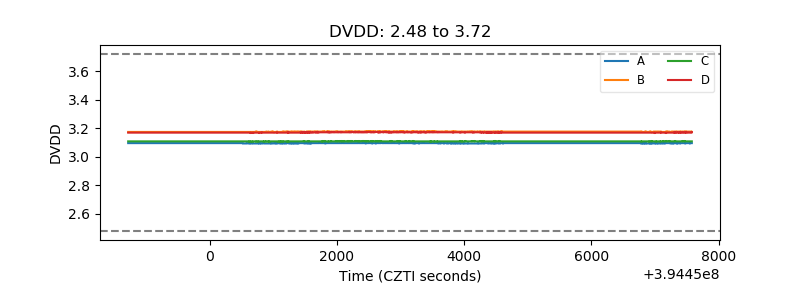 |
| Temperature 1 | 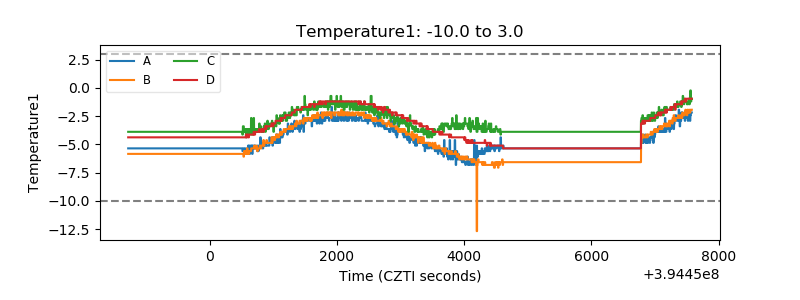 |
| Veto HV Monitor |  |
| Veto LLD | 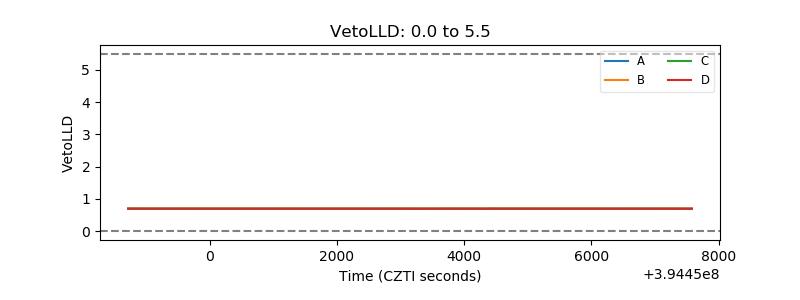 |
| Alpha Counter | 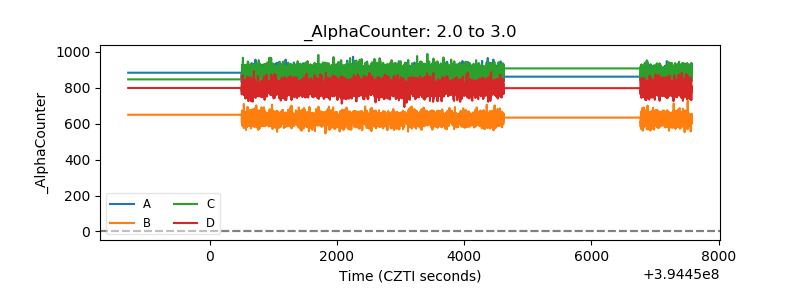 |
| _CPM_Rate | 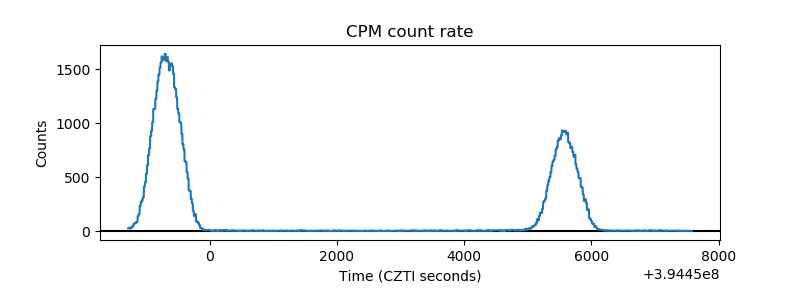 |
| CZT Counter | 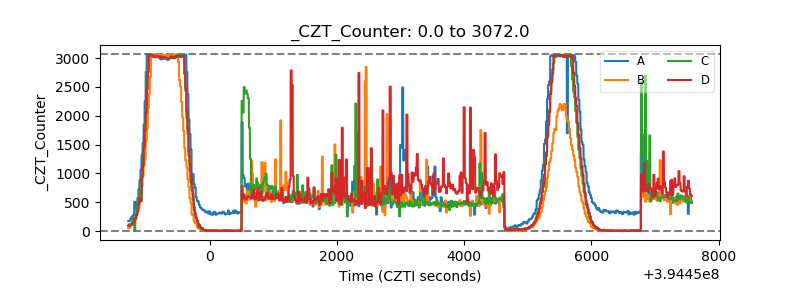 |
| +2.5 Volts monitor |  |
| +5 Volts monitor |  |
| _ROLL_ROT | 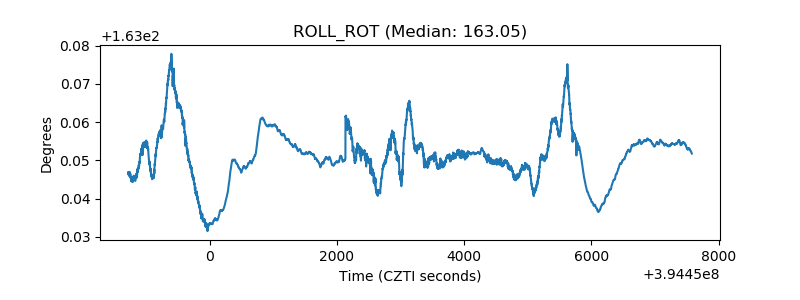 |
| _Roll_DEC |  |
| _Roll_RA | 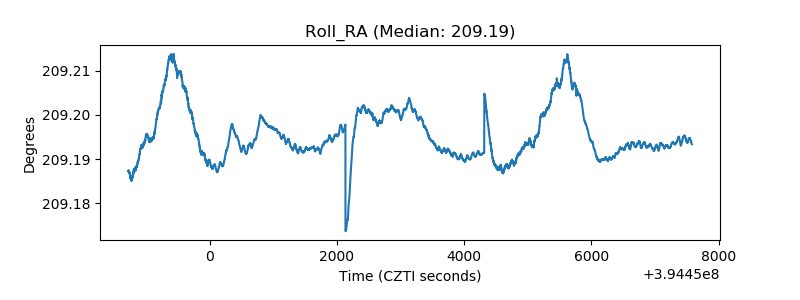 |
| Veto Counter |  |