| Param | Original file | Final file |
|---|---|---|
| Filename | modeM0/AS1A11_049T02_9000005220cztM0_level2.fits | modeM0/AS1A11_049T02_9000005220cztM0_level2_quad_clean.evt |
| Size (bytes) | 474,621,120 | 437,103,360 |
| Size | 452.6 MB | 416.9 MB |
| Events in quadrant A | 2,929,962 | 2,628,353 |
| Events in quadrant B | 2,764,298 | 2,531,085 |
| Events in quadrant C | 2,829,738 | 2,458,394 |
| Events in quadrant D | 2,456,260 | 2,225,877 |
| Mode M9 | |||
|---|---|---|---|
| Quadrant | BADHDUFLAG | Total packets | Discarded packets |
| A | 0 | 180 | 0 |
| B | 0 | 180 | 0 |
| C | 0 | 180 | 0 |
| D | 0 | 180 | 0 |
| Mode M0 | |||
|---|---|---|---|
| Quadrant | BADHDUFLAG | Total packets | Discarded packets |
| A | 0 | 109873 | 0 |
| B | 0 | 119755 | 0 |
| C | 0 | 109872 | 0 |
| D | 0 | 129231 | 0 |
| Mode SS | |||
|---|---|---|---|
| Quadrant | BADHDUFLAG | Total packets | Discarded packets |
| A | 0 | 1012 | 0 |
| B | 0 | 1012 | 0 |
| C | 0 | 1012 | 0 |
| D | 0 | 1012 | 0 |
| Quadrant | Total seconds | Saturated seconds | Saturation percentage |
|---|---|---|---|
| A | 49438 | 605 | 1.223755% |
| B | 49438 | 1392 | 2.815648% |
| C | 49438 | 797 | 1.612120% |
| D | 49438 | 1486 | 3.005785% |
Noise dominated data is calculated using 1-second bins in cleaned event files. If a bin has >2000 counts, and if more than 50% of those come from <1% of pixels, then it is considered to be noise-dominated and hence unusable.
| Quadrant | # 1 sec bins | Bins with >0 counts | Bins with >2000 counts | High rate bins dominated by noise | Noise dominated (total time) | Noise dominated (detector-on time) | Marked lightcurve |
|---|---|---|---|---|---|---|---|
| A | 67449 | 49433 | 0 | 0 | 0.00% | 0.00% |  |
| B | 67449 | 49431 | 0 | 0 | 0.00% | 0.00% |  |
| C | 67449 | 49420 | 0 | 0 | 0.00% | 0.00% |  |
| D | 67449 | 49375 | 0 | 0 | 0.00% | 0.00% |  |
Top three noisy pixels from each quadrant. If the there are fewer than three noisy pixels in the level2.evt file, extra rows are filled as -1
| Pixel properties | Quadrant properties | ||||||
|---|---|---|---|---|---|---|---|
| Quadrant | DetID | PixID | Counts | Sigma | Mean | Median | Sigma |
| A | 7 | 110 | 2392 | 8.72 | 766 | 723 | 191.3 |
| A | 9 | 19 | 2329 | 8.39 | 766 | 723 | 191.3 |
| A | 0 | 29 | 2272 | 8.1 | 766 | 723 | 191.3 |
| B | 2 | 9 | 2405 | 11.9 | 731 | 700 | 143.3 |
| B | 3 | 80 | 2167 | 10.24 | 731 | 700 | 143.3 |
| B | 2 | 8 | 1982 | 8.95 | 731 | 700 | 143.3 |
| C | 1 | 81 | 2309 | 8.44 | 748 | 704 | 190.1 |
| C | 3 | 202 | 2299 | 8.39 | 748 | 704 | 190.1 |
| C | 3 | 203 | 2275 | 8.26 | 748 | 704 | 190.1 |
| D | 10 | 189 | 1852 | 6.49 | 704 | 645 | 185.9 |
| D | 7 | 3 | 1801 | 6.22 | 704 | 645 | 185.9 |
| D | 10 | 113 | 1759 | 5.99 | 704 | 645 | 185.9 |
Histogram calculated using DETX and DETY for each event in the final _common_clean file
| Quadrant A |  |
 |
Quadrant B |
|---|---|---|---|
| Quadrant D |  |
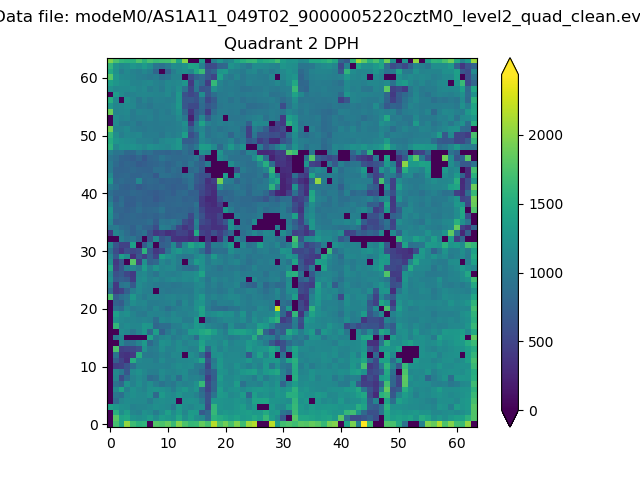 |
Quadrant C |
| Plot type | Count rate plots | Images |
|---|---|---|
| Comparison with Poisson distribution Blue bars denote a histogram of data divided into 1 sec bins. Red curve is a Poisson curve with rate = median count rate of data. |
 |
 |
| Quadrant-wise count rates Data is divided into 100 sec bins |
 |
|
| Module-wise count rates for Quadrant A Data is divided into 100 sec bins |
 |
 |
| Module-wise count rates for Quadrant B Data is divided into 100 sec bins |
 |
 |
| Module-wise count rates for Quadrant C Data is divided into 100 sec bins |
 |
 |
| Module-wise count rates for Quadrant D Data is divided into 100 sec bins |
 |
 |
| Parameter | Plot |
|---|---|
| CZT HV Monitor |  |
| D_VDD |  |
| Temperature 1 |  |
| Veto HV Monitor |  |
| Veto LLD |  |
| Alpha Counter |  |
| _CPM_Rate |  |
| CZT Counter |  |
| +2.5 Volts monitor |  |
| +5 Volts monitor |  |
| _ROLL_ROT |  |
| _Roll_DEC |  |
| _Roll_RA |  |
| Veto Counter |  |