| Param | Original file | Final file |
|---|---|---|
| Filename | modeM0/AS1A11_049T02_9000005220_36555cztM0_level2.evt | modeM0/AS1A11_049T02_9000005220_36555cztM0_level2_quad_clean.evt |
| Size (bytes) | 525,306,240 | 70,706,880 |
| Size | 501.0 MB | 67.4 MB |
| Events in quadrant A | 4,372,560 | 432,970 |
| Events in quadrant B | 3,227,135 | 446,960 |
| Events in quadrant C | 3,223,587 | 434,950 |
| Events in quadrant D | 4,694,717 | 422,414 |
| Mode M9 | |||
|---|---|---|---|
| Quadrant | BADHDUFLAG | Total packets | Discarded packets |
| A | 0 | 19 | 0 |
| B | 0 | 19 | 0 |
| C | 0 | 19 | 0 |
| D | 0 | 20 | 0 |
| Mode M0 | |||
|---|---|---|---|
| Quadrant | BADHDUFLAG | Total packets | Discarded packets |
| A | 0 | 16691 | 3 |
| B | 0 | 13337 | 2 |
| C | 0 | 13237 | 2 |
| D | 0 | 18034 | 2 |
| Mode SS | |||
|---|---|---|---|
| Quadrant | BADHDUFLAG | Total packets | Discarded packets |
| A | 0 | 116 | 0 |
| B | 0 | 116 | 0 |
| C | 0 | 116 | 0 |
| D | 0 | 116 | 0 |
| Quadrant | Total seconds | Saturated seconds | Saturation percentage |
|---|---|---|---|
| A | 5776 | 409 | 7.081025% |
| B | 5776 | 100 | 1.731302% |
| C | 5776 | 136 | 2.354571% |
| D | 5776 | 184 | 3.185596% |
Noise dominated data is calculated using 1-second bins in cleaned event files. If a bin has >2000 counts, and if more than 50% of those come from <1% of pixels, then it is considered to be noise-dominated and hence unusable.
| Quadrant | # 1 sec bins | Bins with >0 counts | Bins with >2000 counts | High rate bins dominated by noise | Noise dominated (total time) | Noise dominated (detector-on time) | Marked lightcurve |
|---|---|---|---|---|---|---|---|
| A | 7149 | 5777 | 278 | 278 | 3.89% | 4.81% | 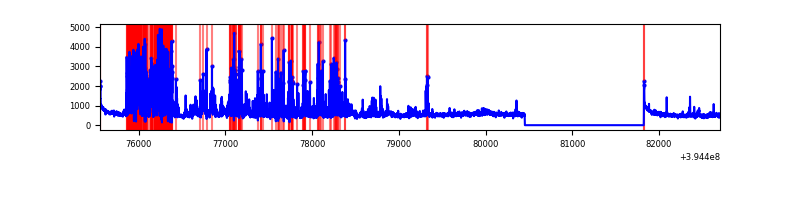 |
| B | 7149 | 5777 | 61 | 61 | 0.85% | 1.06% | 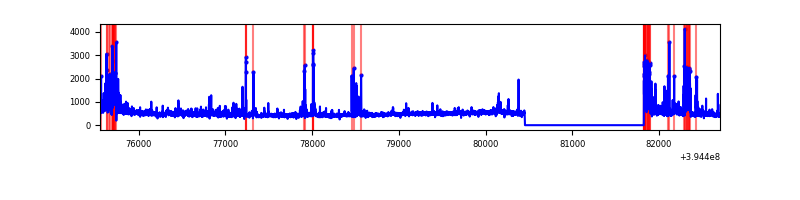 |
| C | 7149 | 5777 | 102 | 102 | 1.43% | 1.77% | 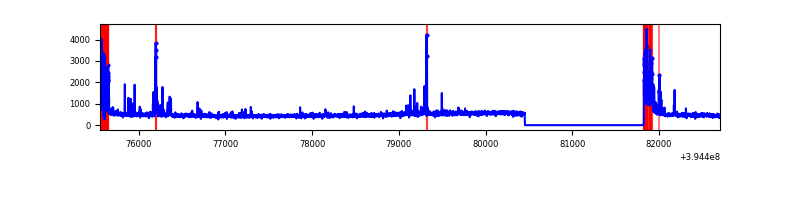 |
| D | 7149 | 5777 | 135 | 135 | 1.89% | 2.34% | 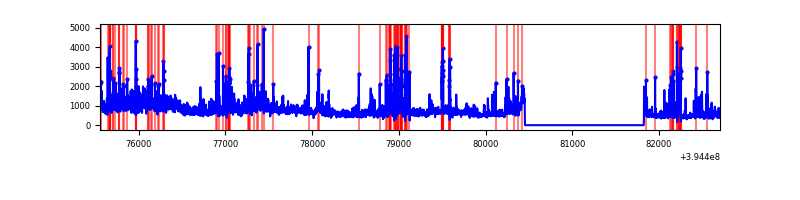 |
Top three noisy pixels from each quadrant. If the there are fewer than three noisy pixels in the level2.evt file, extra rows are filled as -1
| Pixel properties | Quadrant properties | ||||||
|---|---|---|---|---|---|---|---|
| Quadrant | DetID | PixID | Counts | Sigma | Mean | Median | Sigma |
| A | 15 | 223 | 1562660 | 11993.59 | 641 | 629 | 130.2 |
| A | 10 | 83 | 216586 | 1658.16 | 641 | 629 | 130.2 |
| A | 13 | 248 | 66941 | 509.16 | 641 | 629 | 130.2 |
| B | 5 | 172 | 214296 | 1694.09 | 652 | 635 | 126.1 |
| B | 5 | 255 | 173927 | 1374.01 | 652 | 635 | 126.1 |
| B | 0 | 219 | 129520 | 1021.91 | 652 | 635 | 126.1 |
| C | 0 | 10 | 358355 | 2428.02 | 628 | 632 | 147.3 |
| C | 15 | 214 | 243993 | 1651.79 | 628 | 632 | 147.3 |
| C | 14 | 254 | 128019 | 864.63 | 628 | 632 | 147.3 |
| D | 12 | 235 | 1393853 | 9002.51 | 630 | 611 | 154.8 |
| D | 2 | 250 | 235785 | 1519.59 | 630 | 611 | 154.8 |
| D | 13 | 171 | 150331 | 967.42 | 630 | 611 | 154.8 |
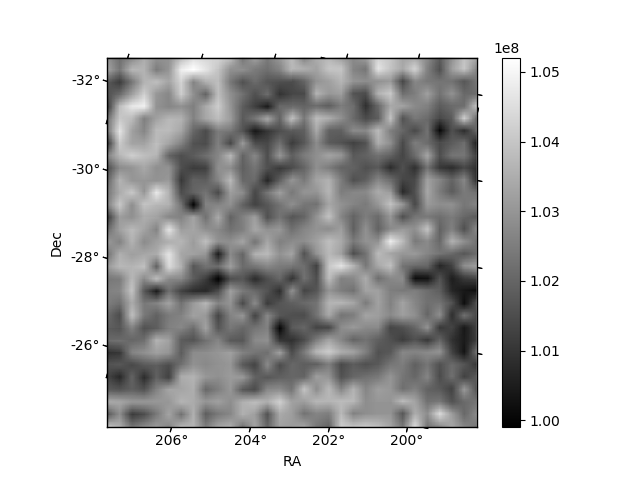
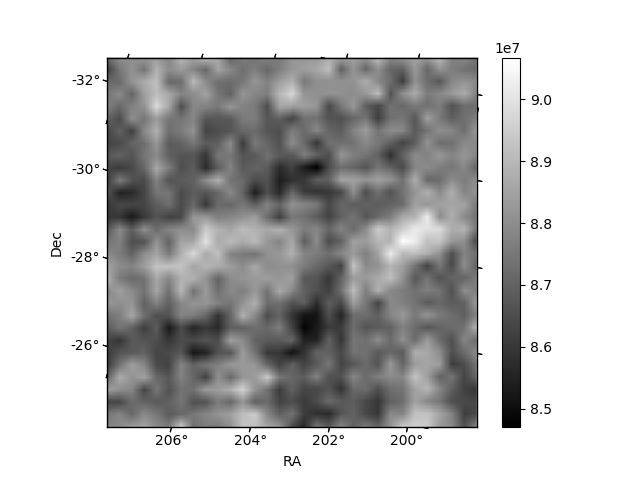
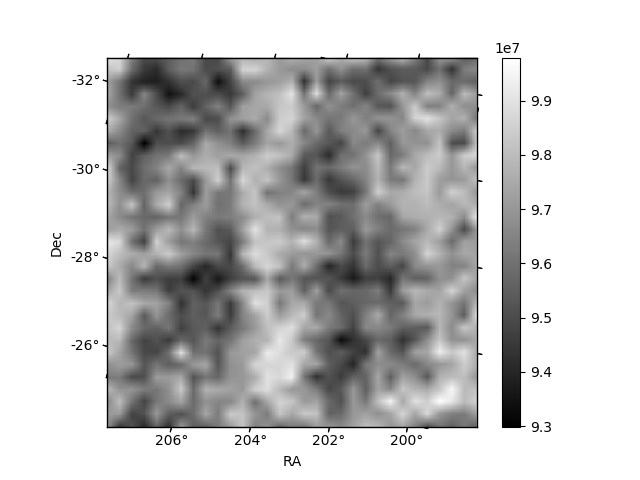
Histogram calculated using DETX and DETY for each event in the final _common_clean file
| Quadrant A |  |
 |
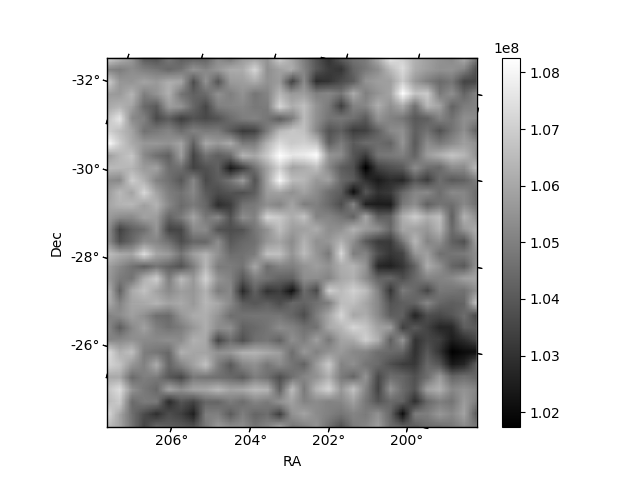
Quadrant B |
|---|---|---|---|
| Quadrant D |  |
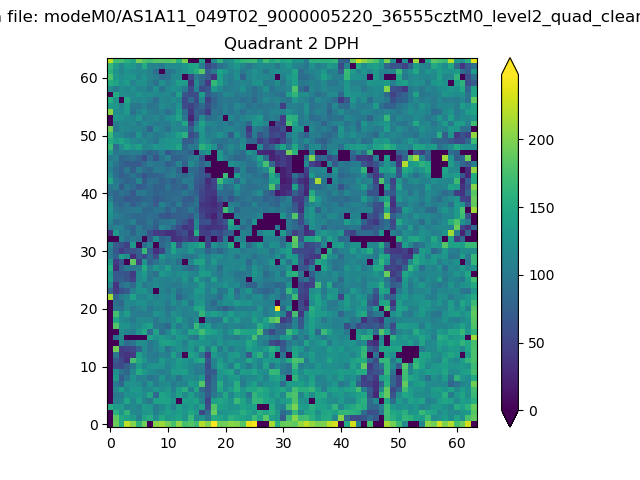 |
Quadrant C |
| Plot type | Count rate plots | Images |
|---|---|---|
| Comparison with Poisson distribution Blue bars denote a histogram of data divided into 1 sec bins. Red curve is a Poisson curve with rate = median count rate of data. |
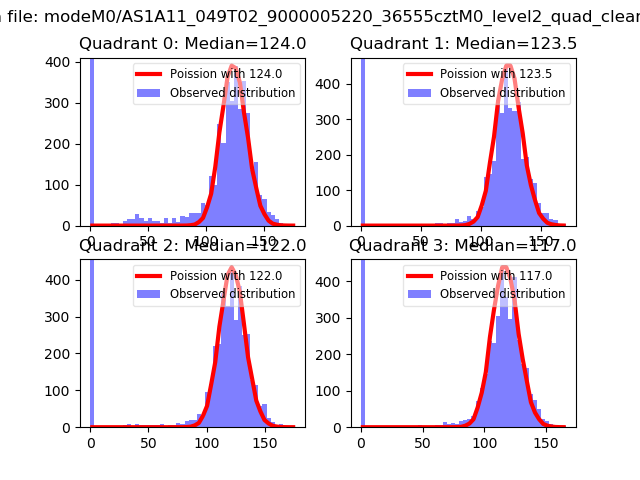 |
 |
| Quadrant-wise count rates Data is divided into 100 sec bins |
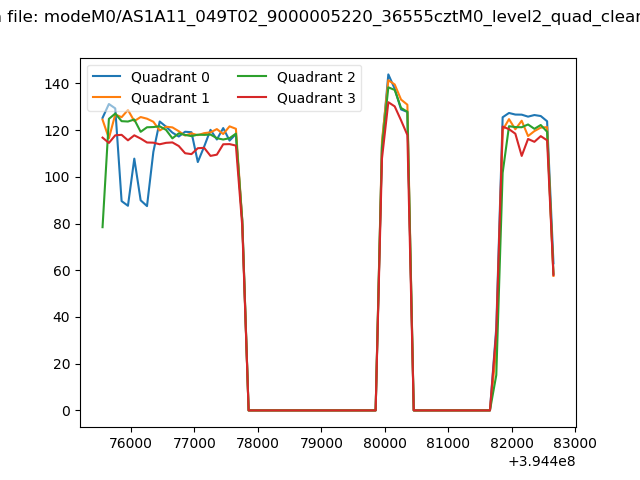 |
|
| Module-wise count rates for Quadrant A Data is divided into 100 sec bins |
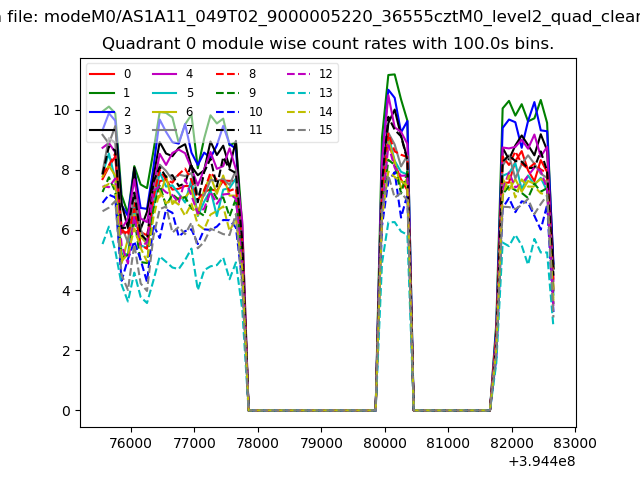 |
 |
| Module-wise count rates for Quadrant B Data is divided into 100 sec bins |
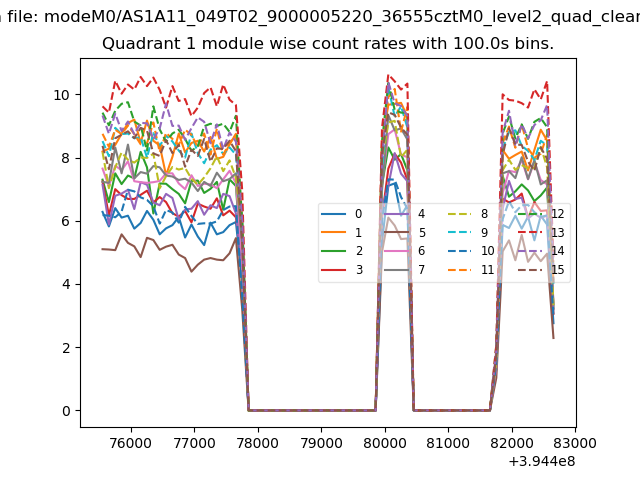 |
 |
| Module-wise count rates for Quadrant C Data is divided into 100 sec bins |
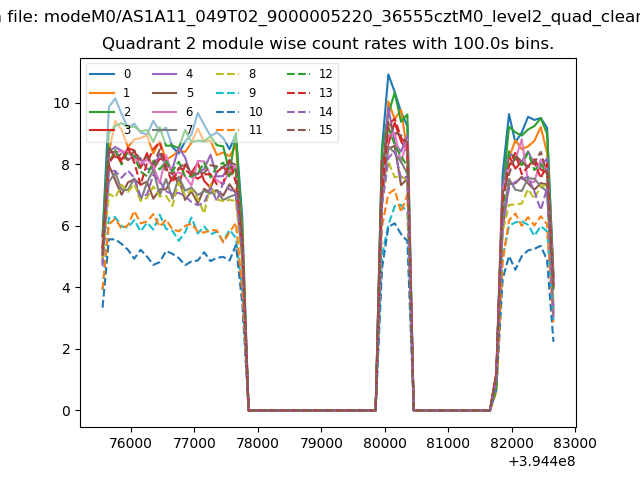 |
 |
| Module-wise count rates for Quadrant D Data is divided into 100 sec bins |
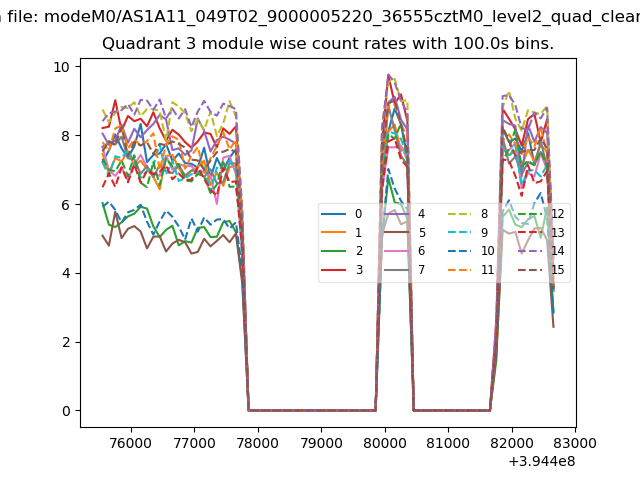 |
 |
| Parameter | Plot |
|---|---|
| CZT HV Monitor | 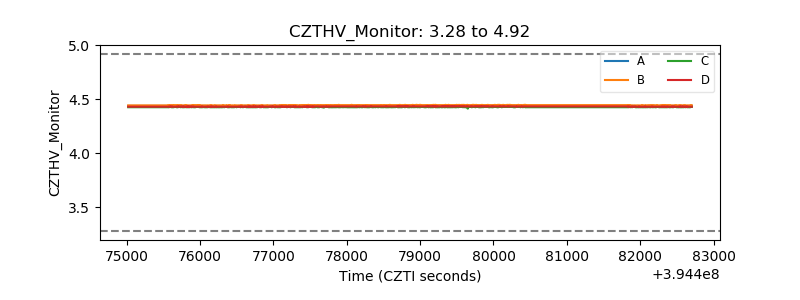 |
| D_VDD | 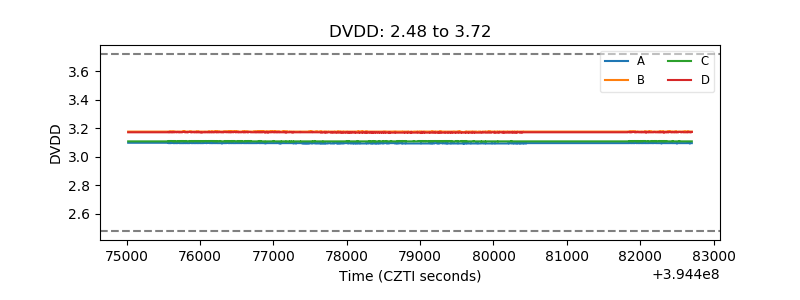 |
| Temperature 1 | 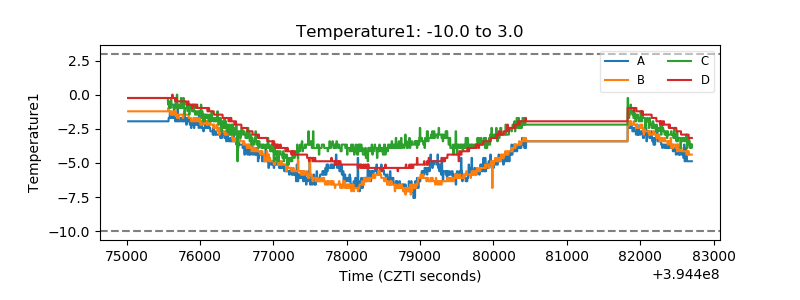 |
| Veto HV Monitor | 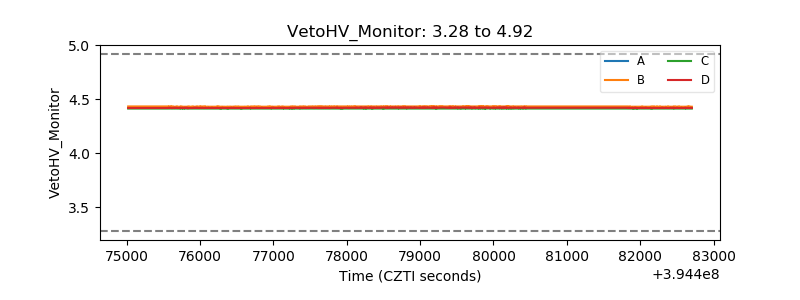 |
| Veto LLD |  |
| Alpha Counter | 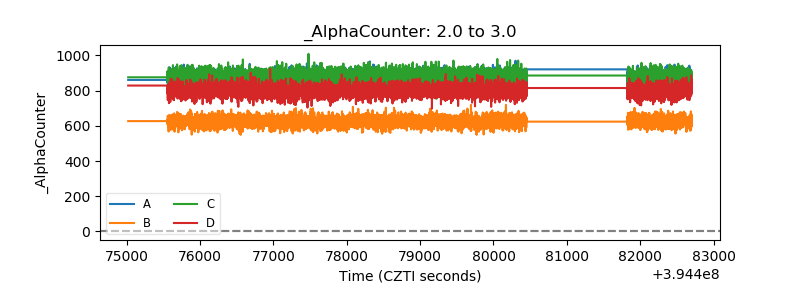 |
| _CPM_Rate | 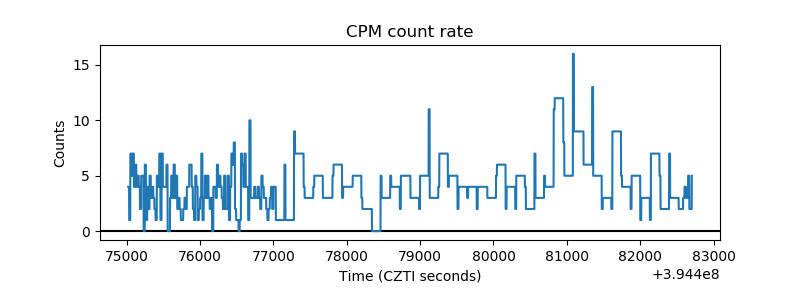 |
| CZT Counter | 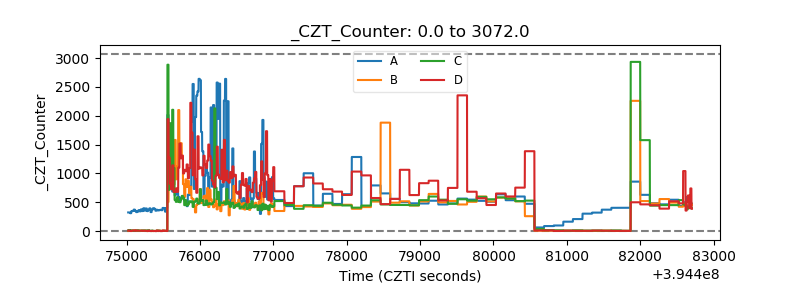 |
| +2.5 Volts monitor |  |
| +5 Volts monitor | 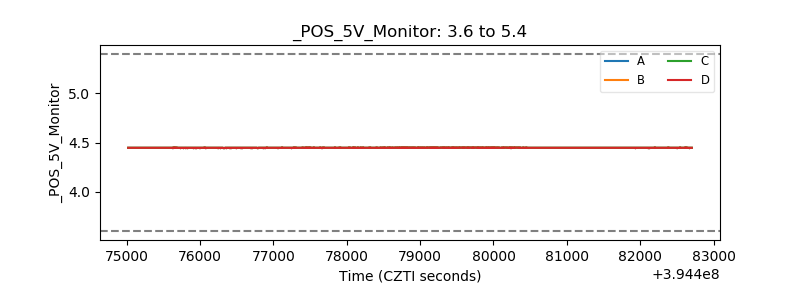 |
| _ROLL_ROT | 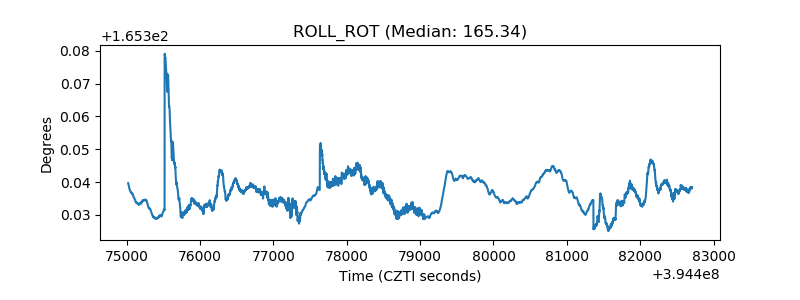 |
| _Roll_DEC | 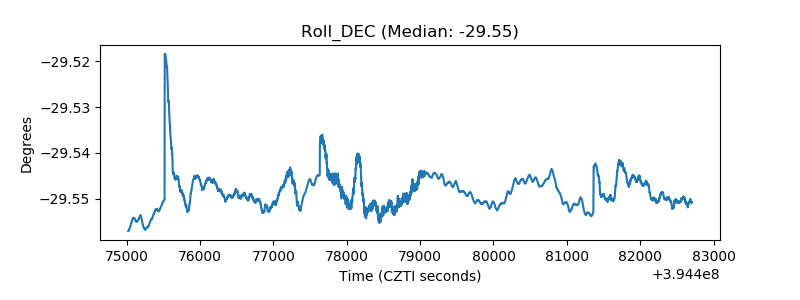 |
| _Roll_RA | 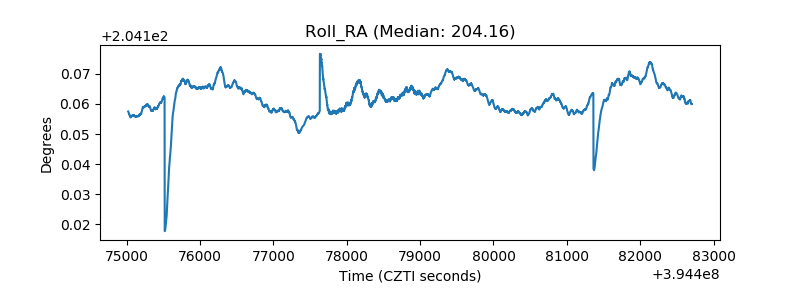 |
| Veto Counter | 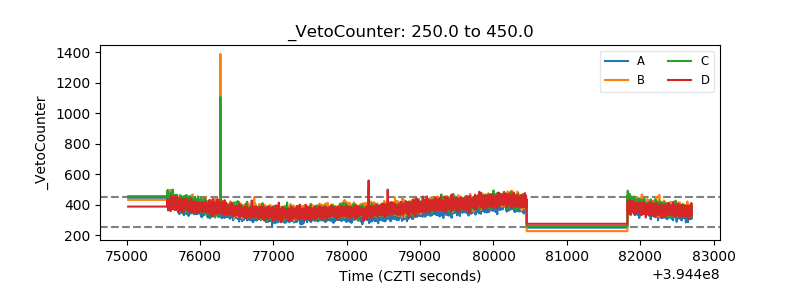 |