| Param | Original file | Final file |
|---|---|---|
| Filename | modeM0/AS1A11_049T02_9000005220_36560cztM0_level2.evt | modeM0/AS1A11_049T02_9000005220_36560cztM0_level2_quad_clean.evt |
| Size (bytes) | 464,604,480 | 61,073,280 |
| Size | 443.1 MB | 58.2 MB |
| Events in quadrant A | 2,978,091 | 368,078 |
| Events in quadrant B | 3,744,435 | 360,977 |
| Events in quadrant C | 3,263,009 | 357,765 |
| Events in quadrant D | 3,676,730 | 341,940 |
| Mode M9 | |||
|---|---|---|---|
| Quadrant | BADHDUFLAG | Total packets | Discarded packets |
| A | 0 | 31 | 0 |
| B | 0 | 31 | 0 |
| C | 0 | 31 | 0 |
| D | 0 | 31 | 0 |
| Mode M0 | |||
|---|---|---|---|
| Quadrant | BADHDUFLAG | Total packets | Discarded packets |
| A | 0 | 12559 | 3 |
| B | 0 | 15009 | 2 |
| C | 0 | 13236 | 2 |
| D | 0 | 15113 | 2 |
| Mode SS | |||
|---|---|---|---|
| Quadrant | BADHDUFLAG | Total packets | Discarded packets |
| A | 0 | 126 | 0 |
| B | 0 | 126 | 0 |
| C | 0 | 126 | 0 |
| D | 0 | 126 | 0 |
| Quadrant | Total seconds | Saturated seconds | Saturation percentage |
|---|---|---|---|
| A | 6009 | 16 | 0.266267% |
| B | 6009 | 189 | 3.145282% |
| C | 6009 | 99 | 1.647529% |
| D | 6009 | 144 | 2.396405% |
Noise dominated data is calculated using 1-second bins in cleaned event files. If a bin has >2000 counts, and if more than 50% of those come from <1% of pixels, then it is considered to be noise-dominated and hence unusable.
| Quadrant | # 1 sec bins | Bins with >0 counts | Bins with >2000 counts | High rate bins dominated by noise | Noise dominated (total time) | Noise dominated (detector-on time) | Marked lightcurve |
|---|---|---|---|---|---|---|---|
| A | 9175 | 6011 | 6 | 6 | 0.07% | 0.10% | 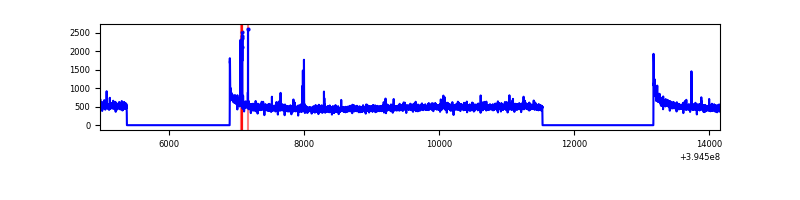 |
| B | 9175 | 6011 | 123 | 123 | 1.34% | 2.05% | 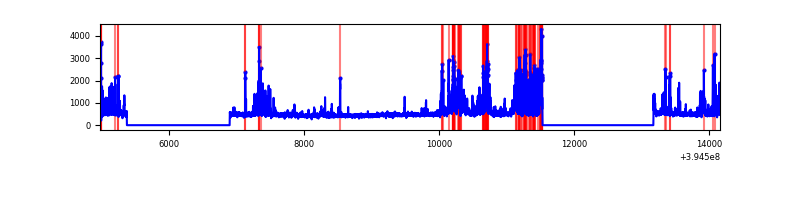 |
| C | 9175 | 6011 | 71 | 71 | 0.77% | 1.18% | 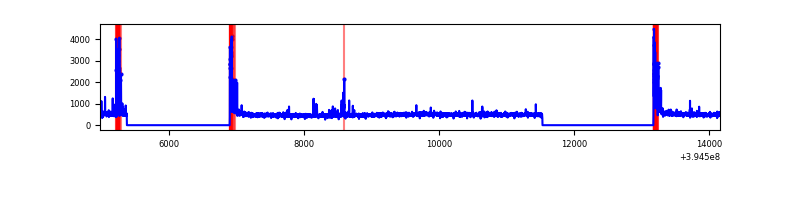 |
| D | 9175 | 6011 | 106 | 106 | 1.16% | 1.76% | 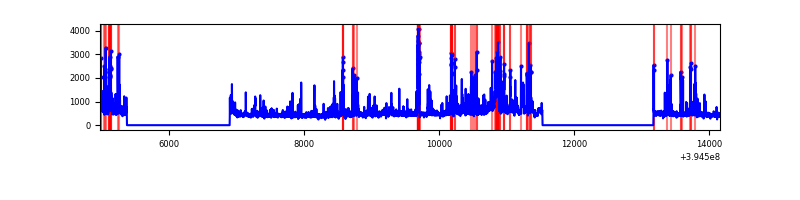 |
Top three noisy pixels from each quadrant. If the there are fewer than three noisy pixels in the level2.evt file, extra rows are filled as -1
| Pixel properties | Quadrant properties | ||||||
|---|---|---|---|---|---|---|---|
| Quadrant | DetID | PixID | Counts | Sigma | Mean | Median | Sigma |
| A | 10 | 83 | 211112 | 1499.84 | 698 | 686 | 140.3 |
| A | 9 | 143 | 36325 | 254.02 | 698 | 686 | 140.3 |
| A | 15 | 223 | 17270 | 118.21 | 698 | 686 | 140.3 |
| B | 5 | 172 | 778567 | 5955.59 | 686 | 666 | 130.6 |
| B | 5 | 255 | 105424 | 802.02 | 686 | 666 | 130.6 |
| B | 0 | 189 | 77802 | 590.55 | 686 | 666 | 130.6 |
| C | 0 | 10 | 260063 | 1657.02 | 671 | 675 | 156.5 |
| C | 15 | 214 | 258040 | 1644.1 | 671 | 675 | 156.5 |
| C | 12 | 249 | 85180 | 539.84 | 671 | 675 | 156.5 |
| D | 2 | 153 | 189583 | 1164.51 | 667 | 652 | 162.2 |
| D | 2 | 250 | 187787 | 1153.44 | 667 | 652 | 162.2 |
| D | 2 | 249 | 116454 | 713.77 | 667 | 652 | 162.2 |
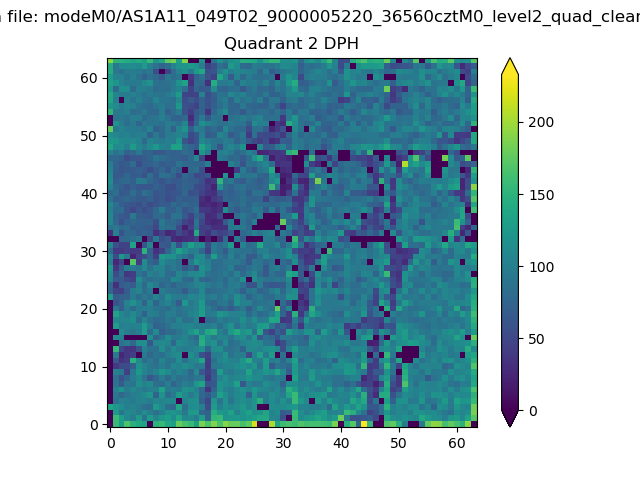
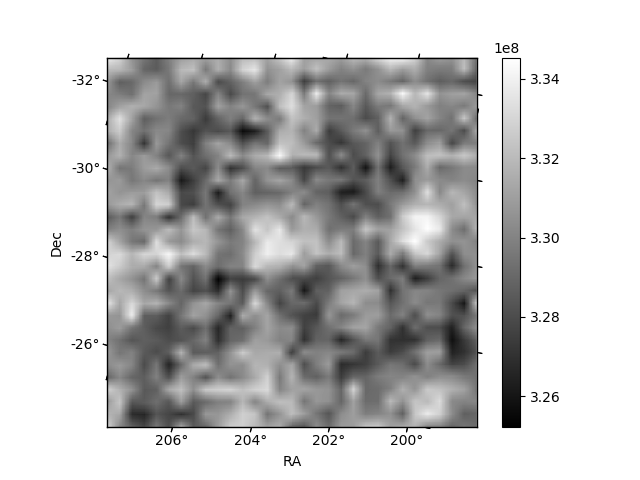
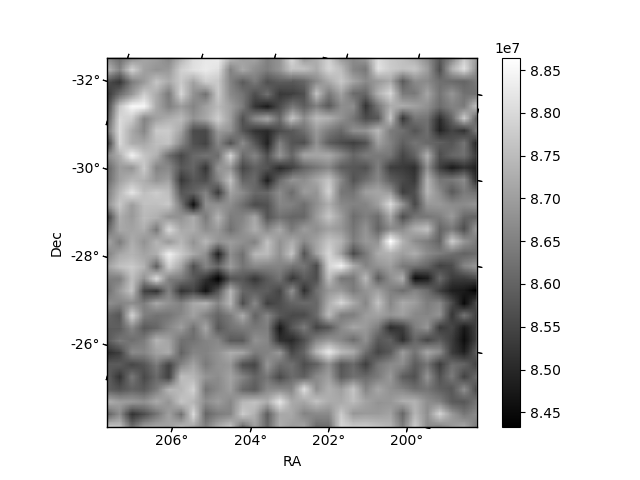
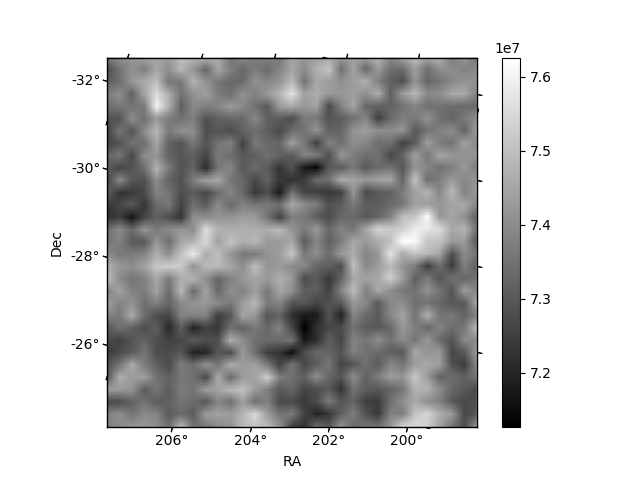
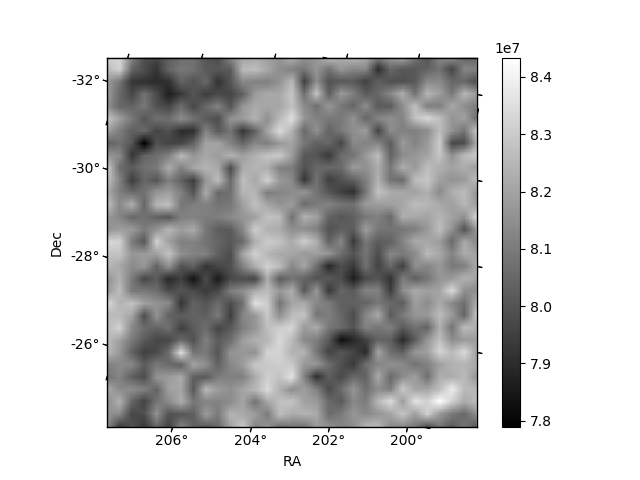
Histogram calculated using DETX and DETY for each event in the final _common_clean file
| Quadrant A | 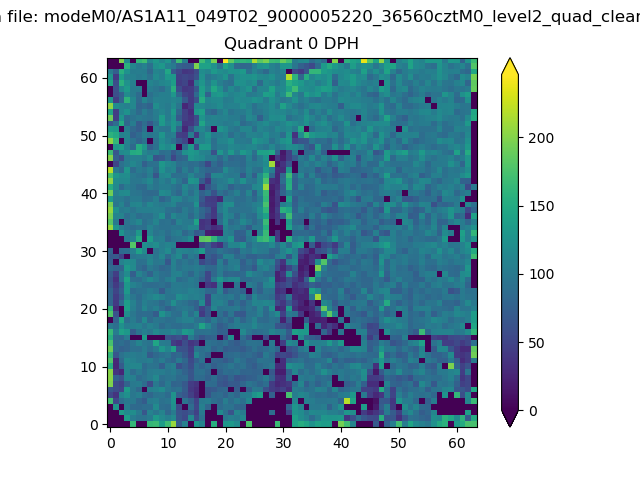 |
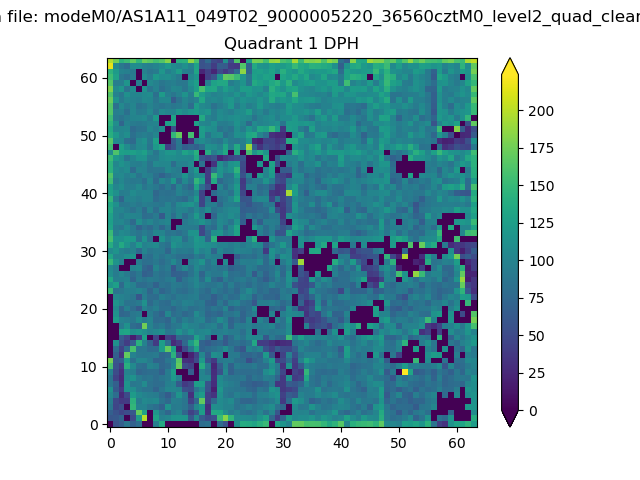 |
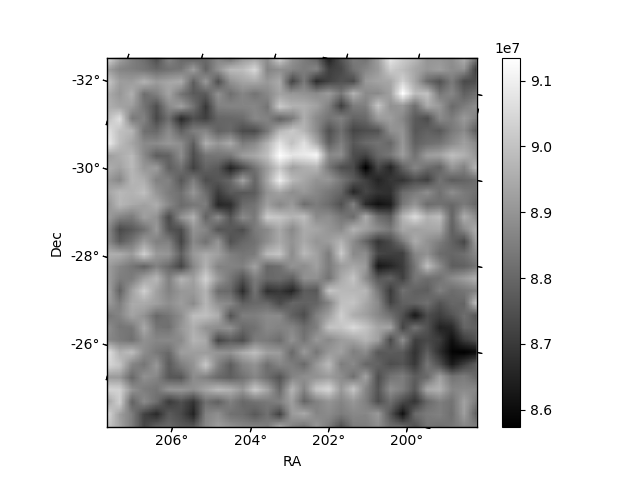
Quadrant B |
|---|---|---|---|
| Quadrant D | 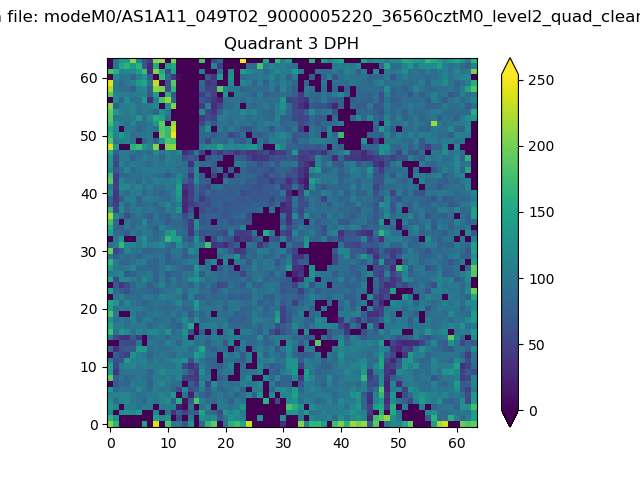 |
 |
Quadrant C |
| Plot type | Count rate plots | Images |
|---|---|---|
| Comparison with Poisson distribution Blue bars denote a histogram of data divided into 1 sec bins. Red curve is a Poisson curve with rate = median count rate of data. |
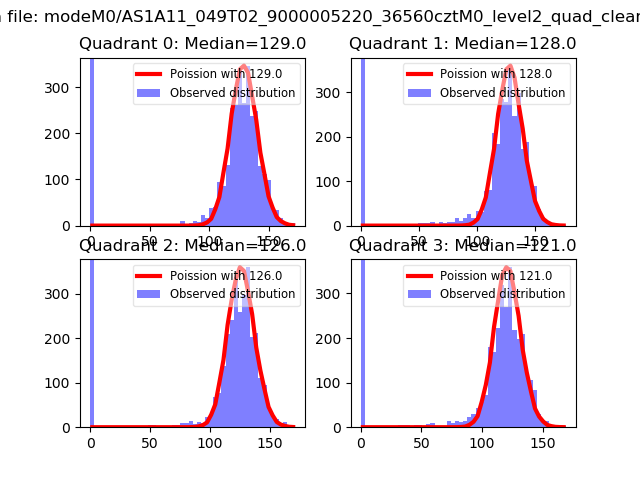 |
 |
| Quadrant-wise count rates Data is divided into 100 sec bins |
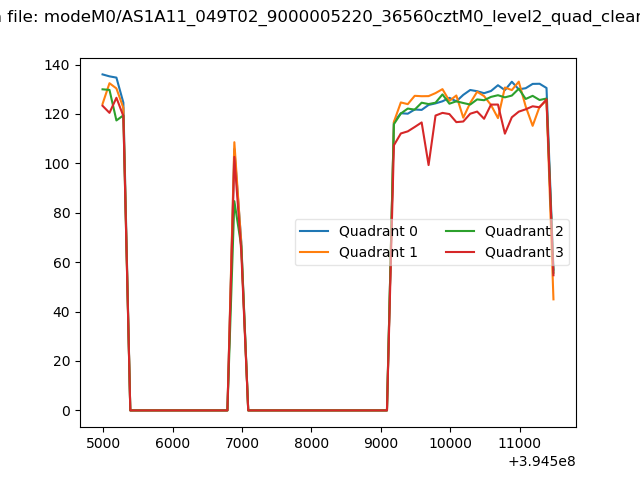 |
|
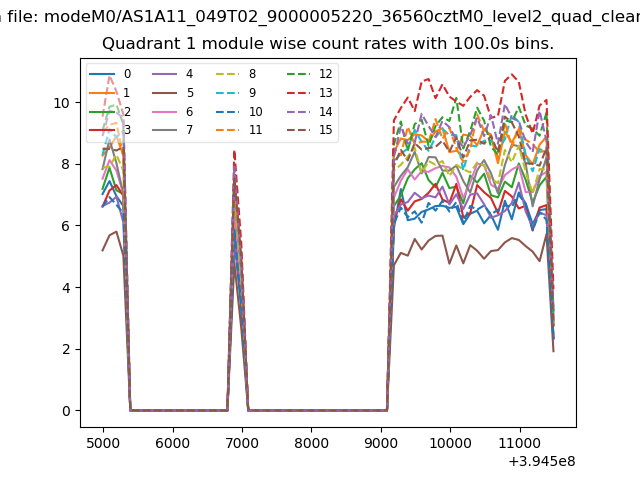
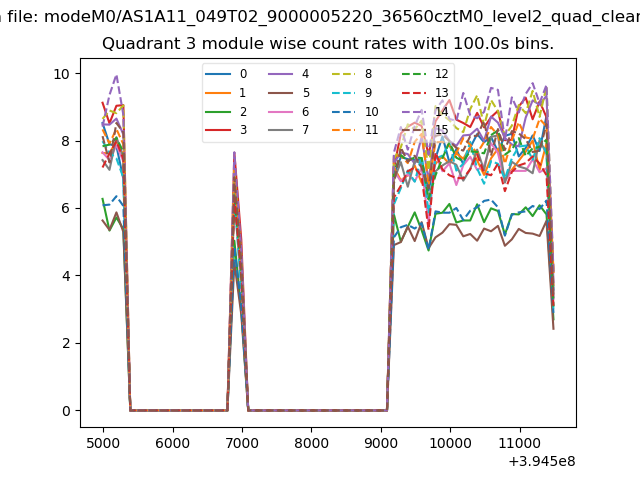
| Module-wise count rates for Quadrant A Data is divided into 100 sec bins |
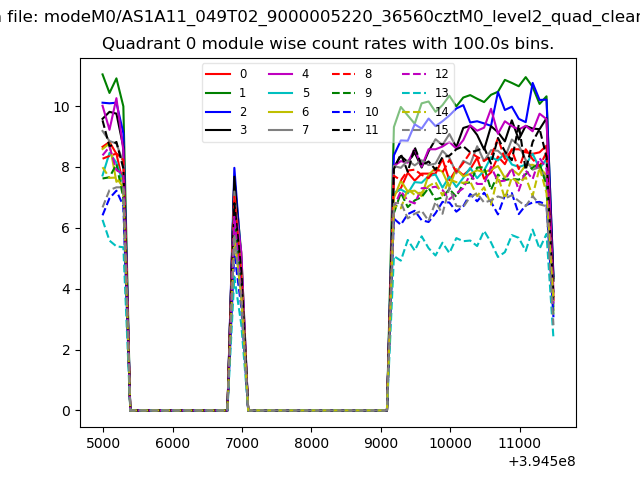 |
 |
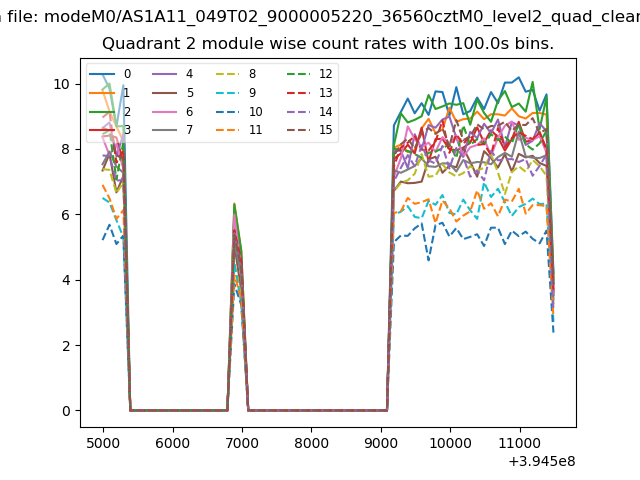
| Module-wise count rates for Quadrant B Data is divided into 100 sec bins |
 |
 |
| Module-wise count rates for Quadrant C Data is divided into 100 sec bins |
 |
 |
| Module-wise count rates for Quadrant D Data is divided into 100 sec bins |
 |
 |
| Parameter | Plot |
|---|---|
| CZT HV Monitor | 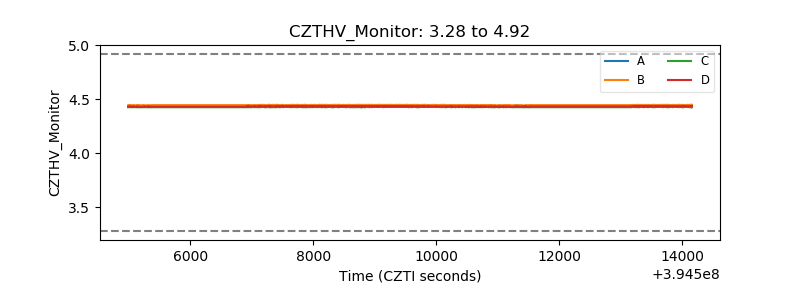 |
| D_VDD | 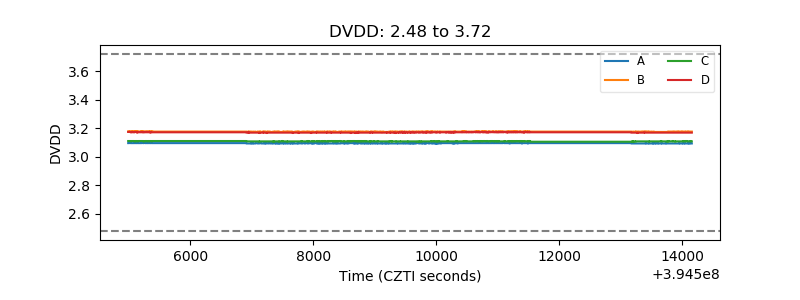 |
| Temperature 1 | 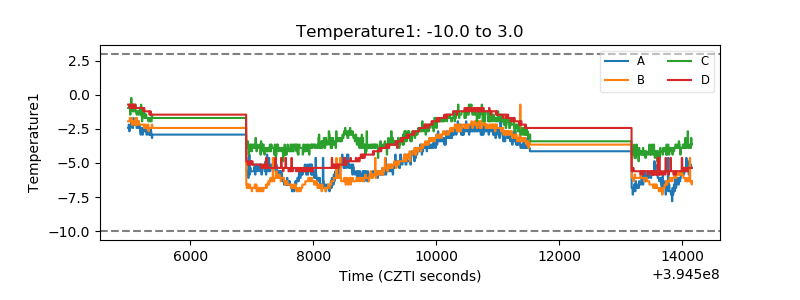 |
| Veto HV Monitor | 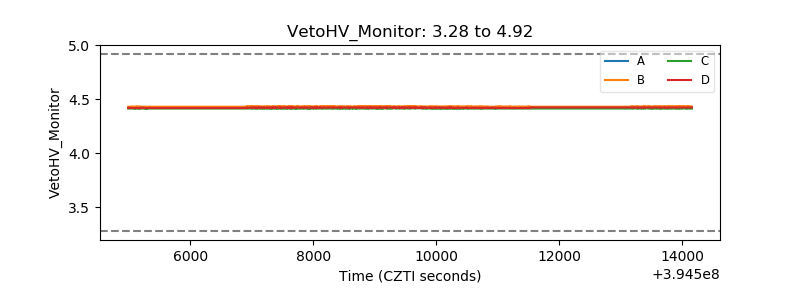 |
| Veto LLD |  |
| Alpha Counter | 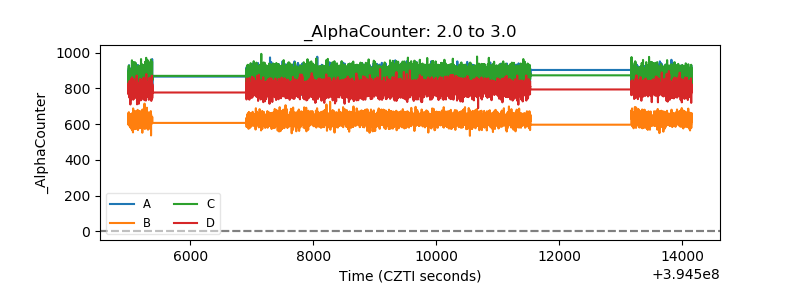 |
| _CPM_Rate | 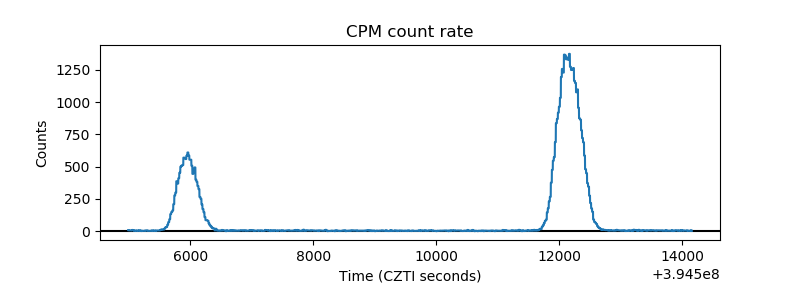 |
| CZT Counter | 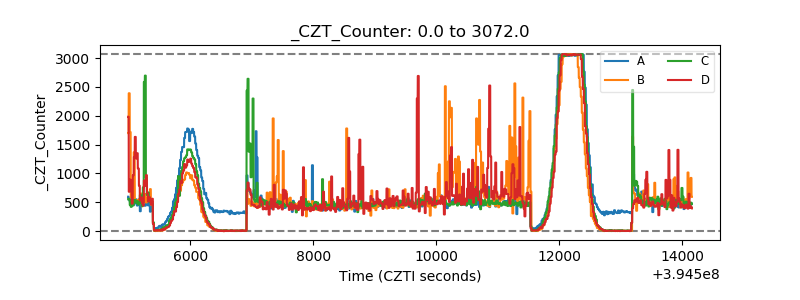 |
| +2.5 Volts monitor |  |
| +5 Volts monitor |  |
| _ROLL_ROT |  |
| _Roll_DEC | 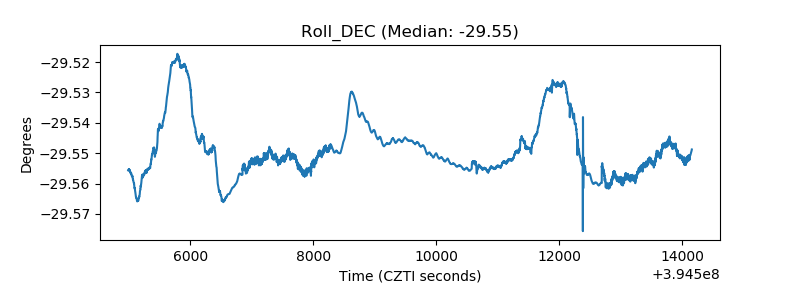 |
| _Roll_RA | 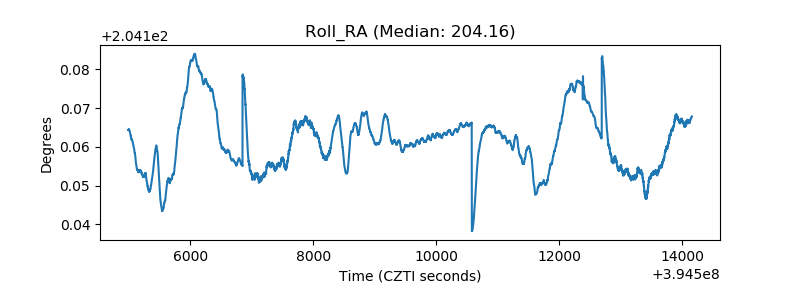 |
| Veto Counter |  |