| Param | Original file | Final file |
|---|---|---|
| Filename | modeM0/AS1A11_049T02_9000005220_36563cztM0_level2.evt | modeM0/AS1A11_049T02_9000005220_36563cztM0_level2_quad_clean.evt |
| Size (bytes) | 437,088,960 | 63,982,080 |
| Size | 416.8 MB | 61.0 MB |
| Events in quadrant A | 2,946,217 | 399,609 |
| Events in quadrant B | 3,466,603 | 396,333 |
| Events in quadrant C | 3,309,204 | 392,706 |
| Events in quadrant D | 3,153,360 | 375,387 |
| Mode M9 | |||
|---|---|---|---|
| Quadrant | BADHDUFLAG | Total packets | Discarded packets |
| A | 0 | 26 | 0 |
| B | 0 | 26 | 0 |
| C | 0 | 26 | 0 |
| D | 0 | 27 | 0 |
| Mode M0 | |||
|---|---|---|---|
| Quadrant | BADHDUFLAG | Total packets | Discarded packets |
| A | 0 | 11842 | 3 |
| B | 0 | 13537 | 2 |
| C | 0 | 12929 | 2 |
| D | 0 | 12663 | 2 |
| Mode SS | |||
|---|---|---|---|
| Quadrant | BADHDUFLAG | Total packets | Discarded packets |
| A | 0 | 108 | 0 |
| B | 0 | 108 | 0 |
| C | 0 | 108 | 0 |
| D | 0 | 108 | 0 |
| Quadrant | Total seconds | Saturated seconds | Saturation percentage |
|---|---|---|---|
| A | 5332 | 32 | 0.600150% |
| B | 5332 | 179 | 3.357089% |
| C | 5332 | 162 | 3.038260% |
| D | 5332 | 102 | 1.912978% |
Noise dominated data is calculated using 1-second bins in cleaned event files. If a bin has >2000 counts, and if more than 50% of those come from <1% of pixels, then it is considered to be noise-dominated and hence unusable.
| Quadrant | # 1 sec bins | Bins with >0 counts | Bins with >2000 counts | High rate bins dominated by noise | Noise dominated (total time) | Noise dominated (detector-on time) | Marked lightcurve |
|---|---|---|---|---|---|---|---|
| A | 7245 | 5333 | 22 | 22 | 0.30% | 0.41% | 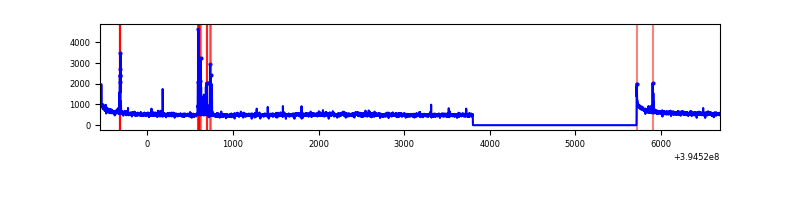 |
| B | 7245 | 5333 | 110 | 110 | 1.52% | 2.06% | 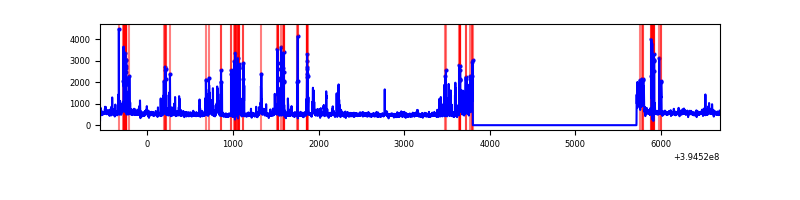 |
| C | 7245 | 5333 | 113 | 113 | 1.56% | 2.12% | 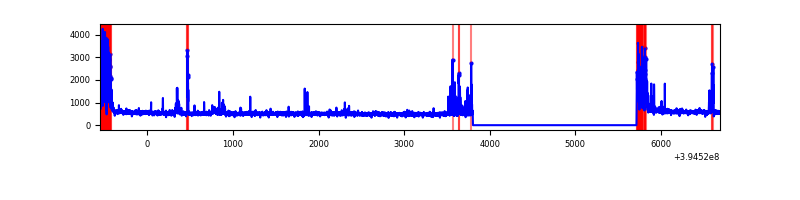 |
| D | 7245 | 5333 | 52 | 52 | 0.72% | 0.98% | 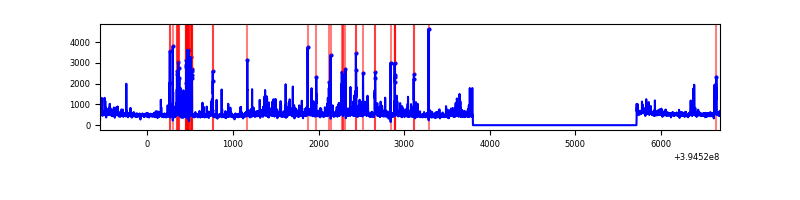 |
Top three noisy pixels from each quadrant. If the there are fewer than three noisy pixels in the level2.evt file, extra rows are filled as -1
| Pixel properties | Quadrant properties | ||||||
|---|---|---|---|---|---|---|---|
| Quadrant | DetID | PixID | Counts | Sigma | Mean | Median | Sigma |
| A | 10 | 83 | 201863 | 1504.2 | 672 | 662 | 133.8 |
| A | 15 | 223 | 105404 | 783.06 | 672 | 662 | 133.8 |
| A | 9 | 143 | 29139 | 212.9 | 672 | 662 | 133.8 |
| B | 5 | 172 | 487367 | 3925.65 | 658 | 643 | 124.0 |
| B | 5 | 255 | 250750 | 2017.23 | 658 | 643 | 124.0 |
| B | 0 | 182 | 35407 | 280.39 | 658 | 643 | 124.0 |
| C | 0 | 10 | 389278 | 2641.85 | 644 | 649 | 147.1 |
| C | 15 | 214 | 227613 | 1542.87 | 644 | 649 | 147.1 |
| C | 14 | 254 | 152530 | 1032.47 | 644 | 649 | 147.1 |
| D | 2 | 250 | 236858 | 1494.36 | 650 | 633 | 158.1 |
| D | 2 | 137 | 88075 | 553.16 | 650 | 633 | 158.1 |
| D | 2 | 153 | 72342 | 453.63 | 650 | 633 | 158.1 |
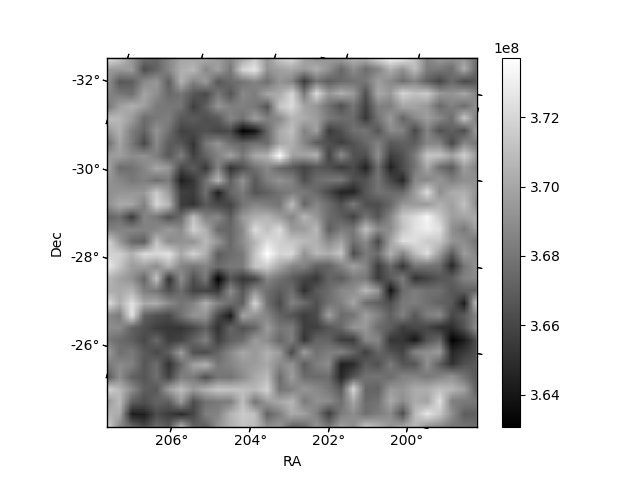
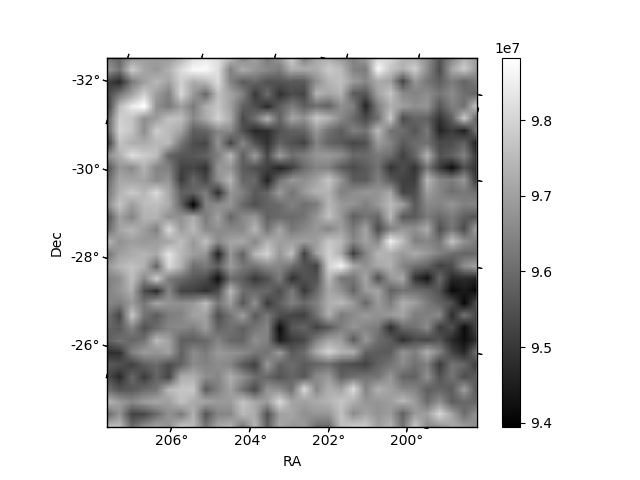
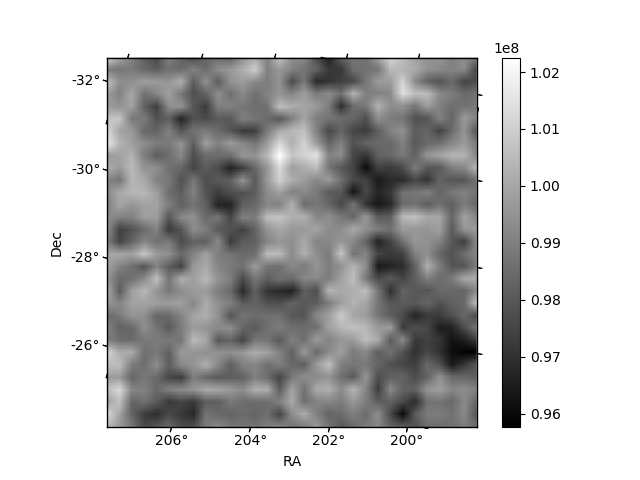
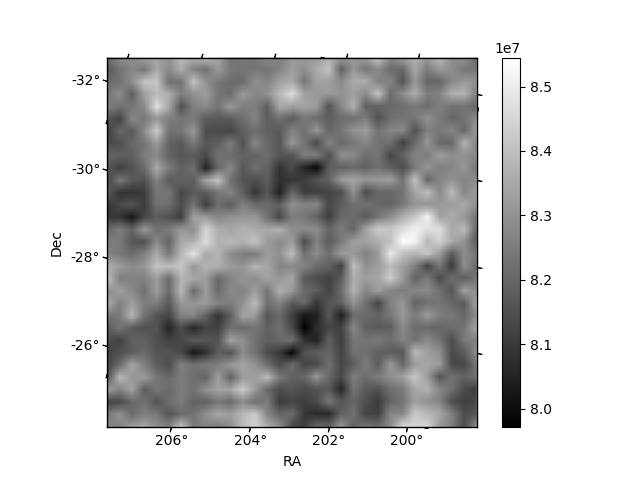
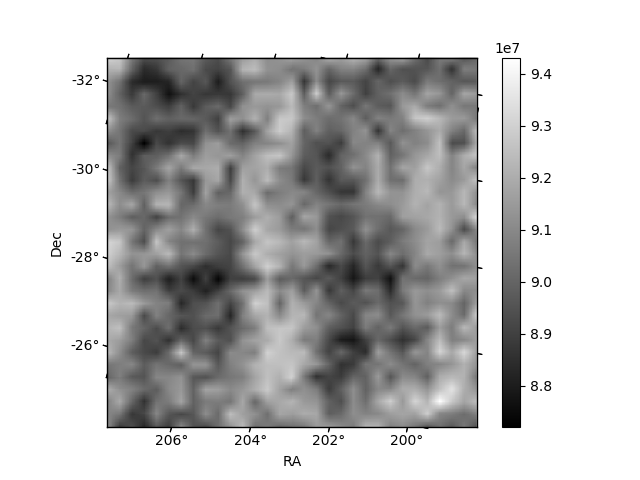
Histogram calculated using DETX and DETY for each event in the final _common_clean file
| Quadrant A |  |
 |
Quadrant B |
|---|---|---|---|
| Quadrant D |  |
 |
Quadrant C |
| Plot type | Count rate plots | Images |
|---|---|---|
| Comparison with Poisson distribution Blue bars denote a histogram of data divided into 1 sec bins. Red curve is a Poisson curve with rate = median count rate of data. |
 |
 |
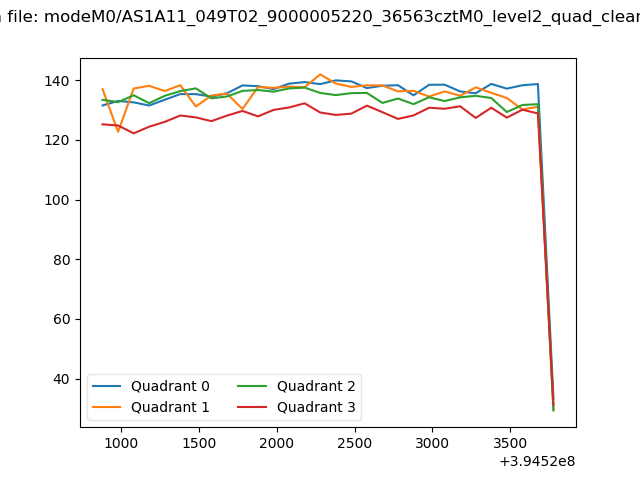
| Quadrant-wise count rates Data is divided into 100 sec bins |
 |
|
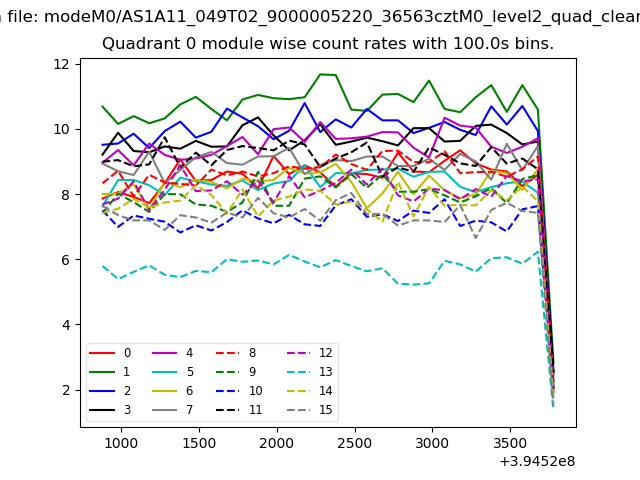
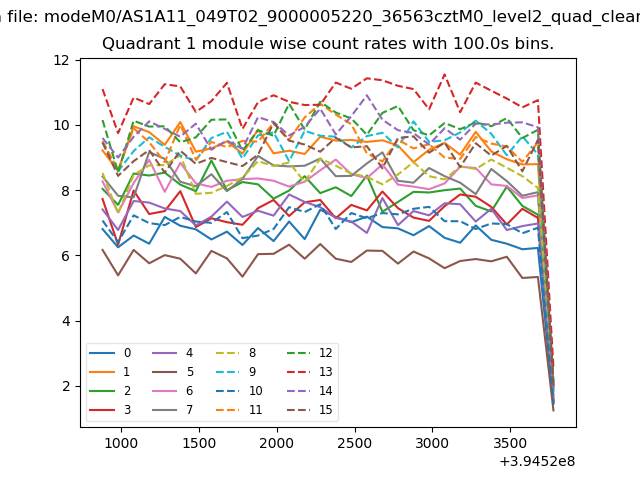
| Module-wise count rates for Quadrant A Data is divided into 100 sec bins |
 |
 |
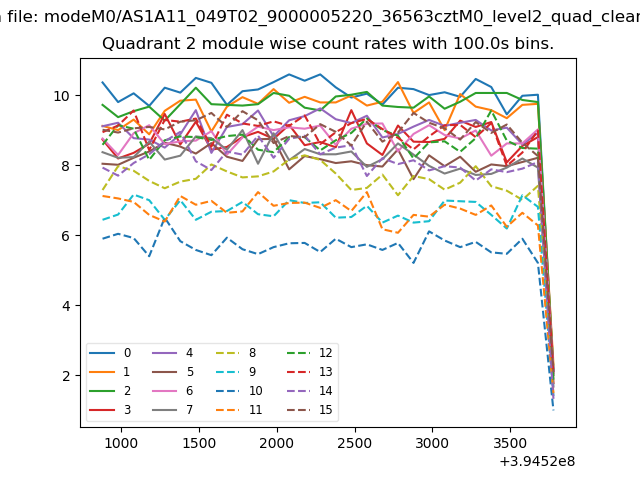
| Module-wise count rates for Quadrant B Data is divided into 100 sec bins |
 |
 |
| Module-wise count rates for Quadrant C Data is divided into 100 sec bins |
 |
 |
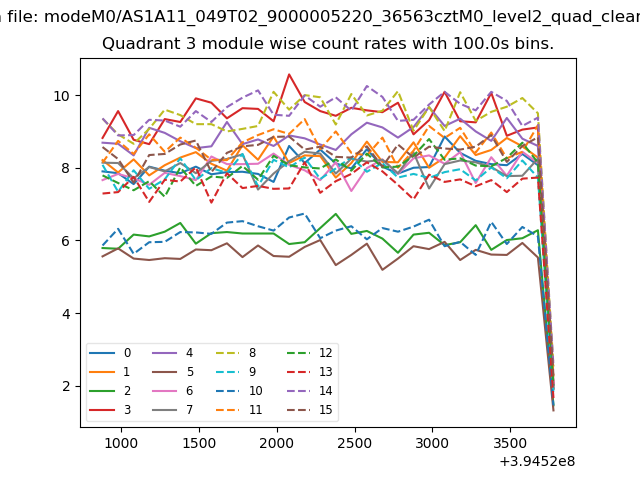
| Module-wise count rates for Quadrant D Data is divided into 100 sec bins |
 |
 |
| Parameter | Plot |
|---|---|
| CZT HV Monitor | 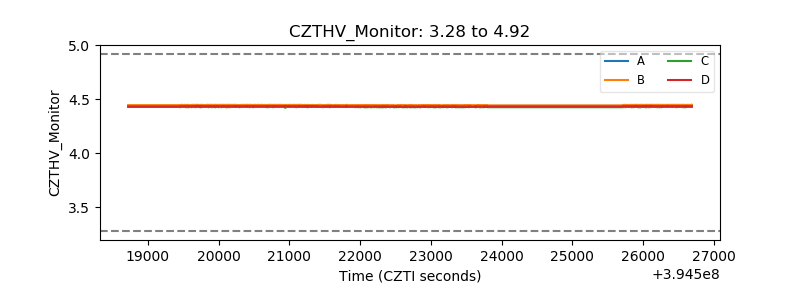 |
| D_VDD | 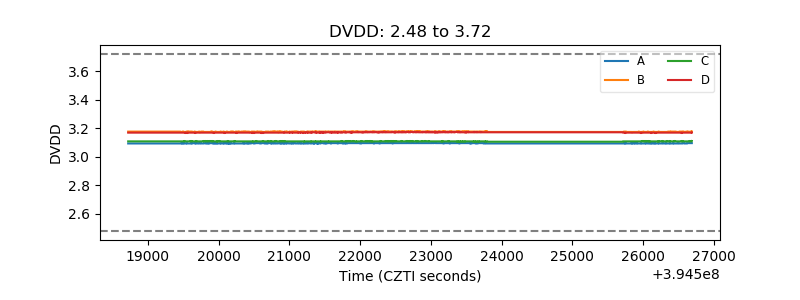 |
| Temperature 1 |  |
| Veto HV Monitor | 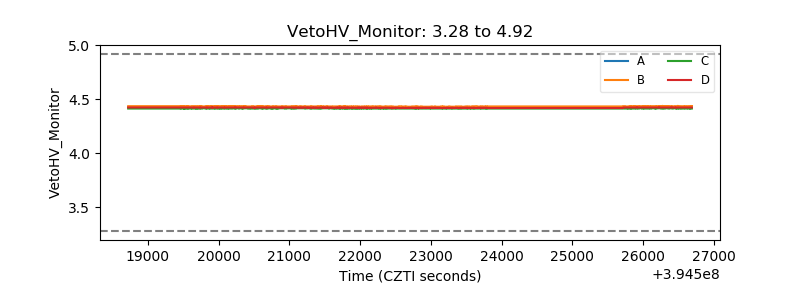 |
| Veto LLD | 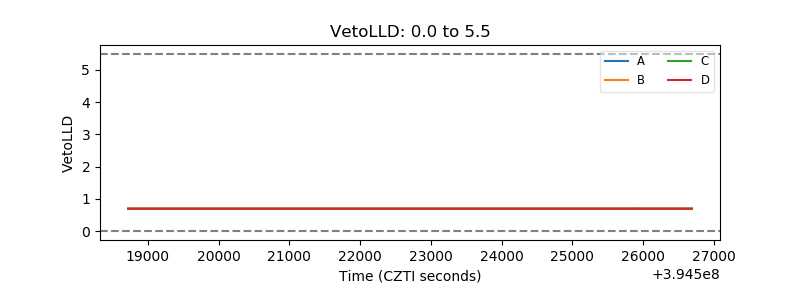 |
| Alpha Counter | 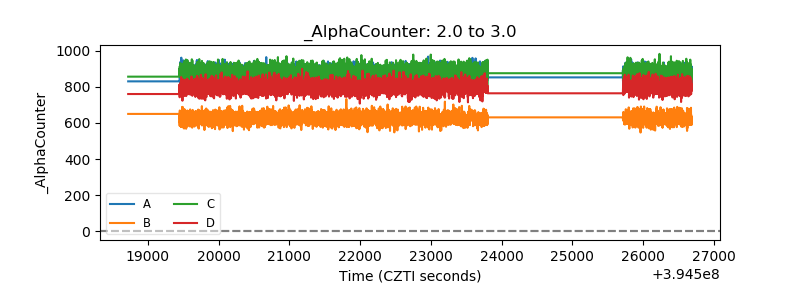 |
| _CPM_Rate | 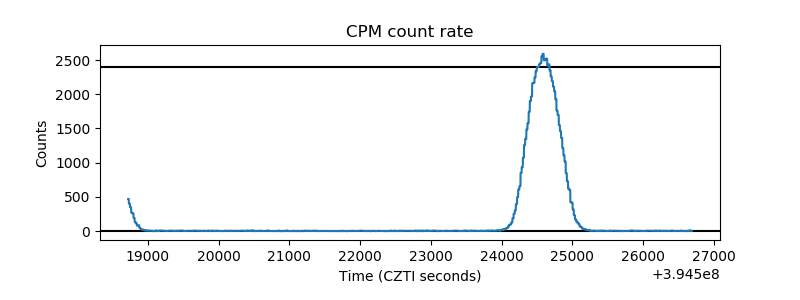 |
| CZT Counter | 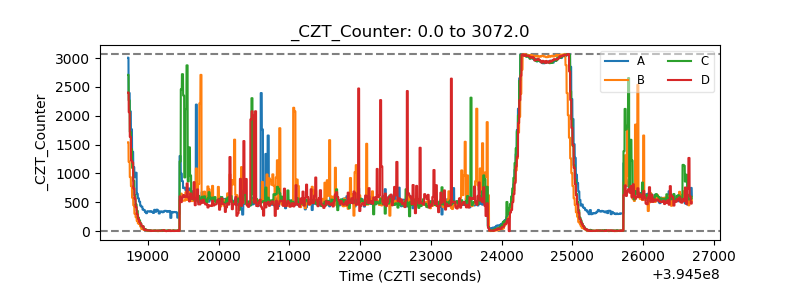 |
| +2.5 Volts monitor |  |
| +5 Volts monitor |  |
| _ROLL_ROT | 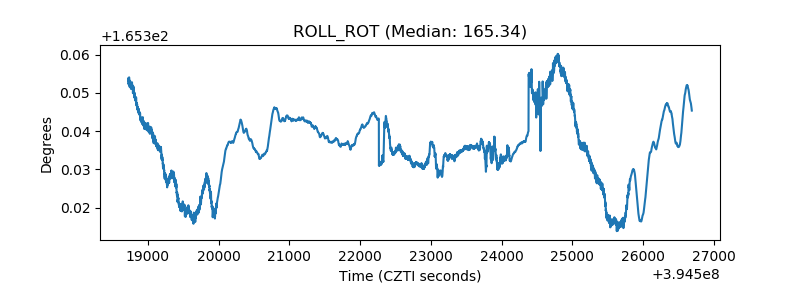 |
| _Roll_DEC | 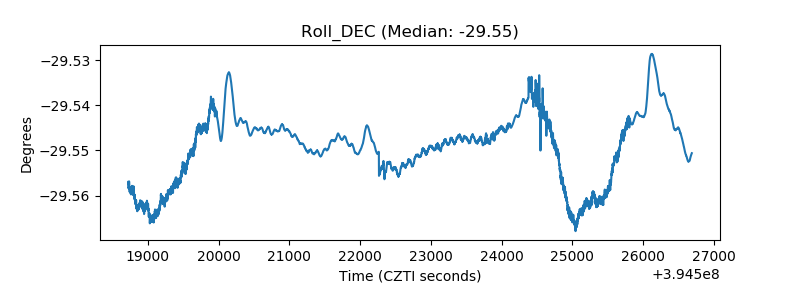 |
| _Roll_RA | 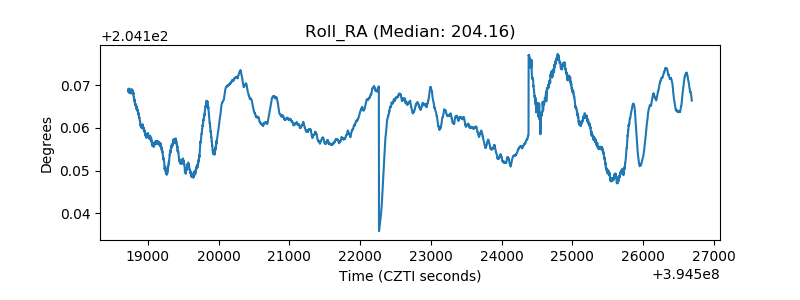 |
| Veto Counter | 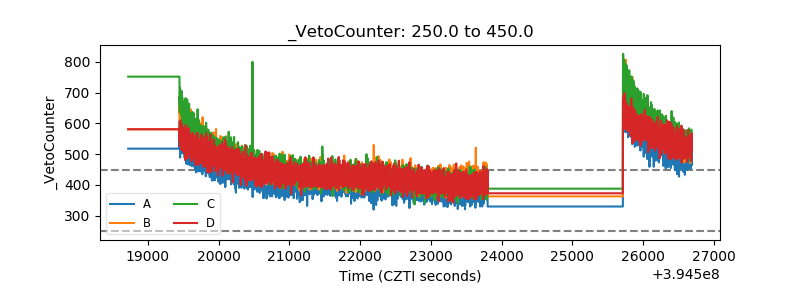 |