| Param | Original file | Final file |
|---|---|---|
| Filename | modeM0/AS1A11_049T02_9000005220_36564cztM0_level2.evt | modeM0/AS1A11_049T02_9000005220_36564cztM0_level2_quad_clean.evt |
| Size (bytes) | 403,110,720 | 76,757,760 |
| Size | 384.4 MB | 73.2 MB |
| Events in quadrant A | 2,820,932 | 501,168 |
| Events in quadrant B | 2,972,760 | 503,943 |
| Events in quadrant C | 3,108,885 | 494,848 |
| Events in quadrant D | 2,963,788 | 471,679 |
| Mode M9 | |||
|---|---|---|---|
| Quadrant | BADHDUFLAG | Total packets | Discarded packets |
| A | 0 | 30 | 0 |
| B | 0 | 30 | 0 |
| C | 0 | 30 | 0 |
| D | 0 | 31 | 0 |
| Mode M0 | |||
|---|---|---|---|
| Quadrant | BADHDUFLAG | Total packets | Discarded packets |
| A | 0 | 11334 | 3 |
| B | 0 | 11862 | 2 |
| C | 0 | 12230 | 2 |
| D | 0 | 11805 | 2 |
| Mode SS | |||
|---|---|---|---|
| Quadrant | BADHDUFLAG | Total packets | Discarded packets |
| A | 0 | 104 | 0 |
| B | 0 | 104 | 0 |
| C | 0 | 104 | 0 |
| D | 0 | 104 | 0 |
| Quadrant | Total seconds | Saturated seconds | Saturation percentage |
|---|---|---|---|
| A | 5026 | 10 | 0.198965% |
| B | 5026 | 68 | 1.352965% |
| C | 5026 | 134 | 2.666136% |
| D | 5026 | 31 | 0.616793% |
Noise dominated data is calculated using 1-second bins in cleaned event files. If a bin has >2000 counts, and if more than 50% of those come from <1% of pixels, then it is considered to be noise-dominated and hence unusable.
| Quadrant | # 1 sec bins | Bins with >0 counts | Bins with >2000 counts | High rate bins dominated by noise | Noise dominated (total time) | Noise dominated (detector-on time) | Marked lightcurve |
|---|---|---|---|---|---|---|---|
| A | 7059 | 5027 | 5 | 5 | 0.07% | 0.10% | 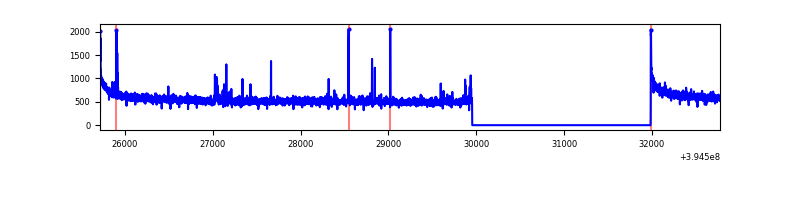 |
| B | 7059 | 5027 | 27 | 27 | 0.38% | 0.54% | 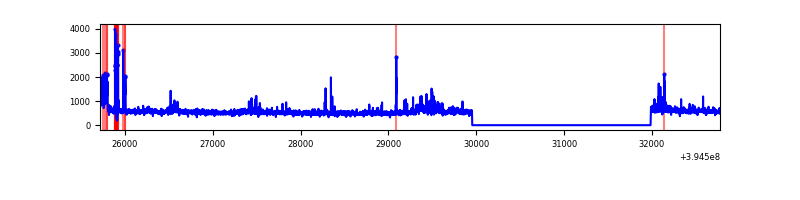 |
| C | 7059 | 5027 | 87 | 87 | 1.23% | 1.73% | 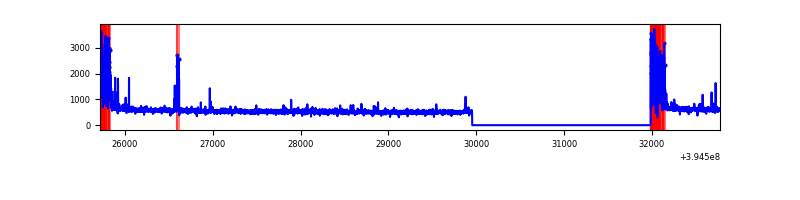 |
| D | 7059 | 5027 | 23 | 23 | 0.33% | 0.46% | 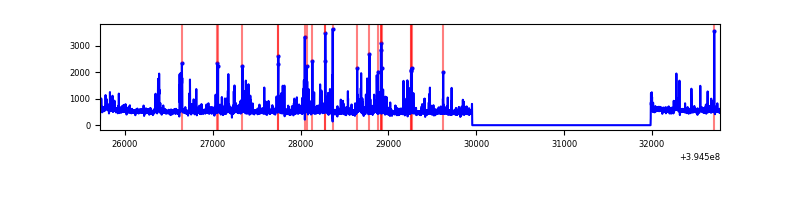 |
Top three noisy pixels from each quadrant. If the there are fewer than three noisy pixels in the level2.evt file, extra rows are filled as -1
| Pixel properties | Quadrant properties | ||||||
|---|---|---|---|---|---|---|---|
| Quadrant | DetID | PixID | Counts | Sigma | Mean | Median | Sigma |
| A | 10 | 83 | 196717 | 1497.89 | 663 | 653 | 130.9 |
| A | 15 | 223 | 34723 | 260.29 | 663 | 653 | 130.9 |
| A | 9 | 143 | 21173 | 156.77 | 663 | 653 | 130.9 |
| B | 5 | 172 | 322930 | 2662.2 | 649 | 635 | 121.1 |
| B | 0 | 189 | 22145 | 177.68 | 649 | 635 | 121.1 |
| B | 0 | 182 | 20405 | 163.3 | 649 | 635 | 121.1 |
| C | 0 | 10 | 322542 | 2212.23 | 634 | 640 | 145.5 |
| C | 15 | 214 | 219200 | 1502.03 | 634 | 640 | 145.5 |
| C | 14 | 254 | 86872 | 592.62 | 634 | 640 | 145.5 |
| D | 2 | 137 | 111119 | 702.33 | 644 | 628 | 157.3 |
| D | 2 | 153 | 97769 | 617.47 | 644 | 628 | 157.3 |
| D | 2 | 250 | 83607 | 527.45 | 644 | 628 | 157.3 |
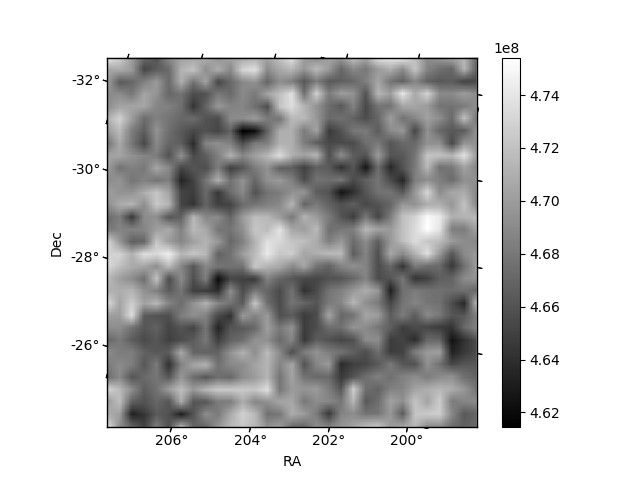
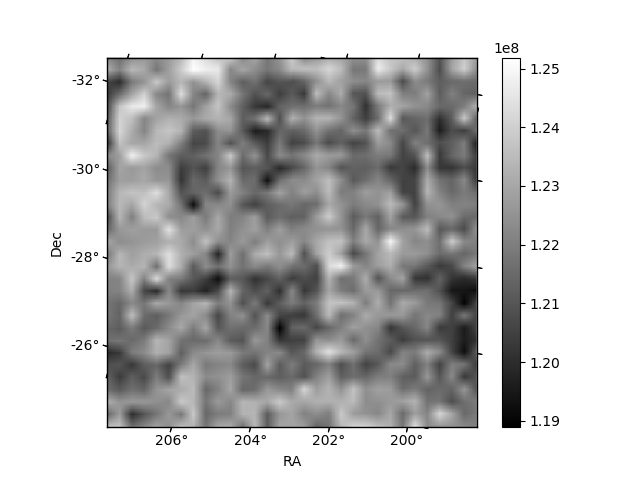
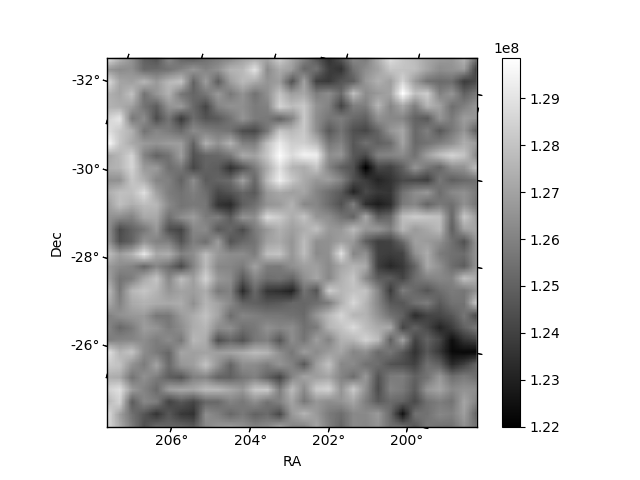
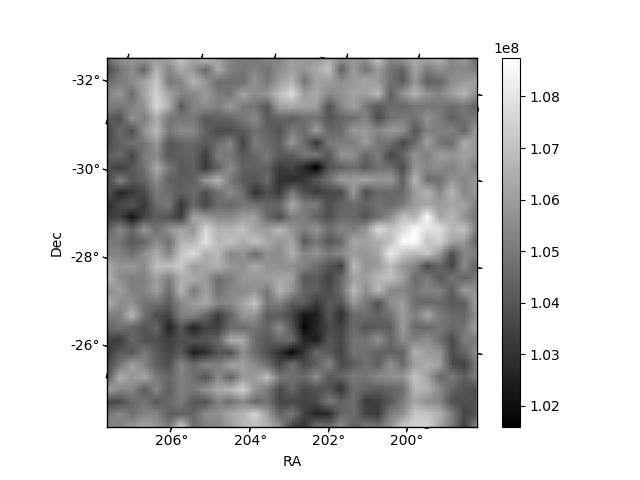
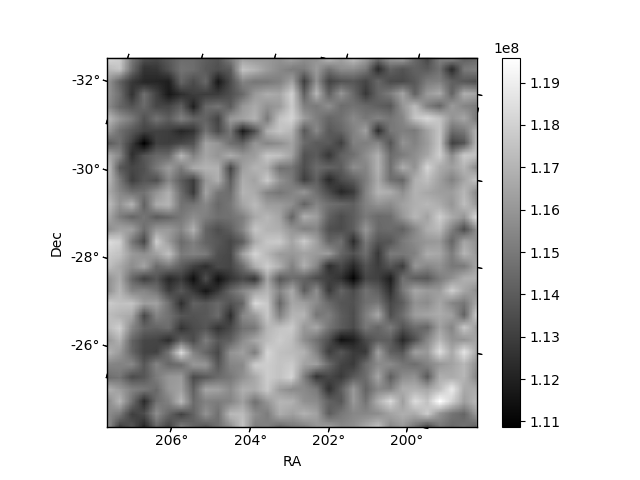
Histogram calculated using DETX and DETY for each event in the final _common_clean file
| Quadrant A | 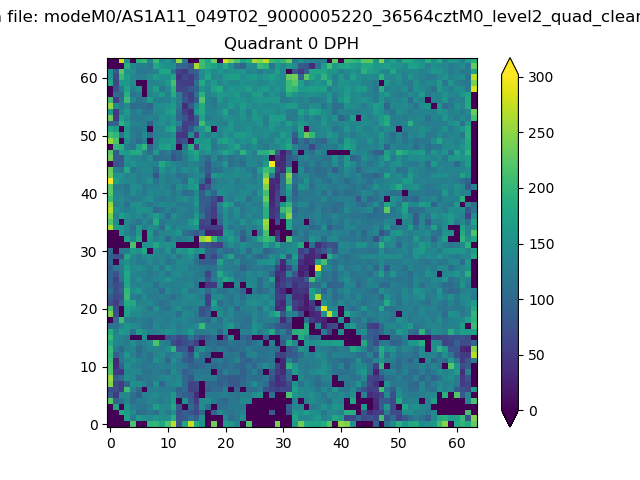 |
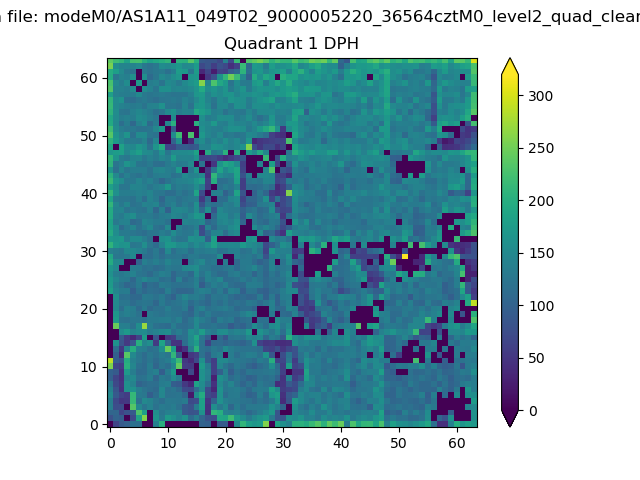 |
Quadrant B |
|---|---|---|---|
| Quadrant D | 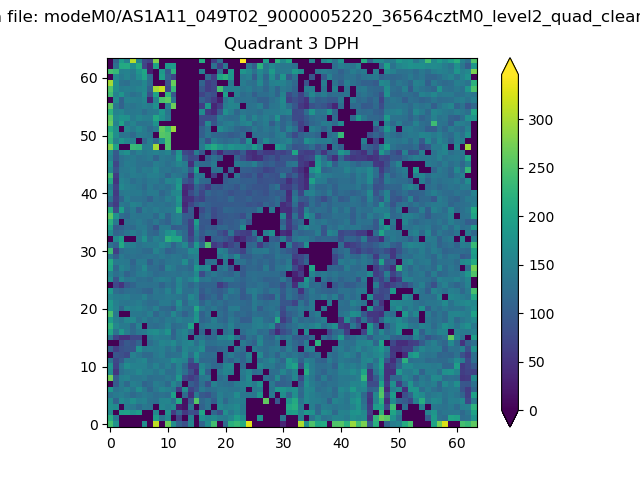 |
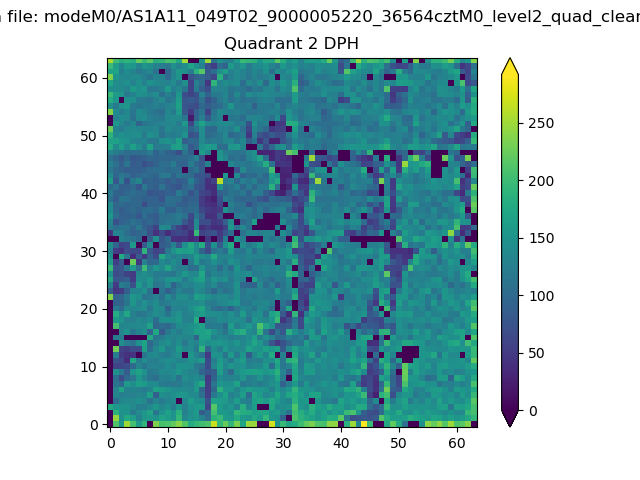 |
Quadrant C |
| Plot type | Count rate plots | Images |
|---|---|---|
| Comparison with Poisson distribution Blue bars denote a histogram of data divided into 1 sec bins. Red curve is a Poisson curve with rate = median count rate of data. |
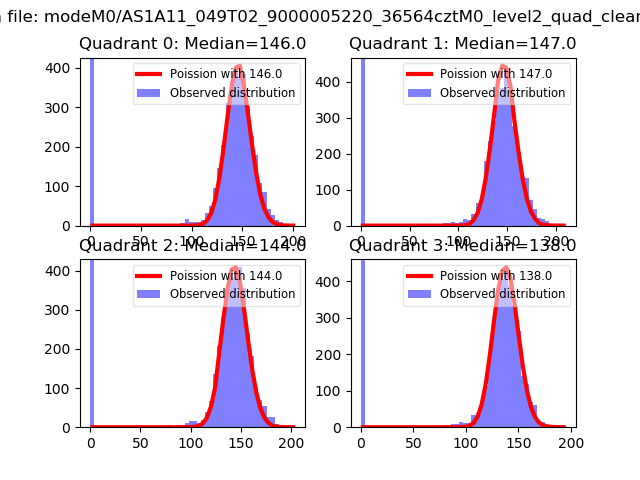 |
 |
| Quadrant-wise count rates Data is divided into 100 sec bins |
 |
|
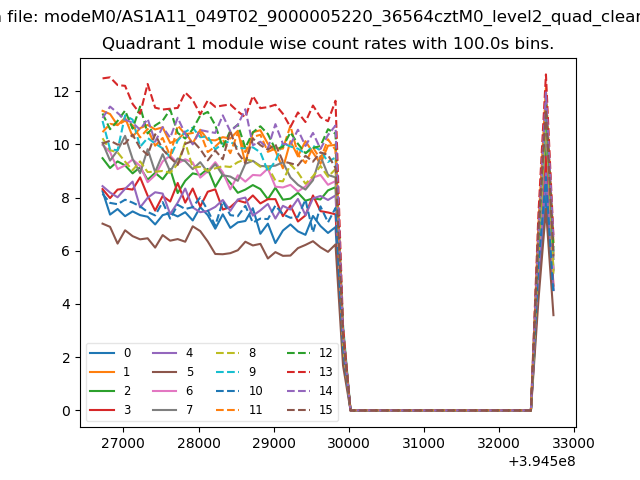
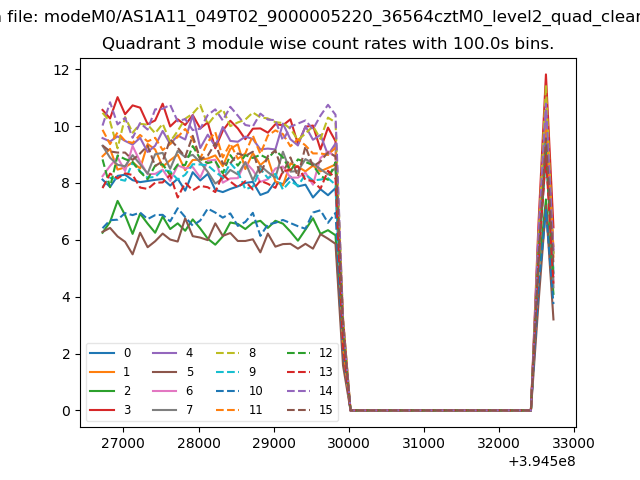
| Module-wise count rates for Quadrant A Data is divided into 100 sec bins |
 |
 |
| Module-wise count rates for Quadrant B Data is divided into 100 sec bins |
 |
 |
| Module-wise count rates for Quadrant C Data is divided into 100 sec bins |
 |
 |
| Module-wise count rates for Quadrant D Data is divided into 100 sec bins |
 |
 |
| Parameter | Plot |
|---|---|
| CZT HV Monitor | 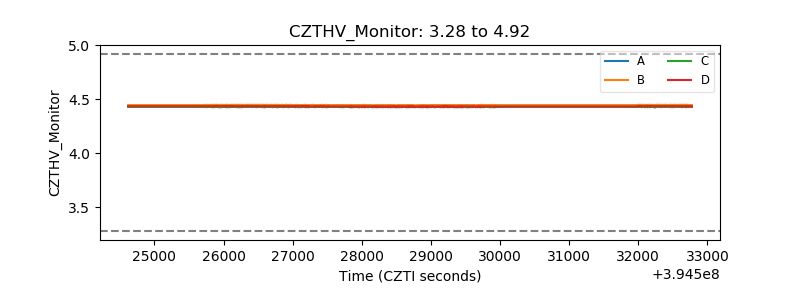 |
| D_VDD | 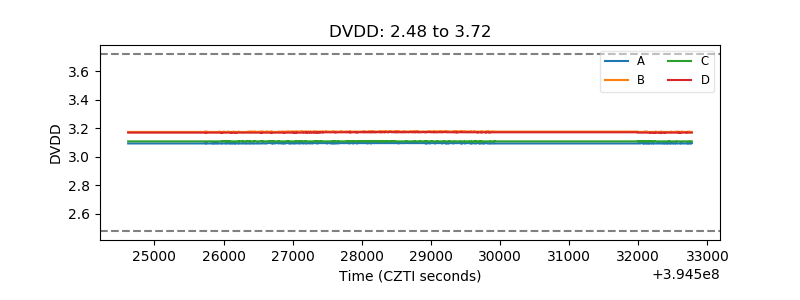 |
| Temperature 1 | 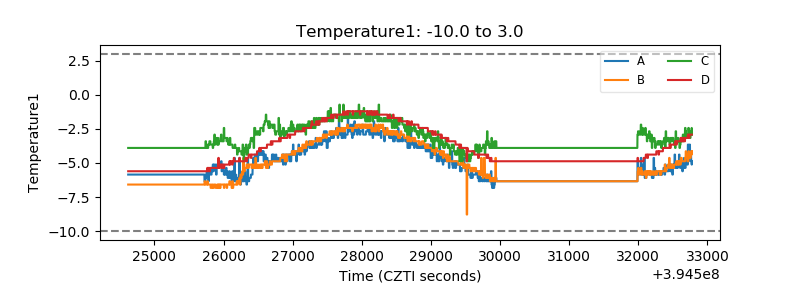 |
| Veto HV Monitor | 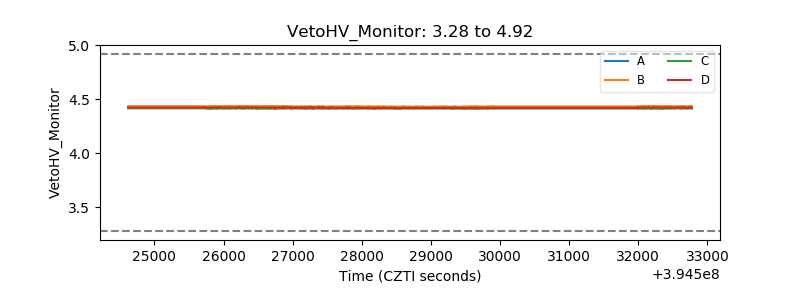 |
| Veto LLD |  |
| Alpha Counter | 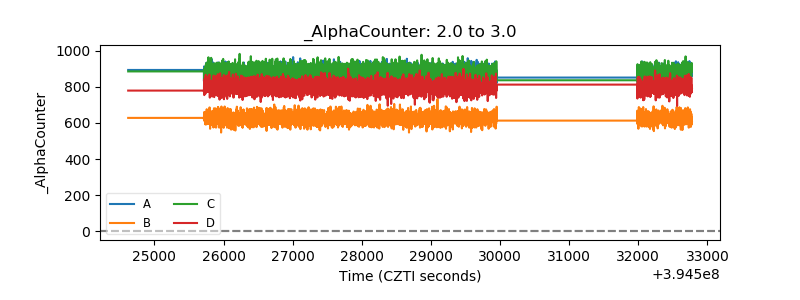 |
| _CPM_Rate | 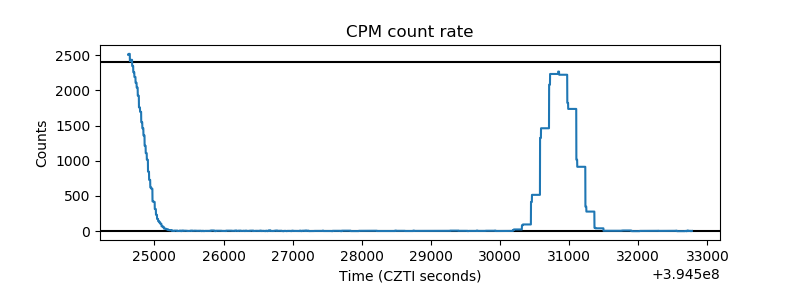 |
| CZT Counter | 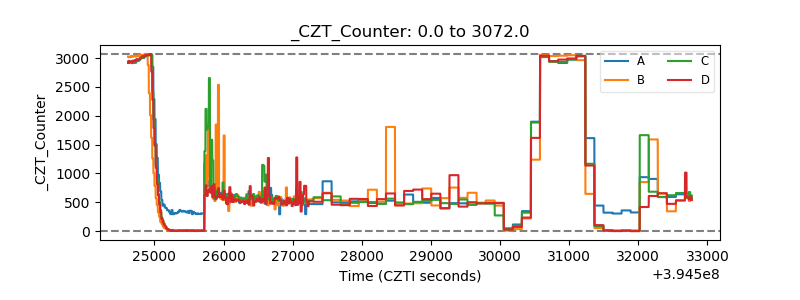 |
| +2.5 Volts monitor |  |
| +5 Volts monitor |  |
| _ROLL_ROT | 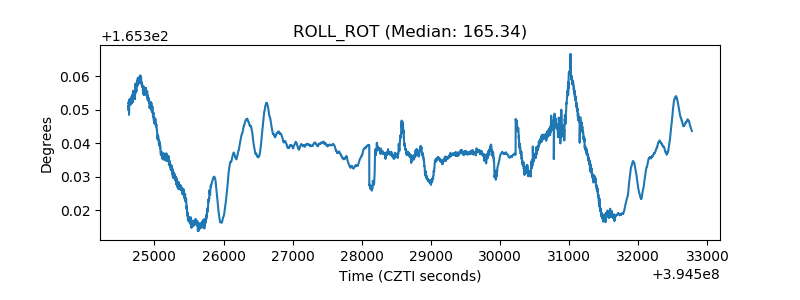 |
| _Roll_DEC | 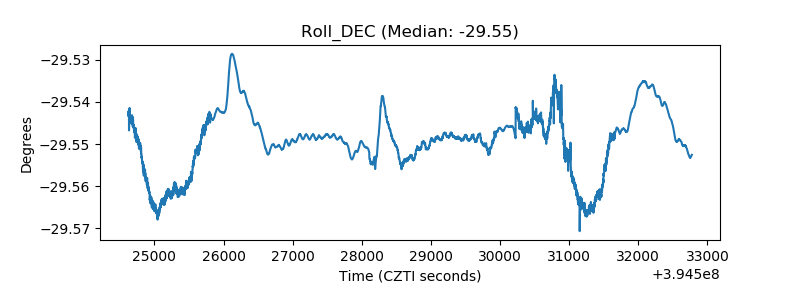 |
| _Roll_RA | 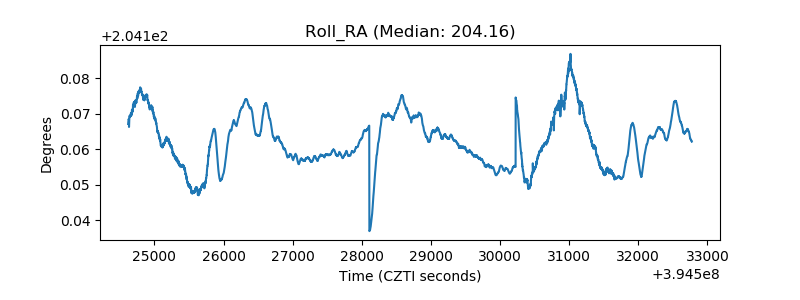 |
| Veto Counter |  |