| Param | Original file | Final file |
|---|---|---|
| Filename | modeM0/AS1A11_049T02_9000005220_36565cztM0_level2.evt | modeM0/AS1A11_049T02_9000005220_36565cztM0_level2_quad_clean.evt |
| Size (bytes) | 404,331,840 | 93,985,920 |
| Size | 385.6 MB | 89.6 MB |
| Events in quadrant A | 2,792,136 | 637,997 |
| Events in quadrant B | 3,005,529 | 637,736 |
| Events in quadrant C | 3,088,499 | 626,685 |
| Events in quadrant D | 3,022,236 | 596,412 |
| Mode M9 | |||
|---|---|---|---|
| Quadrant | BADHDUFLAG | Total packets | Discarded packets |
| A | 0 | 33 | 0 |
| B | 0 | 33 | 0 |
| C | 0 | 33 | 0 |
| D | 0 | 34 | 0 |
| Mode M0 | |||
|---|---|---|---|
| Quadrant | BADHDUFLAG | Total packets | Discarded packets |
| A | 0 | 11237 | 3 |
| B | 0 | 12039 | 2 |
| C | 0 | 12210 | 2 |
| D | 0 | 12049 | 2 |
| Mode SS | |||
|---|---|---|---|
| Quadrant | BADHDUFLAG | Total packets | Discarded packets |
| A | 0 | 102 | 0 |
| B | 0 | 102 | 0 |
| C | 0 | 102 | 0 |
| D | 0 | 102 | 0 |
| Quadrant | Total seconds | Saturated seconds | Saturation percentage |
|---|---|---|---|
| A | 4954 | 12 | 0.242229% |
| B | 4954 | 46 | 0.928543% |
| C | 4954 | 174 | 3.512313% |
| D | 4954 | 57 | 1.150585% |
Noise dominated data is calculated using 1-second bins in cleaned event files. If a bin has >2000 counts, and if more than 50% of those come from <1% of pixels, then it is considered to be noise-dominated and hence unusable.
| Quadrant | # 1 sec bins | Bins with >0 counts | Bins with >2000 counts | High rate bins dominated by noise | Noise dominated (total time) | Noise dominated (detector-on time) | Marked lightcurve |
|---|---|---|---|---|---|---|---|
| A | 7078 | 4955 | 2 | 2 | 0.03% | 0.04% | 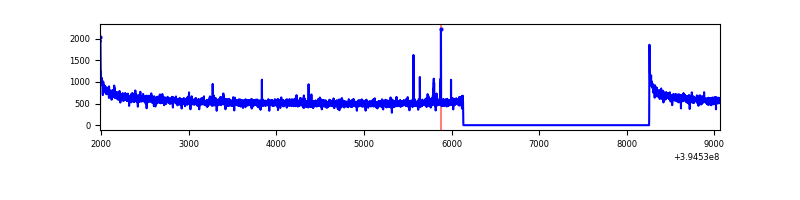 |
| B | 7078 | 4955 | 20 | 20 | 0.28% | 0.40% | 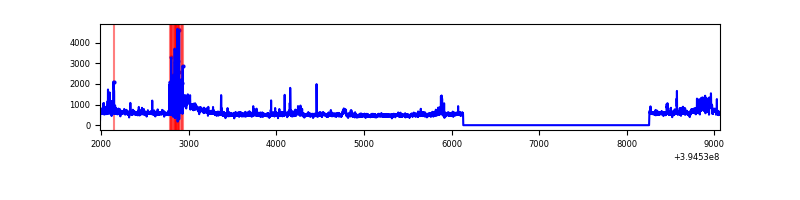 |
| C | 7078 | 4955 | 112 | 112 | 1.58% | 2.26% | 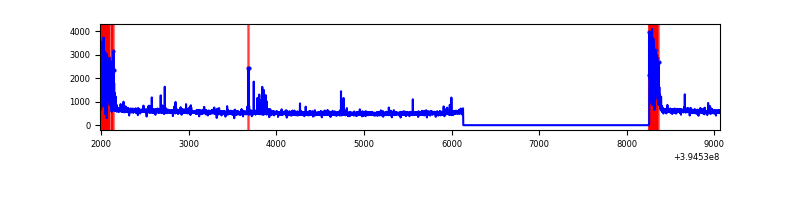 |
| D | 7078 | 4955 | 45 | 45 | 0.64% | 0.91% | 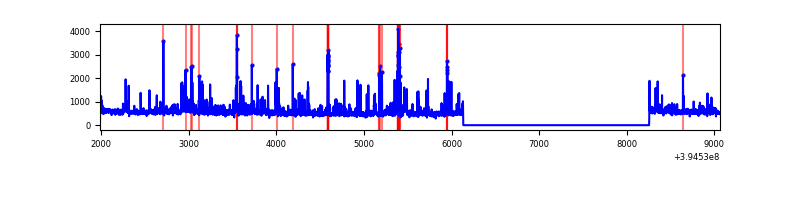 |
Top three noisy pixels from each quadrant. If the there are fewer than three noisy pixels in the level2.evt file, extra rows are filled as -1
| Pixel properties | Quadrant properties | ||||||
|---|---|---|---|---|---|---|---|
| Quadrant | DetID | PixID | Counts | Sigma | Mean | Median | Sigma |
| A | 10 | 83 | 197751 | 1523.83 | 658 | 650 | 129.3 |
| A | 13 | 6 | 22015 | 165.18 | 658 | 650 | 129.3 |
| A | 15 | 223 | 16798 | 124.84 | 658 | 650 | 129.3 |
| B | 0 | 182 | 302408 | 2498.85 | 640 | 626 | 120.8 |
| B | 5 | 172 | 54823 | 448.77 | 640 | 626 | 120.8 |
| B | 4 | 171 | 40772 | 332.42 | 640 | 626 | 120.8 |
| C | 0 | 10 | 416124 | 2923.93 | 621 | 628 | 142.1 |
| C | 15 | 214 | 213627 | 1498.92 | 621 | 628 | 142.1 |
| C | 14 | 254 | 31117 | 214.56 | 621 | 628 | 142.1 |
| D | 13 | 249 | 111650 | 721.89 | 635 | 619 | 153.8 |
| D | 2 | 153 | 92606 | 598.07 | 635 | 619 | 153.8 |
| D | 10 | 199 | 73736 | 475.39 | 635 | 619 | 153.8 |
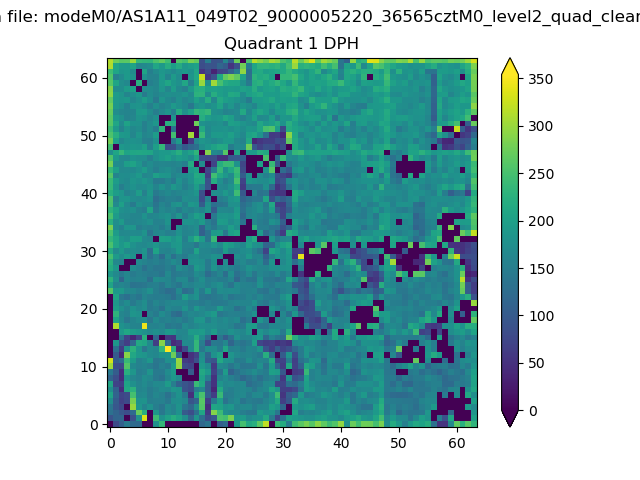
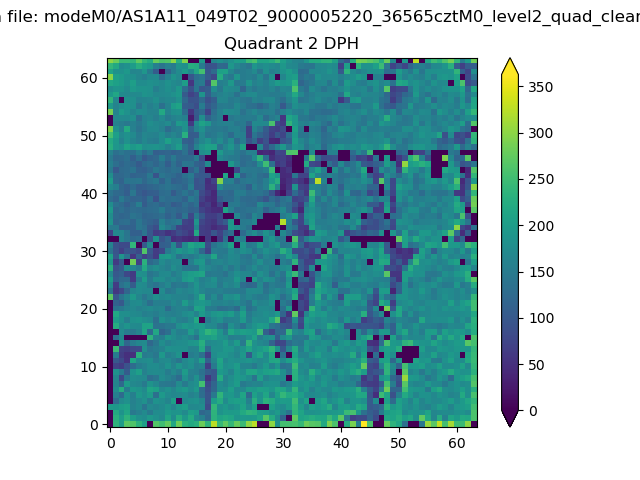
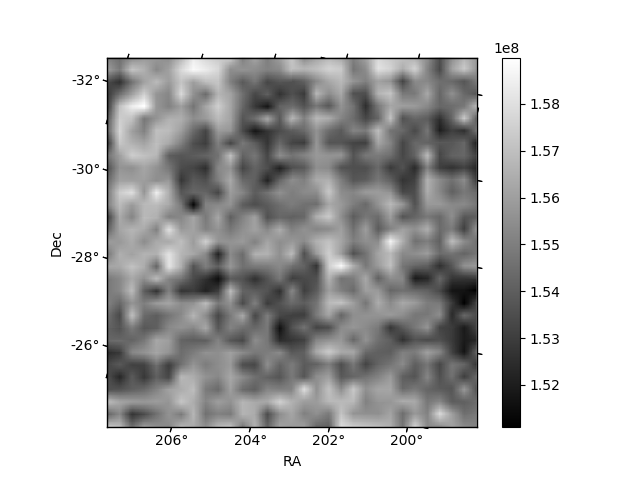
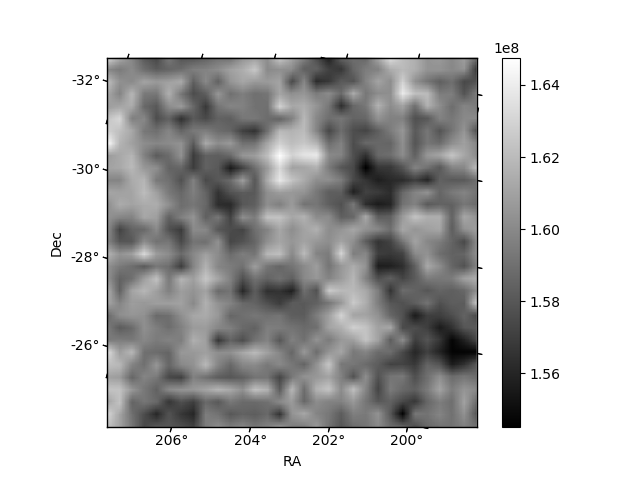
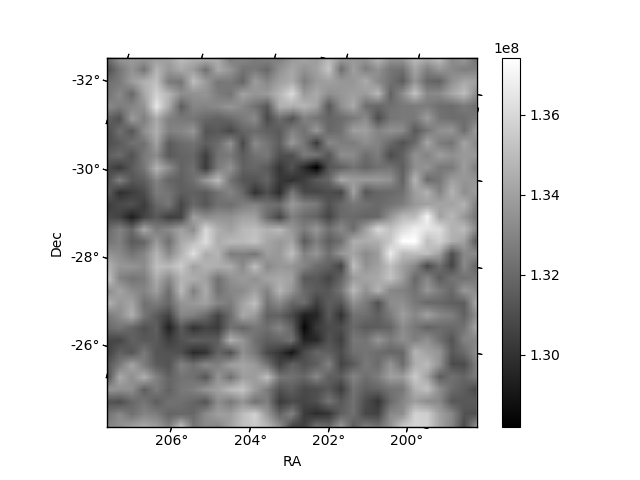
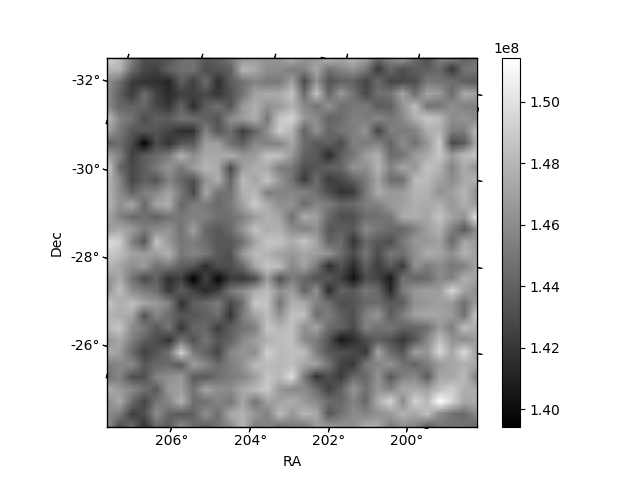
Histogram calculated using DETX and DETY for each event in the final _common_clean file
| Quadrant A |  |
 |
Quadrant B |
|---|---|---|---|
| Quadrant D |  |
 |
Quadrant C |
| Plot type | Count rate plots | Images |
|---|---|---|
| Comparison with Poisson distribution Blue bars denote a histogram of data divided into 1 sec bins. Red curve is a Poisson curve with rate = median count rate of data. |
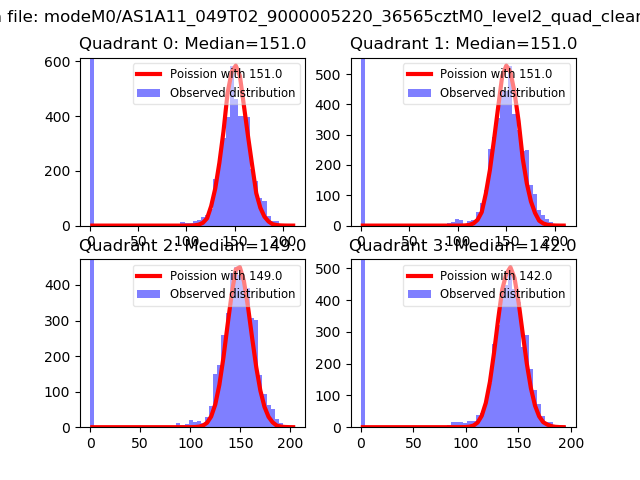 |
 |
| Quadrant-wise count rates Data is divided into 100 sec bins |
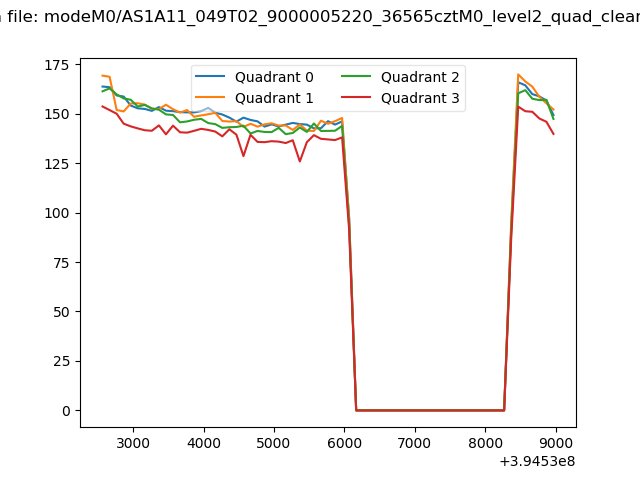 |
|
| Module-wise count rates for Quadrant A Data is divided into 100 sec bins |
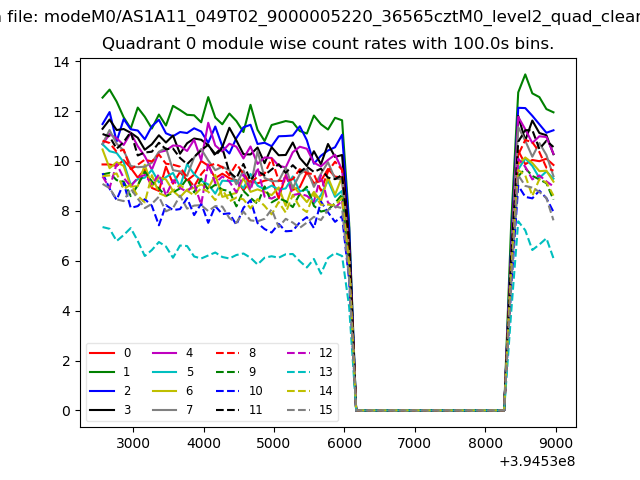 |
 |
| Module-wise count rates for Quadrant B Data is divided into 100 sec bins |
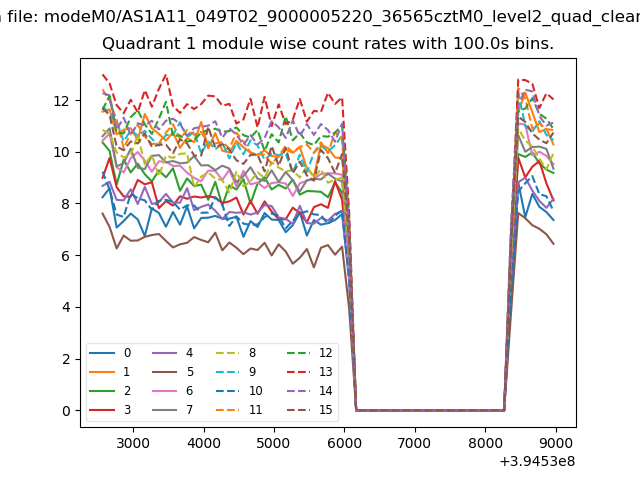 |
 |
| Module-wise count rates for Quadrant C Data is divided into 100 sec bins |
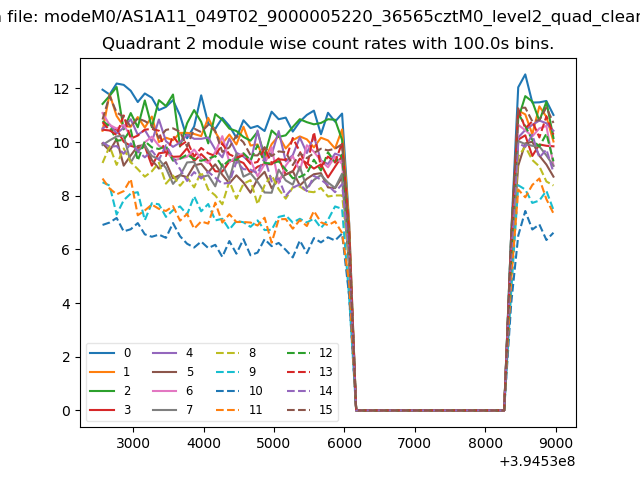 |
 |
| Module-wise count rates for Quadrant D Data is divided into 100 sec bins |
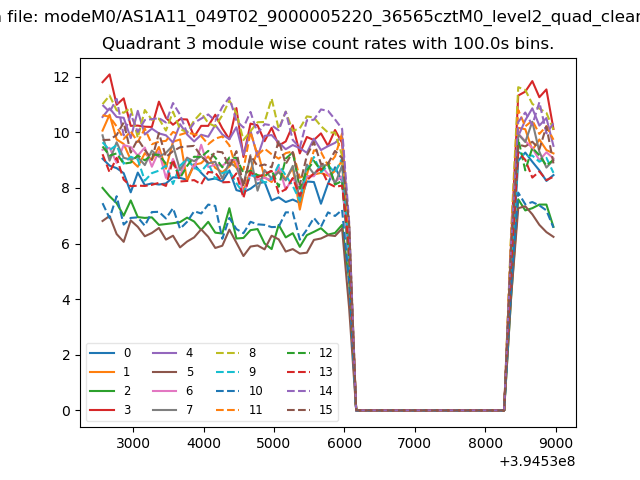 |
 |
| Parameter | Plot |
|---|---|
| CZT HV Monitor | 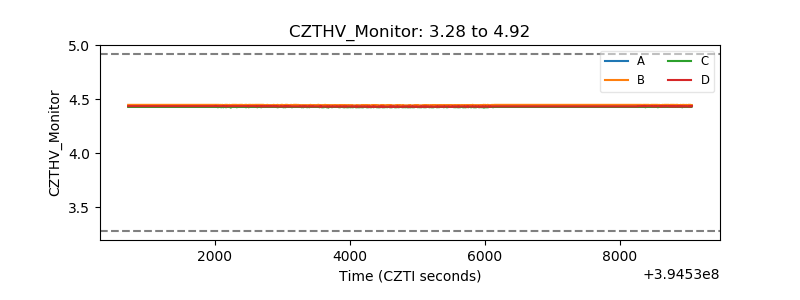 |
| D_VDD | 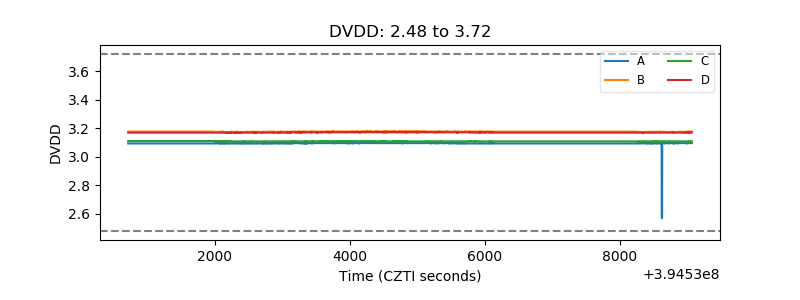 |
| Temperature 1 | 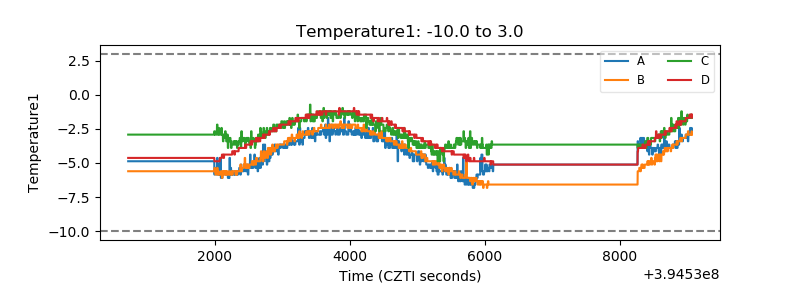 |
| Veto HV Monitor | 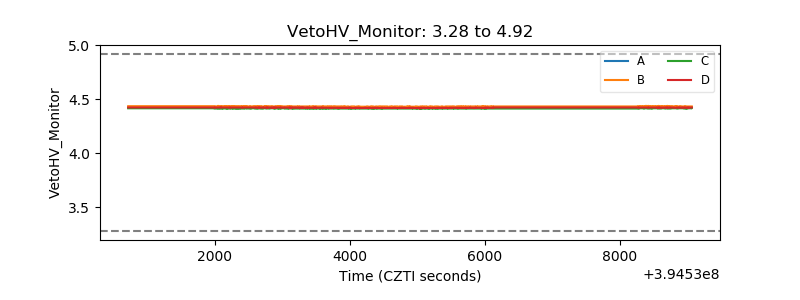 |
| Veto LLD | 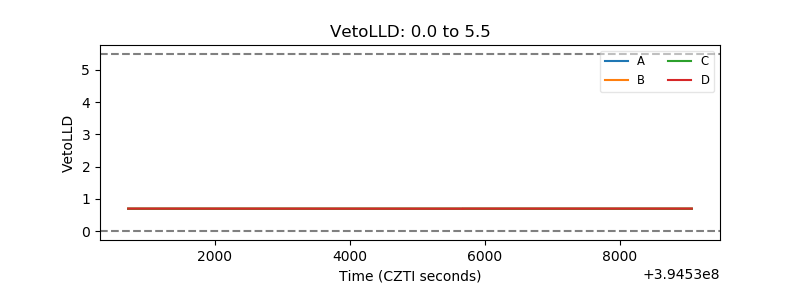 |
| Alpha Counter | 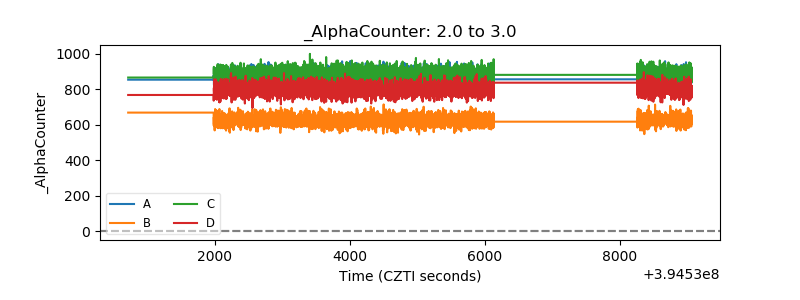 |
| _CPM_Rate | 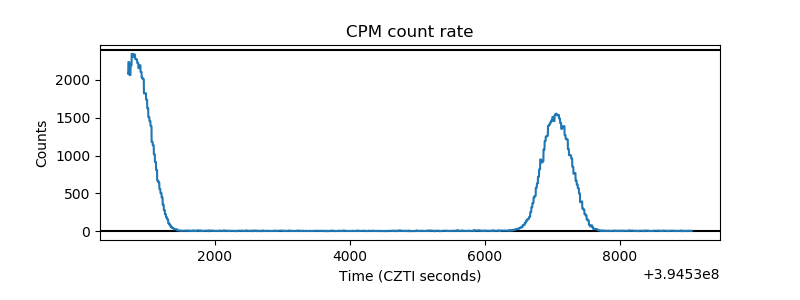 |
| CZT Counter | 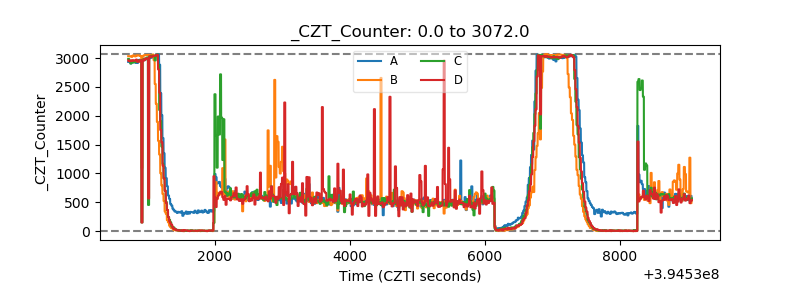 |
| +2.5 Volts monitor |  |
| +5 Volts monitor |  |
| _ROLL_ROT | 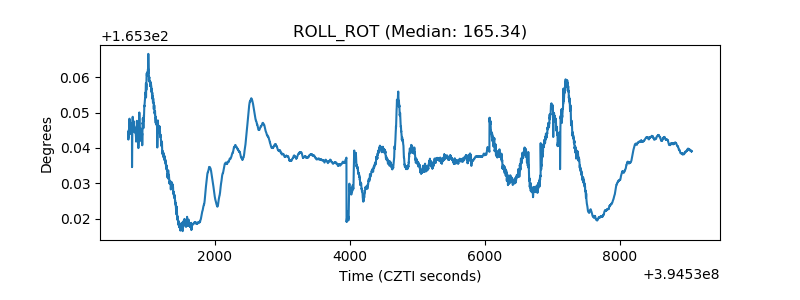 |
| _Roll_DEC | 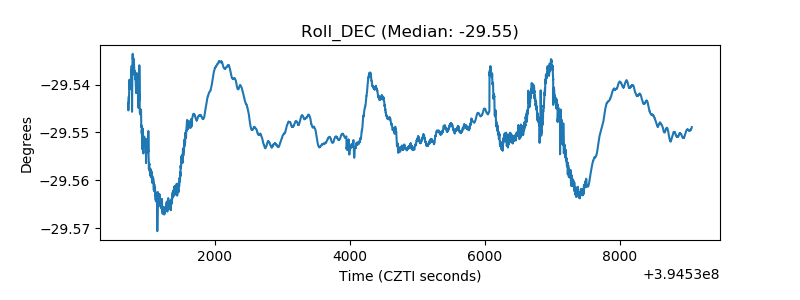 |
| _Roll_RA | 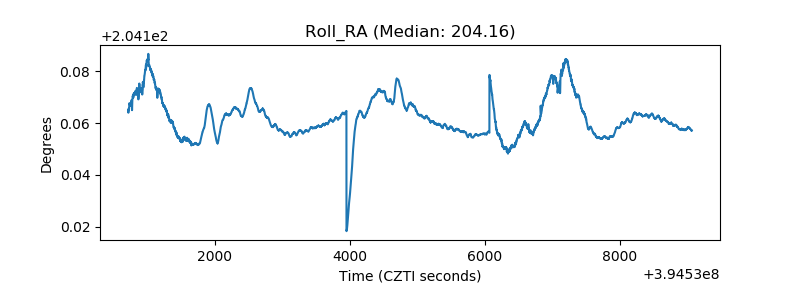 |
| Veto Counter | 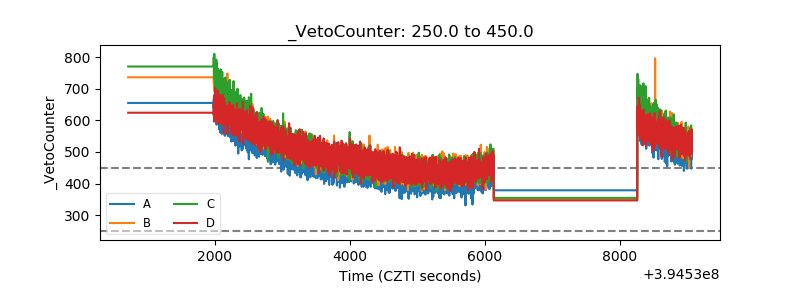 |