| Param | Original file | Final file |
|---|---|---|
| Filename | modeM0/AS1C07_006T01_9000005218_36553cztM0_level2.evt | modeM0/AS1C07_006T01_9000005218_36553cztM0_level2_quad_clean.evt |
| Size (bytes) | 231,857,280 | 29,750,400 |
| Size | 221.1 MB | 28.4 MB |
| Events in quadrant A | 1,422,163 | 182,207 |
| Events in quadrant B | 1,528,813 | 181,920 |
| Events in quadrant C | 1,754,868 | 170,916 |
| Events in quadrant D | 2,130,640 | 171,643 |
| Mode M0 | |||
|---|---|---|---|
| Quadrant | BADHDUFLAG | Total packets | Discarded packets |
| A | 0 | 5943 | 2 |
| B | 0 | 6275 | 1 |
| C | 0 | 6842 | 1 |
| D | 0 | 8436 | 1 |
| Mode SS | |||
|---|---|---|---|
| Quadrant | BADHDUFLAG | Total packets | Discarded packets |
| A | 0 | 56 | 0 |
| B | 0 | 56 | 0 |
| C | 0 | 56 | 0 |
| D | 0 | 56 | 0 |
| Mode M9 | |||
|---|---|---|---|
| Quadrant | BADHDUFLAG | Total packets | Discarded packets |
| A | 0 | 20 | 0 |
| B | 0 | 20 | 0 |
| C | 0 | 20 | 0 |
| D | 0 | 20 | 0 |
| Quadrant | Total seconds | Saturated seconds | Saturation percentage |
|---|---|---|---|
| A | 2705 | 26 | 0.961183% |
| B | 2705 | 25 | 0.924214% |
| C | 2705 | 124 | 4.584104% |
| D | 2705 | 47 | 1.737523% |
Noise dominated data is calculated using 1-second bins in cleaned event files. If a bin has >2000 counts, and if more than 50% of those come from <1% of pixels, then it is considered to be noise-dominated and hence unusable.
| Quadrant | # 1 sec bins | Bins with >0 counts | Bins with >2000 counts | High rate bins dominated by noise | Noise dominated (total time) | Noise dominated (detector-on time) | Marked lightcurve |
|---|---|---|---|---|---|---|---|
| A | 4679 | 2706 | 17 | 17 | 0.36% | 0.63% | 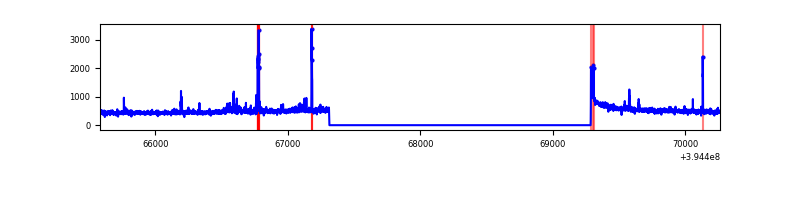 |
| B | 4679 | 2706 | 11 | 11 | 0.24% | 0.41% | 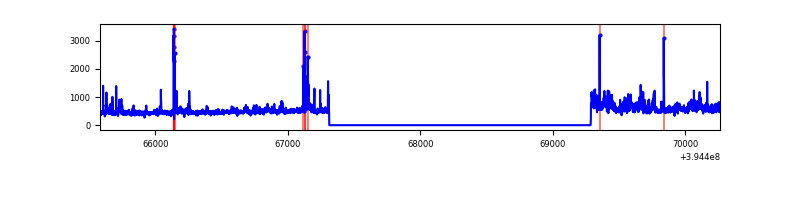 |
| C | 4679 | 2706 | 91 | 91 | 1.94% | 3.36% | 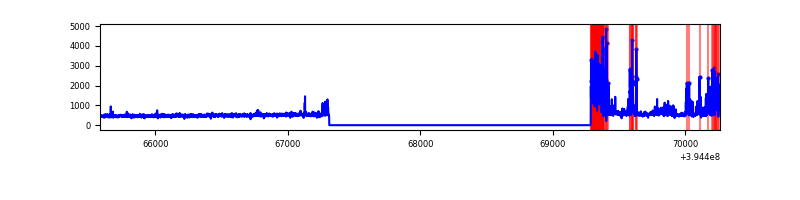 |
| D | 4679 | 2706 | 31 | 31 | 0.66% | 1.15% | 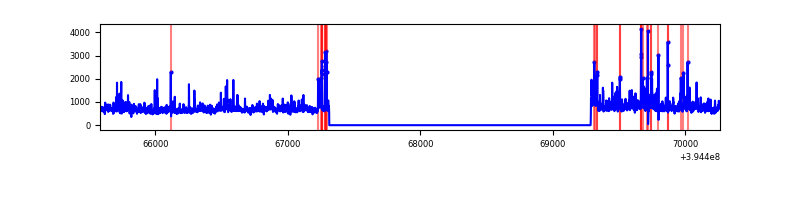 |
Top three noisy pixels from each quadrant. If the there are fewer than three noisy pixels in the level2.evt file, extra rows are filled as -1
| Pixel properties | Quadrant properties | ||||||
|---|---|---|---|---|---|---|---|
| Quadrant | DetID | PixID | Counts | Sigma | Mean | Median | Sigma |
| A | 10 | 83 | 105156 | 1604.64 | 315 | 309 | 65.3 |
| A | 15 | 223 | 82857 | 1263.36 | 315 | 309 | 65.3 |
| A | 9 | 143 | 10823 | 160.91 | 315 | 309 | 65.3 |
| B | 0 | 219 | 90126 | 1463.91 | 313 | 305 | 61.4 |
| B | 5 | 255 | 84272 | 1368.5 | 313 | 305 | 61.4 |
| B | 0 | 189 | 44107 | 713.89 | 313 | 305 | 61.4 |
| C | 0 | 10 | 384645 | 5379.54 | 302 | 303 | 71.4 |
| C | 15 | 214 | 113161 | 1579.65 | 302 | 303 | 71.4 |
| C | 14 | 254 | 53197 | 740.34 | 302 | 303 | 71.4 |
| D | 12 | 235 | 646878 | 8546.1 | 306 | 297 | 75.7 |
| D | 2 | 250 | 63322 | 833.02 | 306 | 297 | 75.7 |
| D | 13 | 249 | 51849 | 681.38 | 306 | 297 | 75.7 |
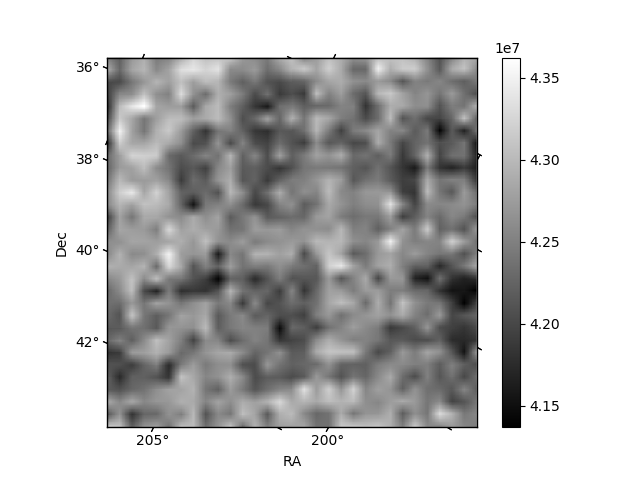
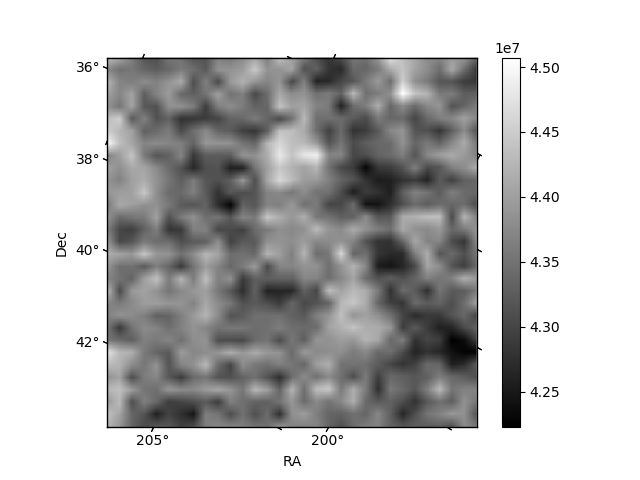
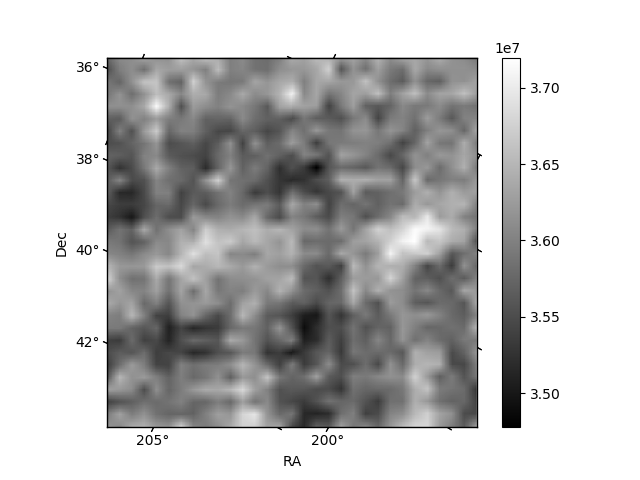
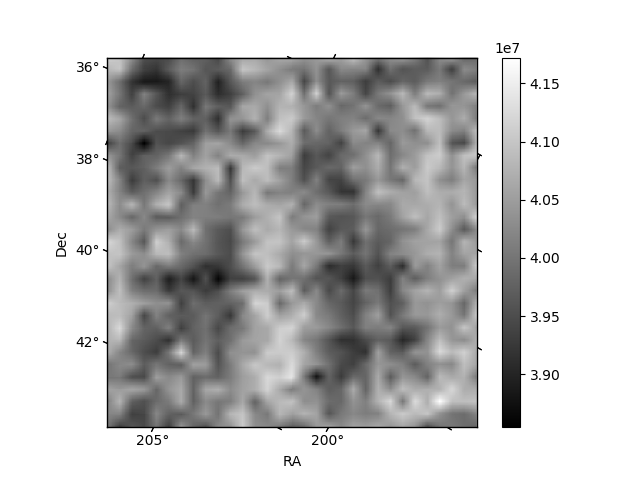
Histogram calculated using DETX and DETY for each event in the final _common_clean file
| Quadrant A | 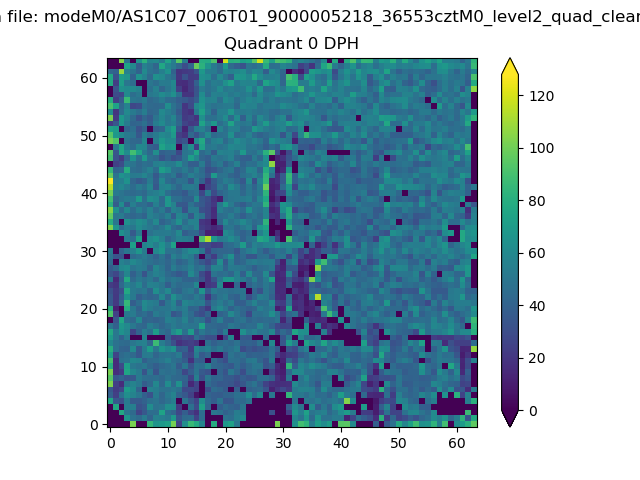 |
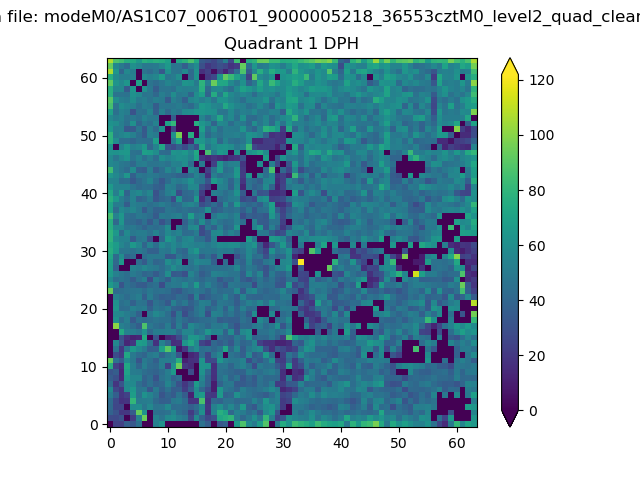 |
Quadrant B |
|---|---|---|---|
| Quadrant D |  |
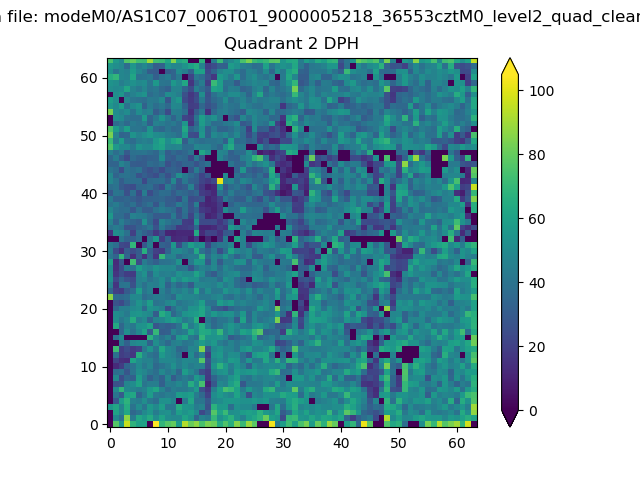 |
Quadrant C |
| Plot type | Count rate plots | Images |
|---|---|---|
| Comparison with Poisson distribution Blue bars denote a histogram of data divided into 1 sec bins. Red curve is a Poisson curve with rate = median count rate of data. |
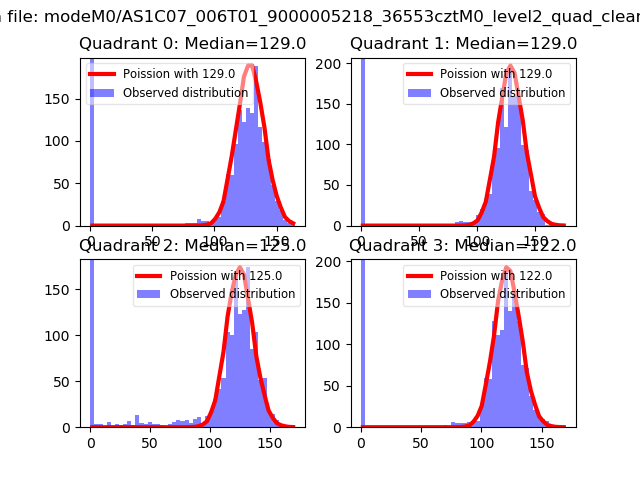 |
 |
| Quadrant-wise count rates Data is divided into 100 sec bins |
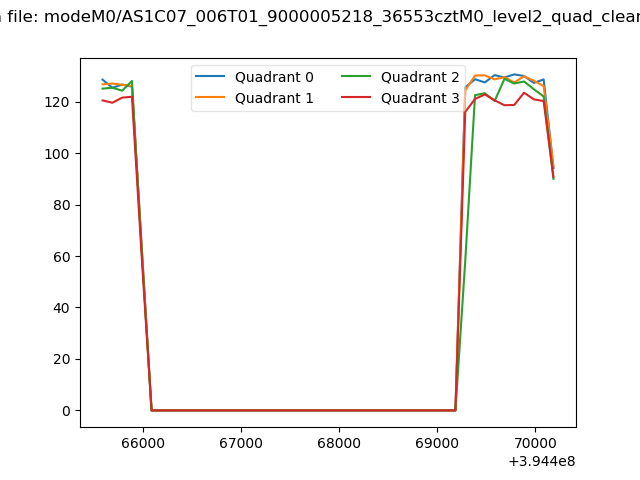 |
|
| Module-wise count rates for Quadrant A Data is divided into 100 sec bins |
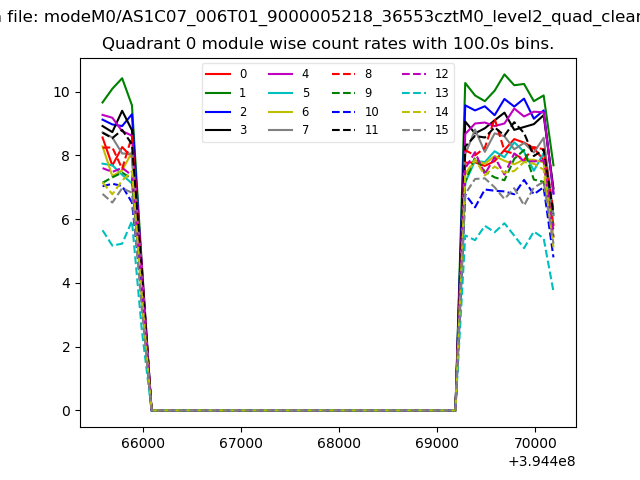 |
 |
| Module-wise count rates for Quadrant B Data is divided into 100 sec bins |
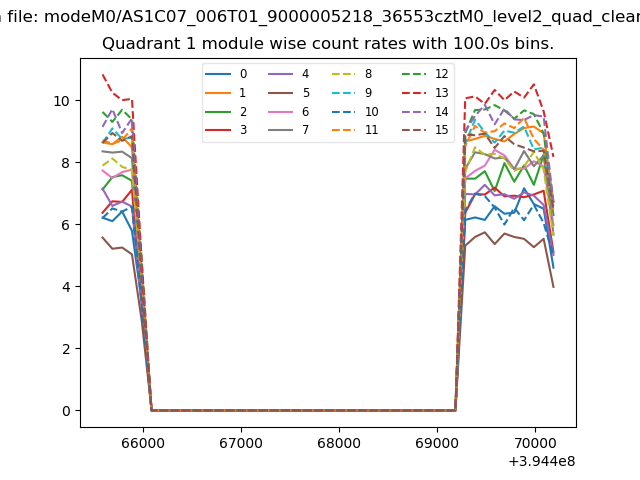 |
 |
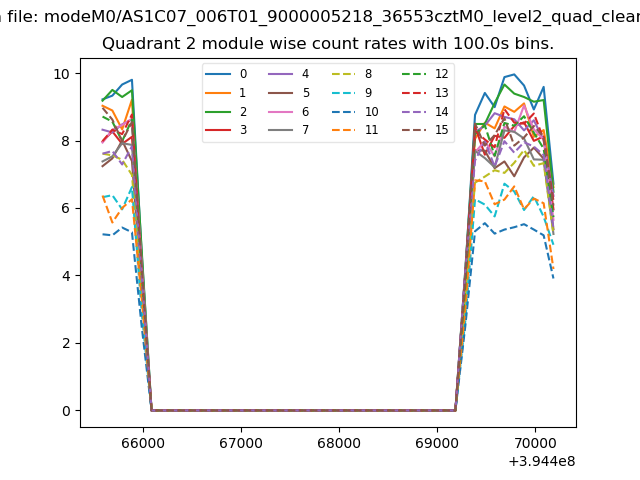
| Module-wise count rates for Quadrant C Data is divided into 100 sec bins |
 |
 |
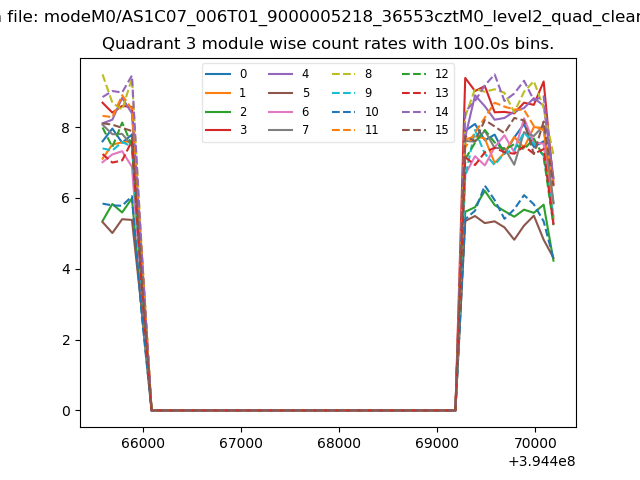
| Module-wise count rates for Quadrant D Data is divided into 100 sec bins |
 |
 |
| Parameter | Plot |
|---|---|
| CZT HV Monitor | 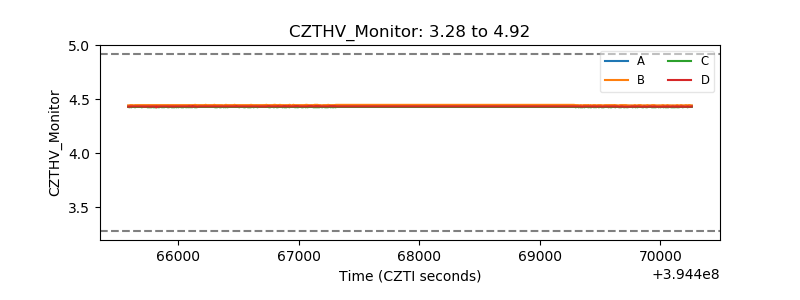 |
| D_VDD | 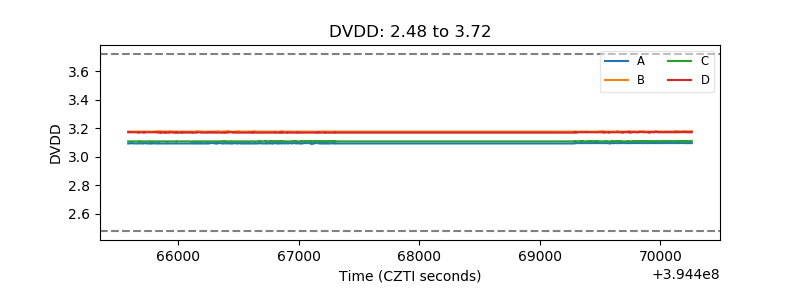 |
| Temperature 1 | 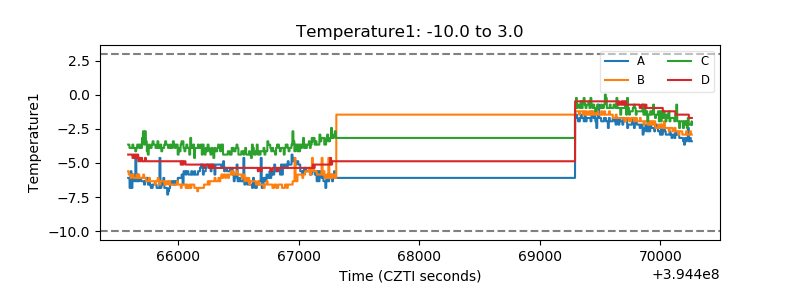 |
| Veto HV Monitor |  |
| Veto LLD | 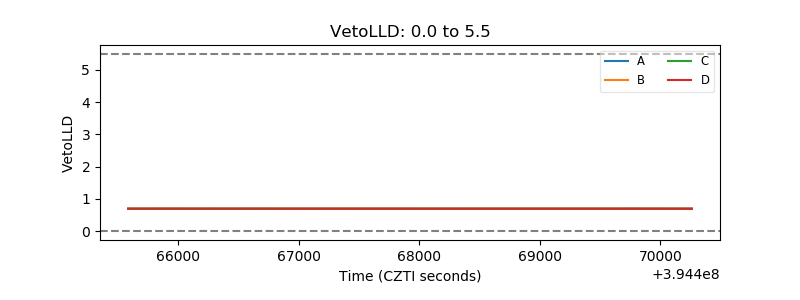 |
| Alpha Counter | 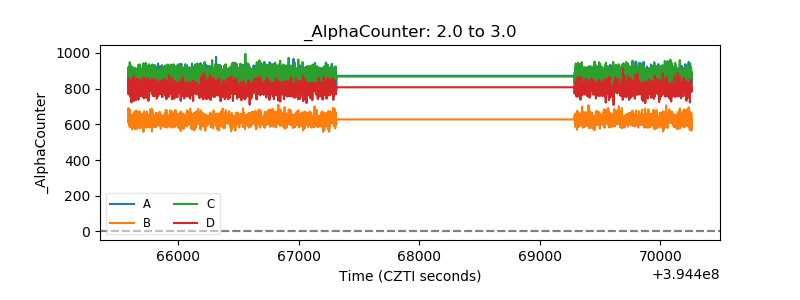 |
| _CPM_Rate | 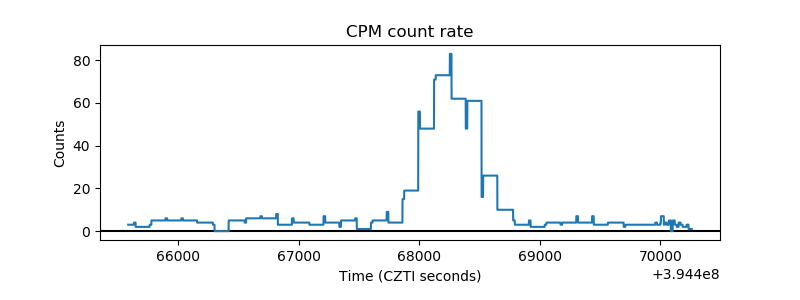 |
| CZT Counter | 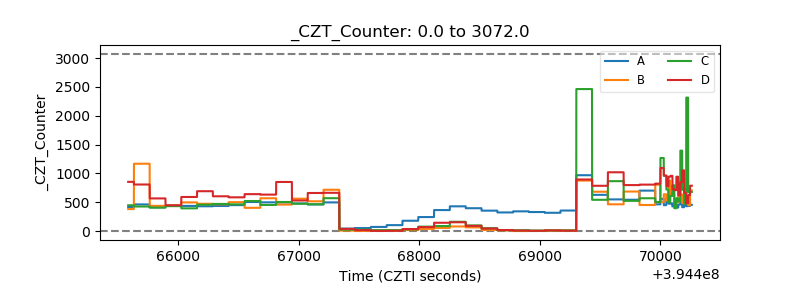 |
| +2.5 Volts monitor |  |
| +5 Volts monitor |  |
| _ROLL_ROT | 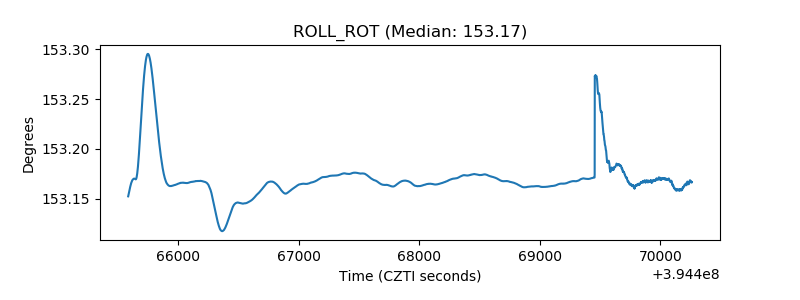 |
| _Roll_DEC | 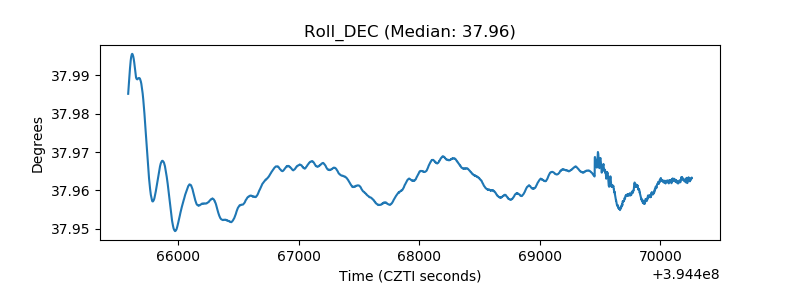 |
| _Roll_RA | 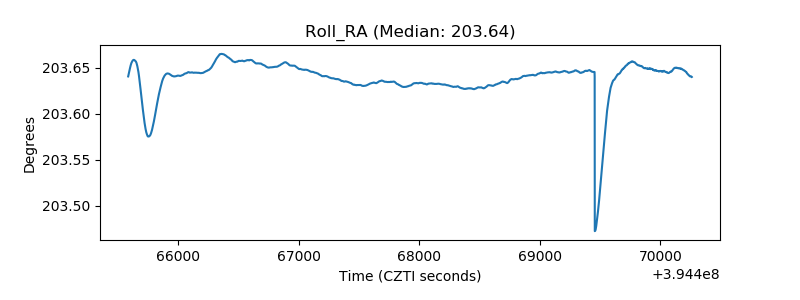 |
| Veto Counter | 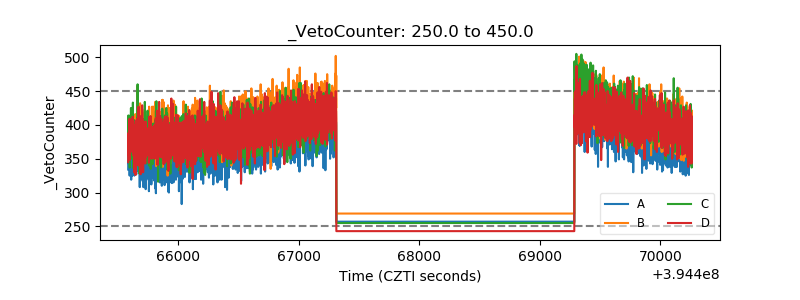 |