| Param | Original file | Final file |
|---|---|---|
| Filename | modeM0/AS1C07_006T01_9000005218_36554cztM0_level2.evt | modeM0/AS1C07_006T01_9000005218_36554cztM0_level2_quad_clean.evt |
| Size (bytes) | 280,575,360 | 49,245,120 |
| Size | 267.6 MB | 47.0 MB |
| Events in quadrant A | 1,557,597 | 324,293 |
| Events in quadrant B | 1,876,136 | 321,113 |
| Events in quadrant C | 1,981,692 | 312,273 |
| Events in quadrant D | 2,857,804 | 300,198 |
| Mode M0 | |||
|---|---|---|---|
| Quadrant | BADHDUFLAG | Total packets | Discarded packets |
| A | 0 | 6902 | 1 |
| B | 0 | 7777 | 1 |
| C | 0 | 8016 | 1 |
| D | 0 | 10943 | 1 |
| Mode SS | |||
|---|---|---|---|
| Quadrant | BADHDUFLAG | Total packets | Discarded packets |
| A | 0 | 66 | 0 |
| B | 0 | 66 | 0 |
| C | 0 | 66 | 0 |
| D | 0 | 66 | 0 |
| Mode M9 | |||
|---|---|---|---|
| Quadrant | BADHDUFLAG | Total packets | Discarded packets |
| A | 1 | 140058357476136 | 46 |
| B | 1 | -1 | -1 |
| C | 1 | -1 | -1 |
| D | 1 | -1 | -1 |
| Quadrant | Total seconds | Saturated seconds | Saturation percentage |
|---|---|---|---|
| A | 3281 | 6 | 0.182871% |
| B | 3281 | 30 | 0.914355% |
| C | 3281 | 123 | 3.748857% |
| D | 3281 | 122 | 3.718379% |
Noise dominated data is calculated using 1-second bins in cleaned event files. If a bin has >2000 counts, and if more than 50% of those come from <1% of pixels, then it is considered to be noise-dominated and hence unusable.
| Quadrant | # 1 sec bins | Bins with >0 counts | Bins with >2000 counts | High rate bins dominated by noise | Noise dominated (total time) | Noise dominated (detector-on time) | Marked lightcurve |
|---|---|---|---|---|---|---|---|
| A | 3281 | 3281 | 4 | 4 | 0.12% | 0.12% | 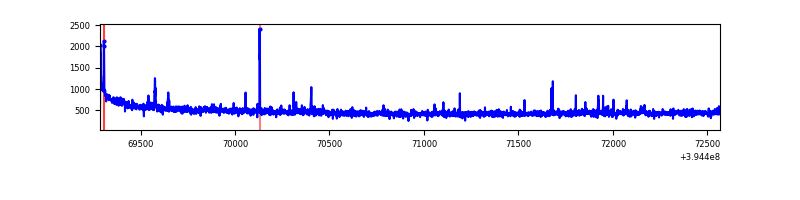 |
| B | 3281 | 3281 | 15 | 15 | 0.46% | 0.46% | 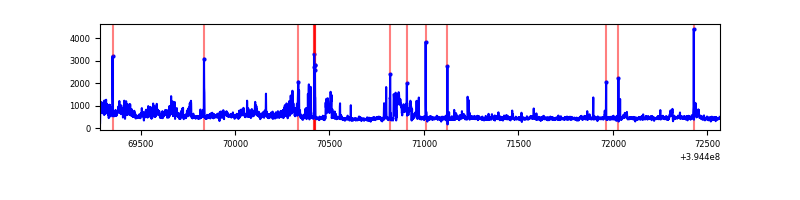 |
| C | 3281 | 3281 | 92 | 92 | 2.80% | 2.80% | 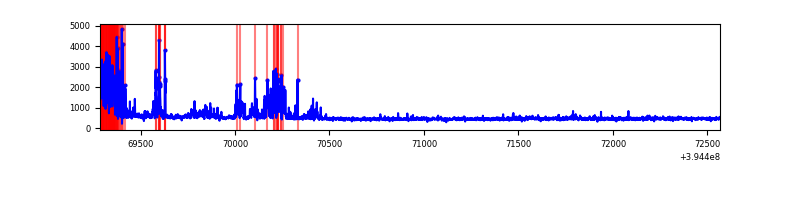 |
| D | 3281 | 3281 | 103 | 103 | 3.14% | 3.14% | 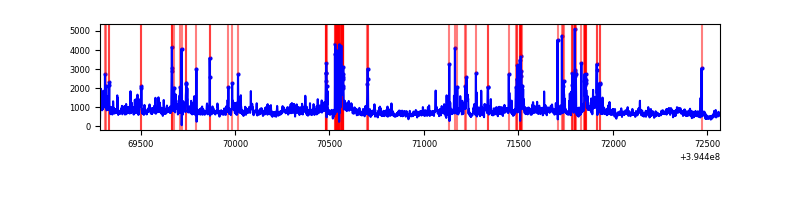 |
Top three noisy pixels from each quadrant. If the there are fewer than three noisy pixels in the level2.evt file, extra rows are filled as -1
| Pixel properties | Quadrant properties | ||||||
|---|---|---|---|---|---|---|---|
| Quadrant | DetID | PixID | Counts | Sigma | Mean | Median | Sigma |
| A | 10 | 83 | 121013 | 1634.18 | 358 | 351 | 73.8 |
| A | 15 | 223 | 30112 | 403.07 | 358 | 351 | 73.8 |
| A | 9 | 143 | 14137 | 186.71 | 358 | 351 | 73.8 |
| B | 0 | 213 | 96495 | 1416.01 | 354 | 344 | 67.9 |
| B | 0 | 219 | 92631 | 1359.11 | 354 | 344 | 67.9 |
| B | 5 | 255 | 92311 | 1354.4 | 354 | 344 | 67.9 |
| C | 0 | 10 | 425095 | 5196.77 | 346 | 349 | 81.7 |
| C | 15 | 214 | 136923 | 1670.99 | 346 | 349 | 81.7 |
| C | 14 | 254 | 48506 | 589.2 | 346 | 349 | 81.7 |
| D | 12 | 235 | 917809 | 10660.17 | 347 | 338 | 86.1 |
| D | 13 | 249 | 238339 | 2765.35 | 347 | 338 | 86.1 |
| D | 2 | 153 | 78683 | 910.3 | 347 | 338 | 86.1 |
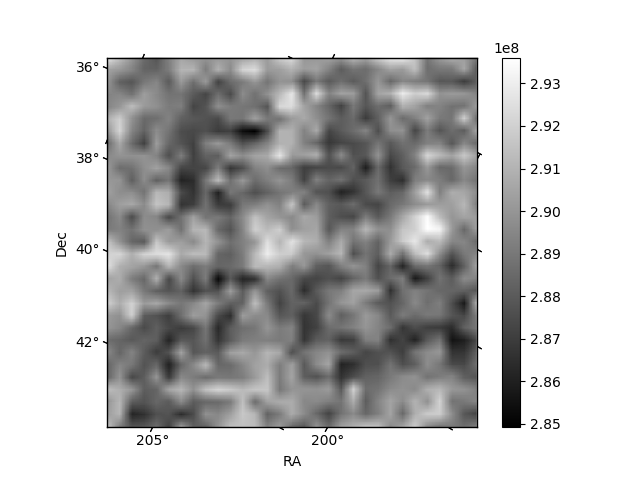
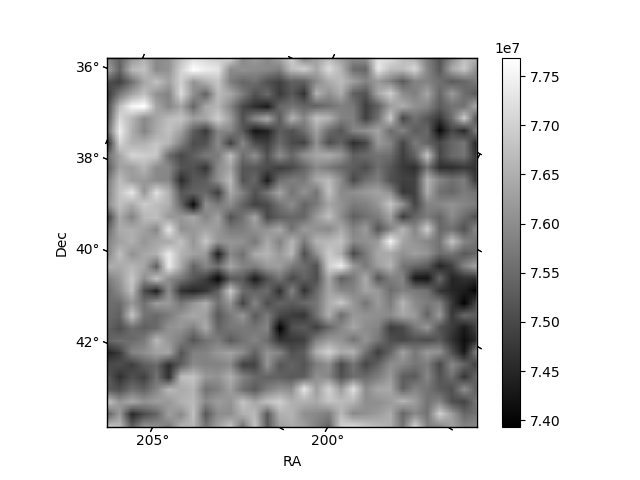
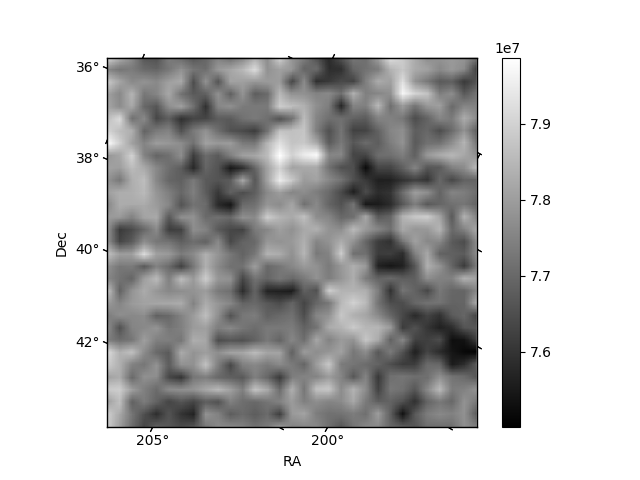
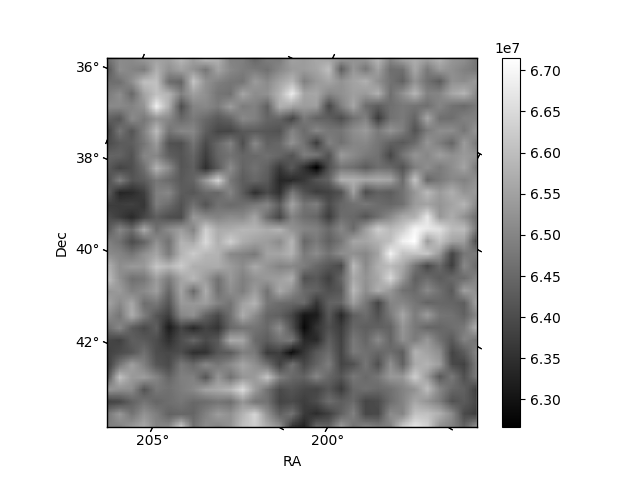
Histogram calculated using DETX and DETY for each event in the final _common_clean file
| Quadrant A | 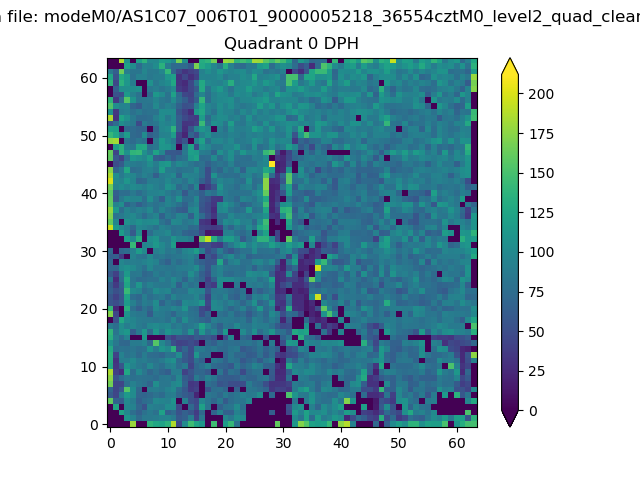 |
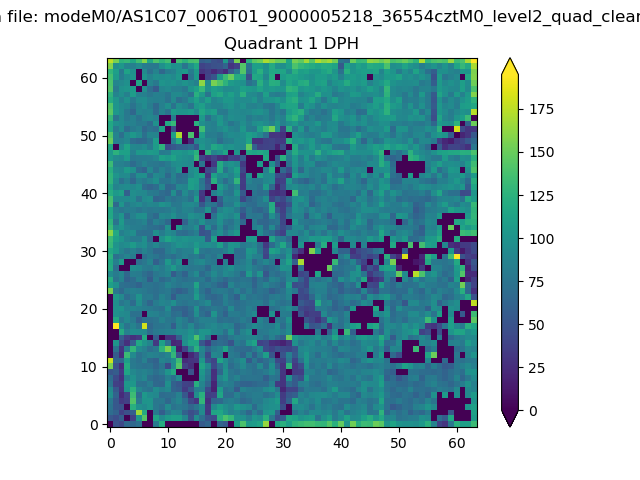 |
Quadrant B |
|---|---|---|---|
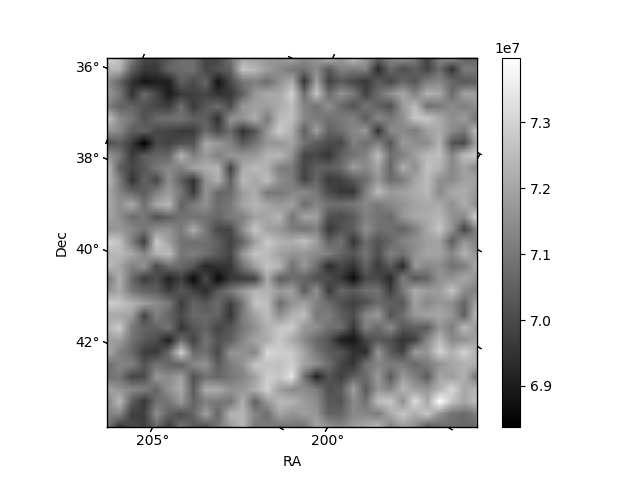
| Quadrant D | 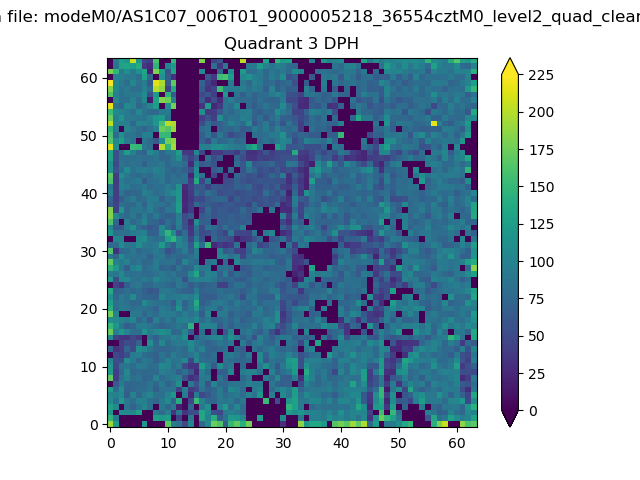 |
 |
Quadrant C |
| Plot type | Count rate plots | Images |
|---|---|---|
| Comparison with Poisson distribution Blue bars denote a histogram of data divided into 1 sec bins. Red curve is a Poisson curve with rate = median count rate of data. |
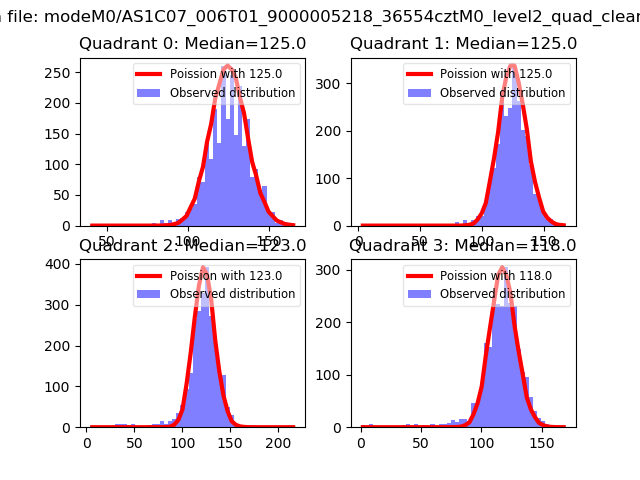 |
 |
| Quadrant-wise count rates Data is divided into 100 sec bins |
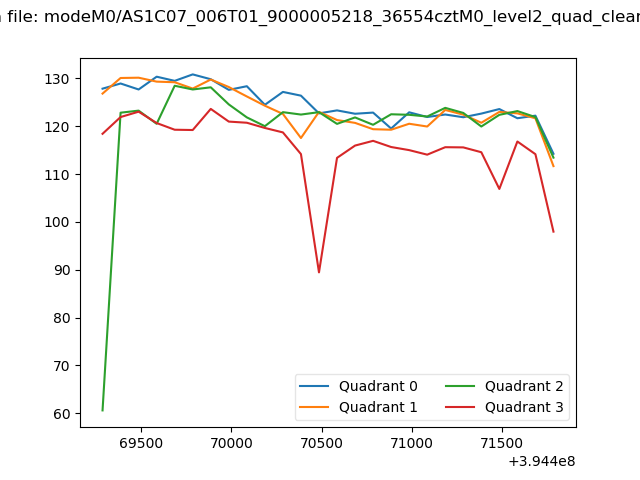 |
|
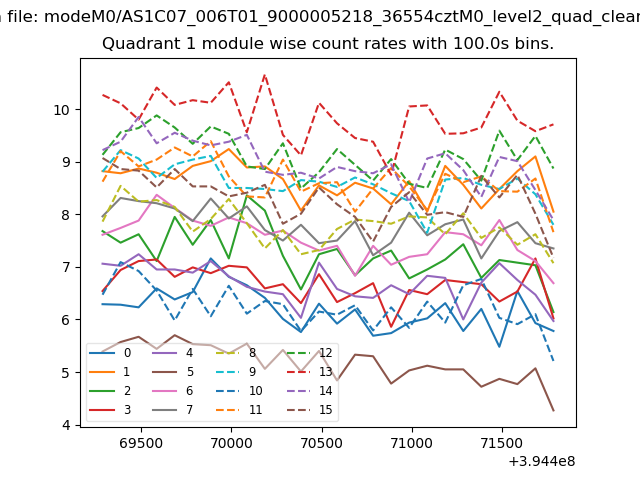
| Module-wise count rates for Quadrant A Data is divided into 100 sec bins |
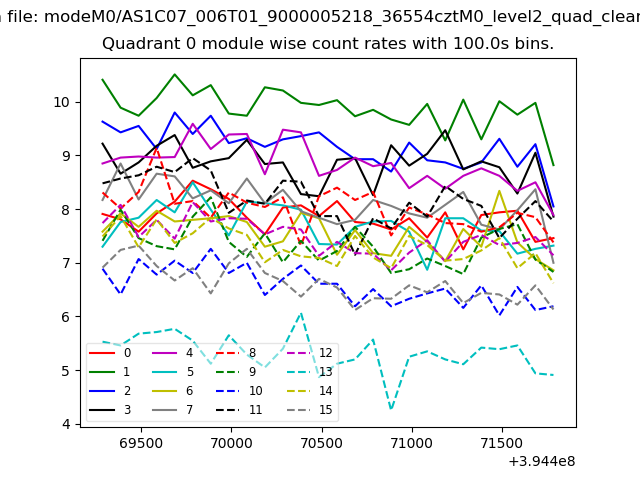 |
 |
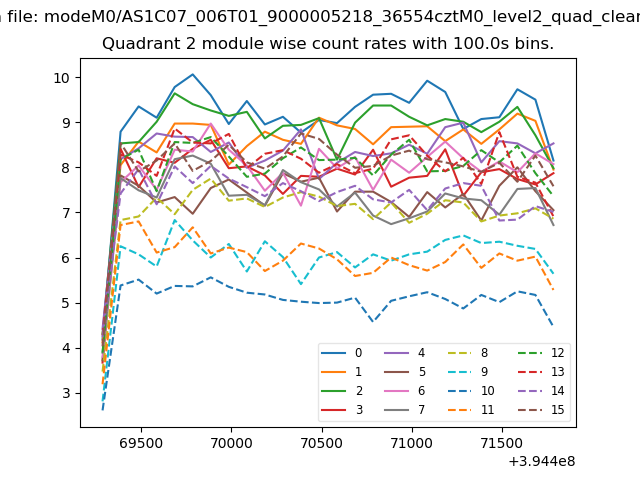
| Module-wise count rates for Quadrant B Data is divided into 100 sec bins |
 |
 |
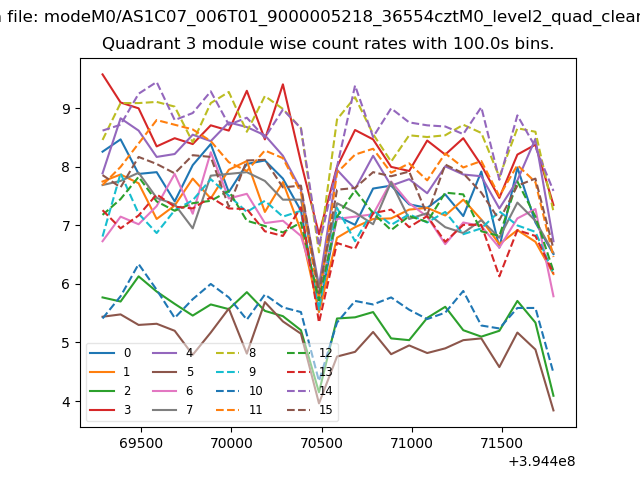
| Module-wise count rates for Quadrant C Data is divided into 100 sec bins |
 |
 |
| Module-wise count rates for Quadrant D Data is divided into 100 sec bins |
 |
 |
| Parameter | Plot |
|---|---|
| CZT HV Monitor | 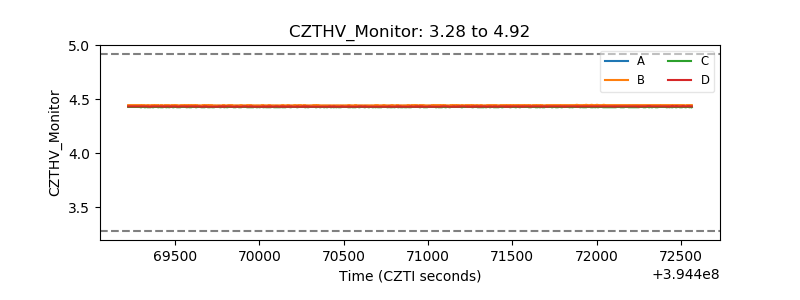 |
| D_VDD | 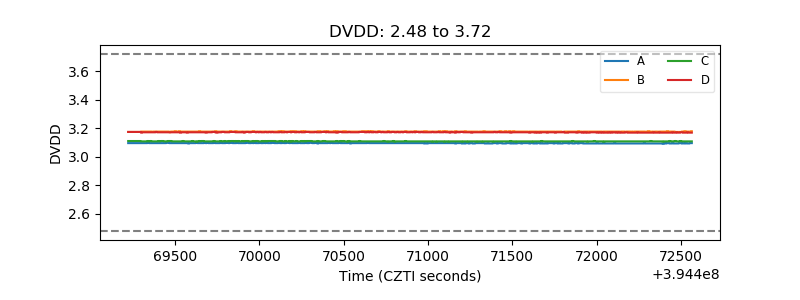 |
| Temperature 1 | 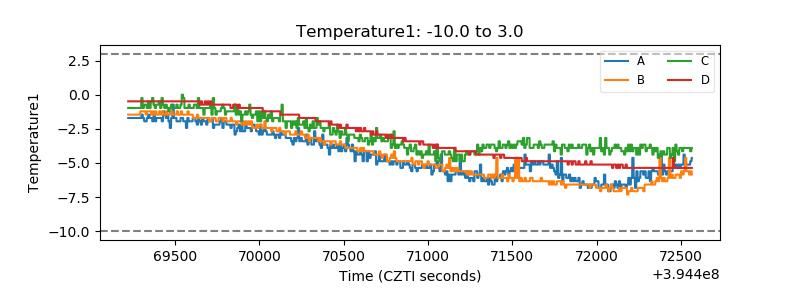 |
| Veto HV Monitor |  |
| Veto LLD | 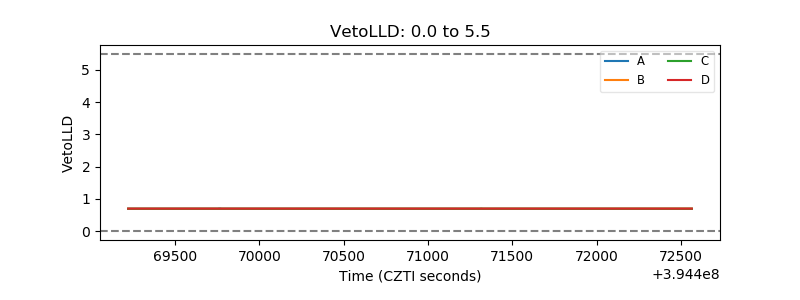 |
| Alpha Counter | 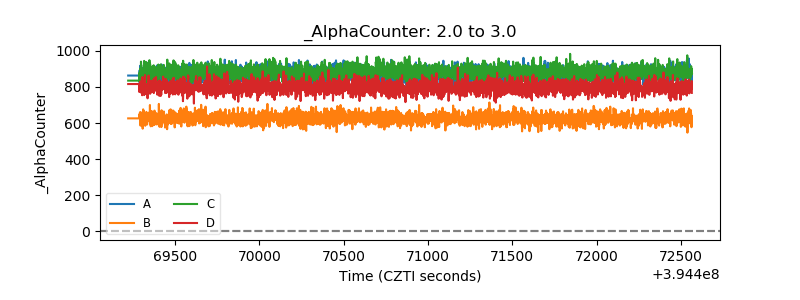 |
| _CPM_Rate | 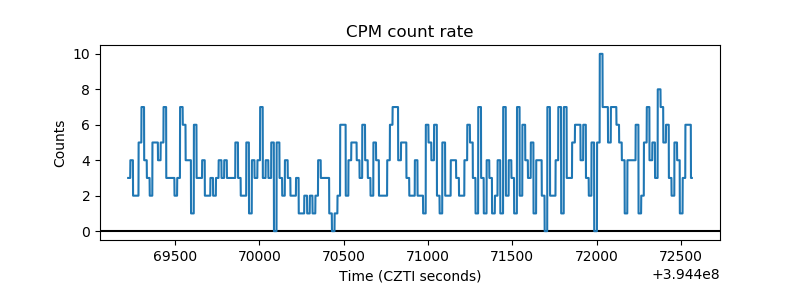 |
| CZT Counter | 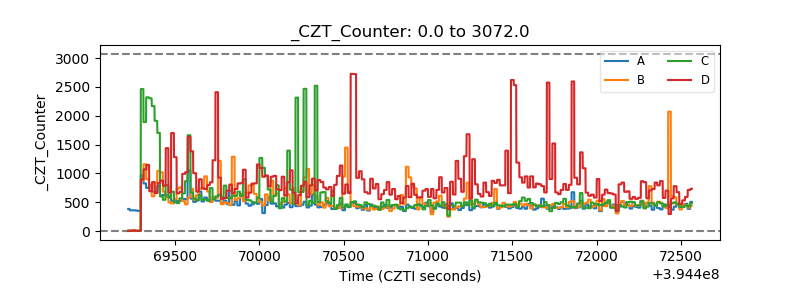 |
| +2.5 Volts monitor |  |
| +5 Volts monitor |  |
| _ROLL_ROT | 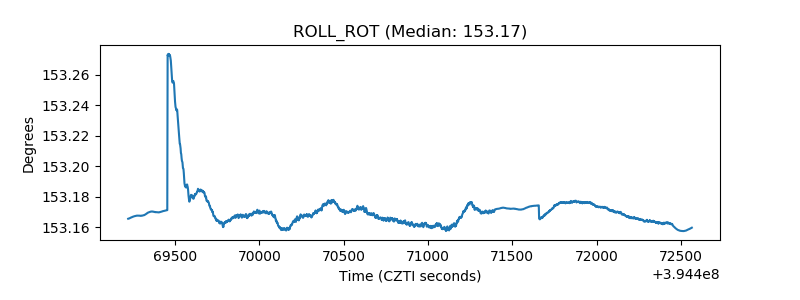 |
| _Roll_DEC | 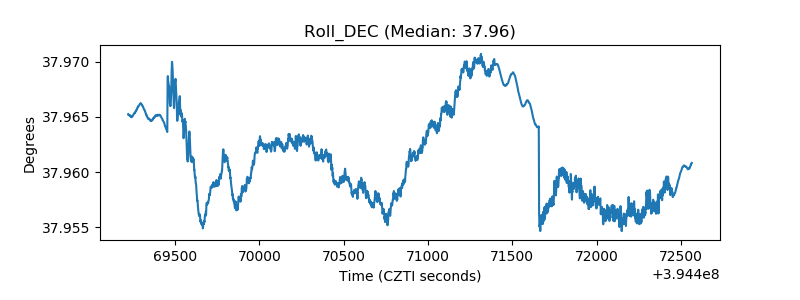 |
| _Roll_RA |  |
| Veto Counter | 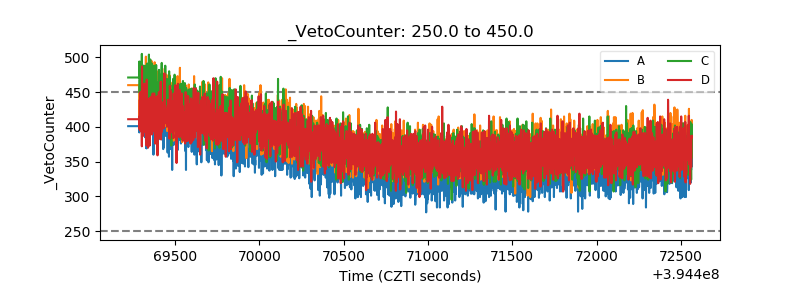 |