| Param | Original file | Final file |
|---|---|---|
| Filename | modeM0/AS1A11_097T17_9000005222_36566cztM0_level2.evt | modeM0/AS1A11_097T17_9000005222_36566cztM0_level2_quad_clean.evt |
| Size (bytes) | 159,995,520 | 36,195,840 |
| Size | 152.6 MB | 34.5 MB |
| Events in quadrant A | 1,017,480 | 248,285 |
| Events in quadrant B | 1,211,272 | 245,407 |
| Events in quadrant C | 1,282,299 | 236,592 |
| Events in quadrant D | 1,206,646 | 230,834 |
| Mode M0 | |||
|---|---|---|---|
| Quadrant | BADHDUFLAG | Total packets | Discarded packets |
| A | 0 | 4082 | 2 |
| B | 0 | 4653 | 1 |
| C | 0 | 4858 | 1 |
| D | 0 | 4731 | 1 |
| Mode M9 | |||
|---|---|---|---|
| Quadrant | BADHDUFLAG | Total packets | Discarded packets |
| A | 0 | 22 | 0 |
| B | 0 | 22 | 0 |
| C | 0 | 22 | 0 |
| D | 0 | 22 | 0 |
| Mode SS | |||
|---|---|---|---|
| Quadrant | BADHDUFLAG | Total packets | Discarded packets |
| A | 0 | 38 | 0 |
| B | 0 | 38 | 0 |
| C | 0 | 38 | 0 |
| D | 0 | 38 | 0 |
| Quadrant | Total seconds | Saturated seconds | Saturation percentage |
|---|---|---|---|
| A | 1847 | 2 | 0.108284% |
| B | 1847 | 75 | 4.060639% |
| C | 1847 | 99 | 5.360043% |
| D | 1847 | 45 | 2.436383% |
Noise dominated data is calculated using 1-second bins in cleaned event files. If a bin has >2000 counts, and if more than 50% of those come from <1% of pixels, then it is considered to be noise-dominated and hence unusable.
| Quadrant | # 1 sec bins | Bins with >0 counts | Bins with >2000 counts | High rate bins dominated by noise | Noise dominated (total time) | Noise dominated (detector-on time) | Marked lightcurve |
|---|---|---|---|---|---|---|---|
| A | 4001 | 1848 | 0 | 0 | 0.00% | 0.00% | 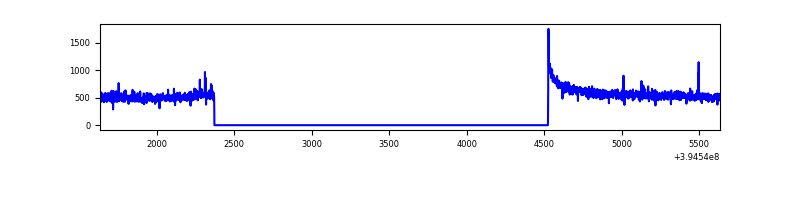 |
| B | 4001 | 1848 | 45 | 45 | 1.12% | 2.44% | 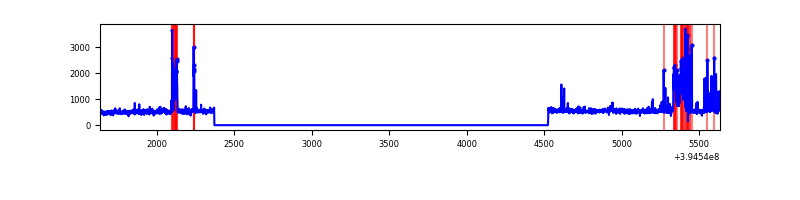 |
| C | 4001 | 1848 | 70 | 70 | 1.75% | 3.79% | 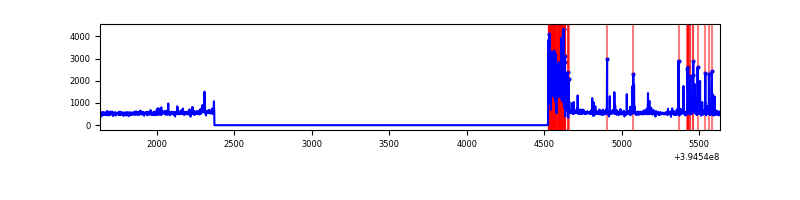 |
| D | 4001 | 1848 | 32 | 32 | 0.80% | 1.73% | 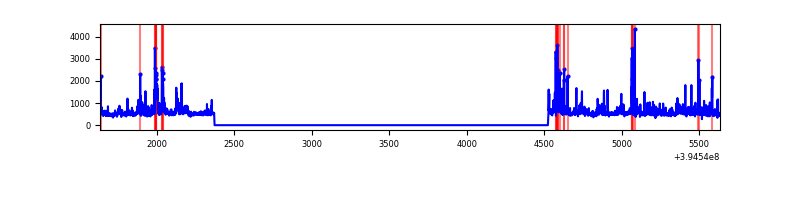 |
Top three noisy pixels from each quadrant. If the there are fewer than three noisy pixels in the level2.evt file, extra rows are filled as -1
| Pixel properties | Quadrant properties | ||||||
|---|---|---|---|---|---|---|---|
| Quadrant | DetID | PixID | Counts | Sigma | Mean | Median | Sigma |
| A | 10 | 83 | 84989 | 1725.75 | 237 | 232 | 49.1 |
| A | 9 | 143 | 4996 | 97.0 | 237 | 232 | 49.1 |
| A | 15 | 223 | 4832 | 93.66 | 237 | 232 | 49.1 |
| B | 5 | 255 | 184940 | 4052.69 | 230 | 224 | 45.6 |
| B | 0 | 156 | 50996 | 1113.94 | 230 | 224 | 45.6 |
| B | 0 | 229 | 18046 | 391.02 | 230 | 224 | 45.6 |
| C | 0 | 10 | 251507 | 4636.63 | 224 | 226 | 54.2 |
| C | 15 | 214 | 79570 | 1464.05 | 224 | 226 | 54.2 |
| C | 14 | 254 | 63001 | 1158.32 | 224 | 226 | 54.2 |
| D | 2 | 153 | 101179 | 1767.6 | 228 | 224 | 57.1 |
| D | 13 | 249 | 47631 | 830.04 | 228 | 224 | 57.1 |
| D | 2 | 250 | 33291 | 578.96 | 228 | 224 | 57.1 |
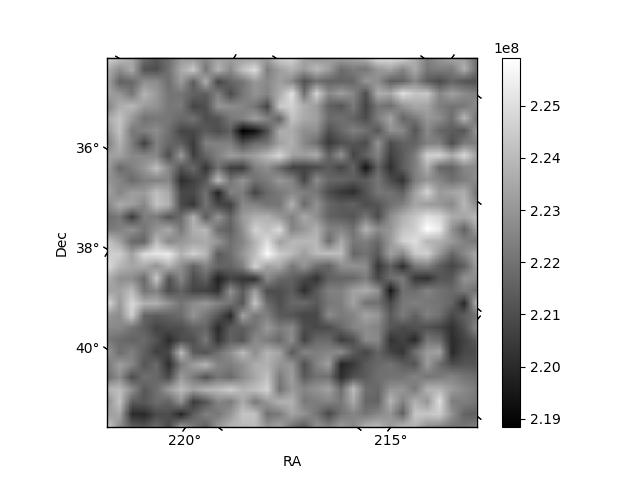
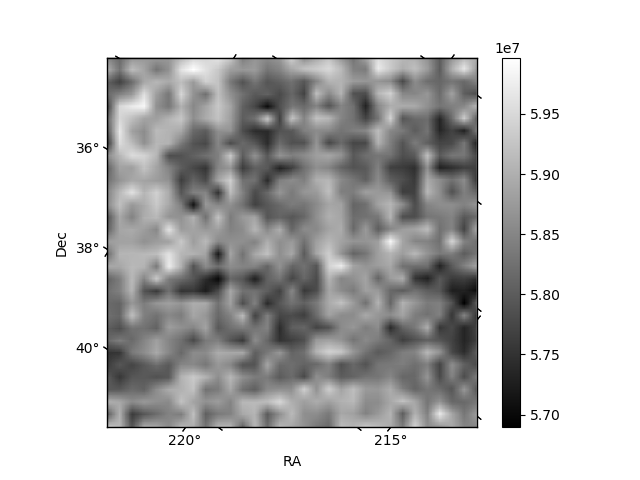
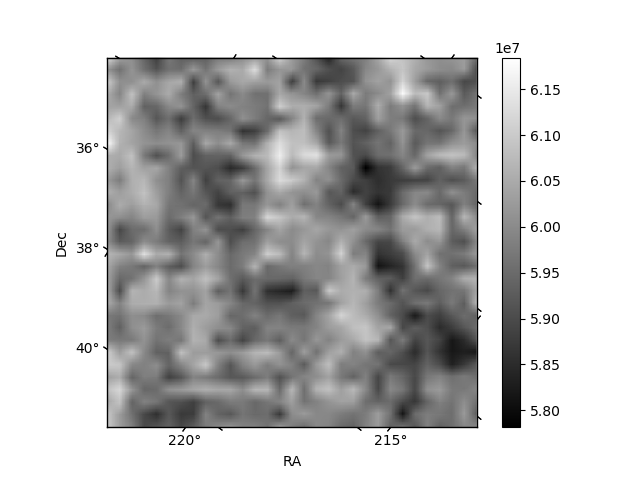
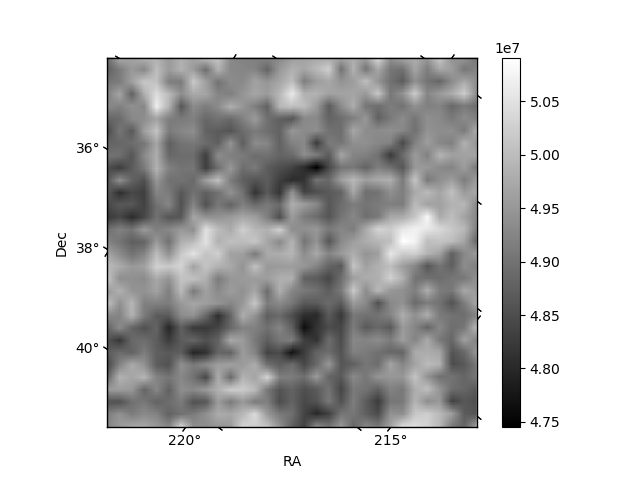
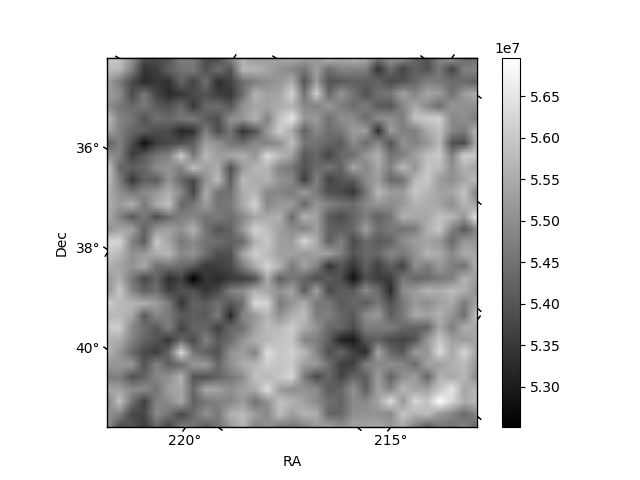
Histogram calculated using DETX and DETY for each event in the final _common_clean file
| Quadrant A | 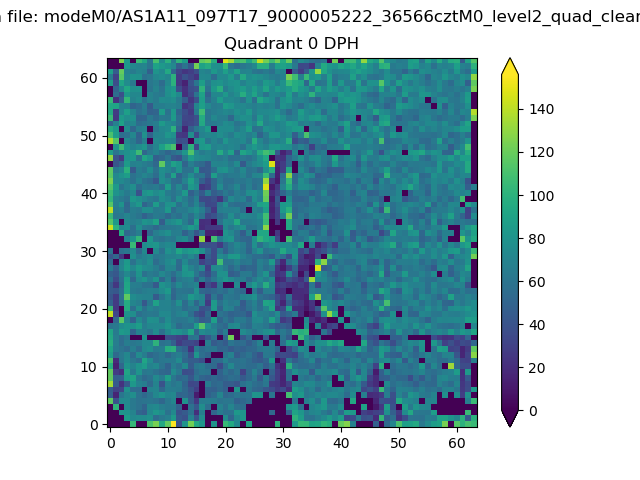 |
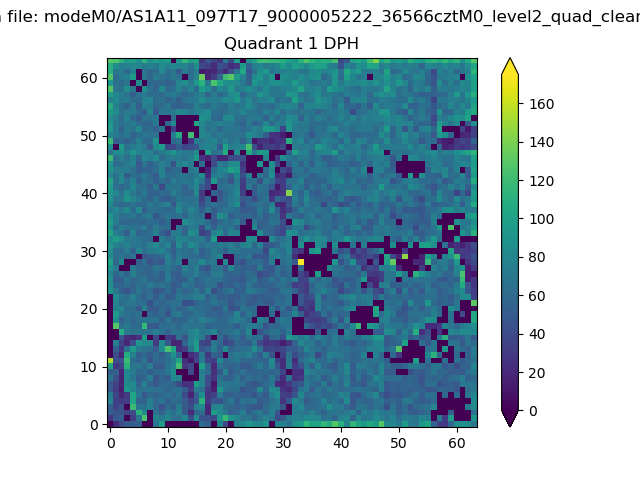 |
Quadrant B |
|---|---|---|---|
| Quadrant D | 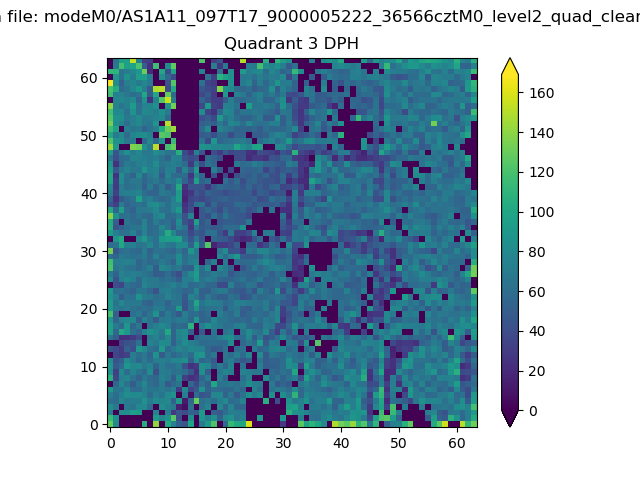 |
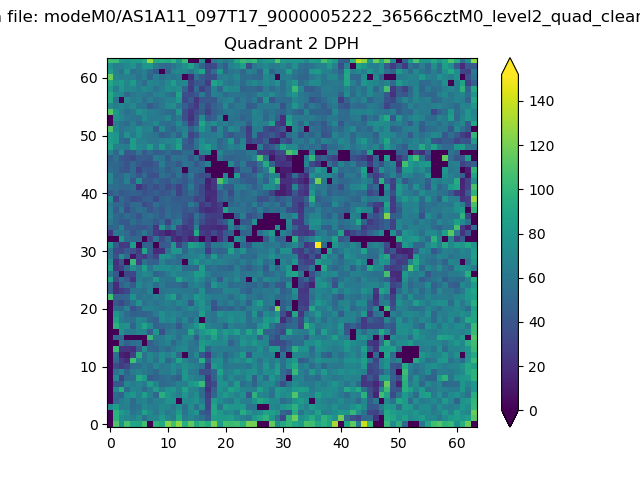 |
Quadrant C |
| Plot type | Count rate plots | Images |
|---|---|---|
| Comparison with Poisson distribution Blue bars denote a histogram of data divided into 1 sec bins. Red curve is a Poisson curve with rate = median count rate of data. |
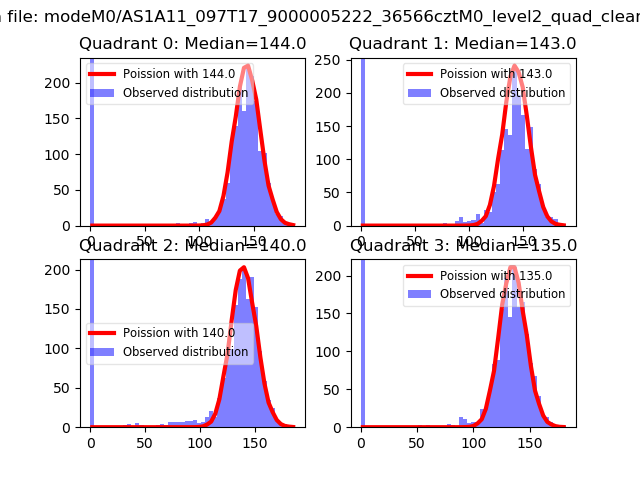 |
 |
| Quadrant-wise count rates Data is divided into 100 sec bins |
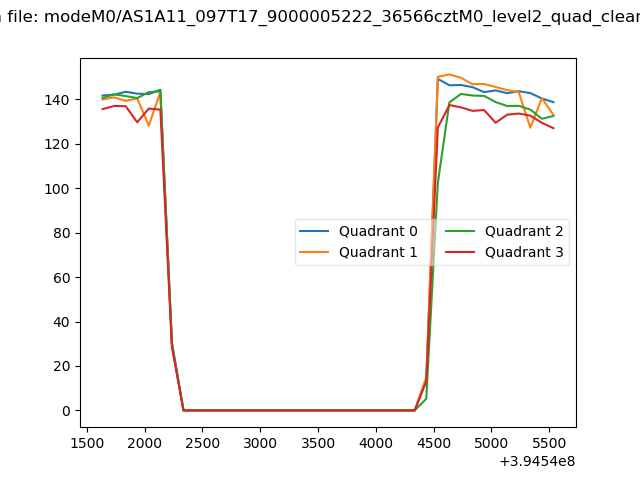 |
|
| Module-wise count rates for Quadrant A Data is divided into 100 sec bins |
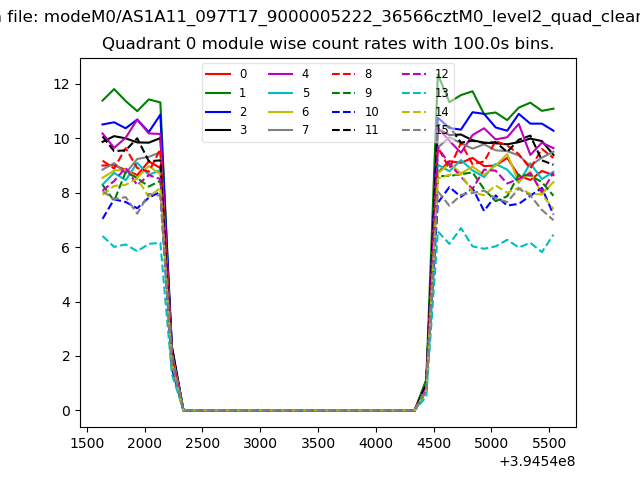 |
 |
| Module-wise count rates for Quadrant B Data is divided into 100 sec bins |
 |
 |
| Module-wise count rates for Quadrant C Data is divided into 100 sec bins |
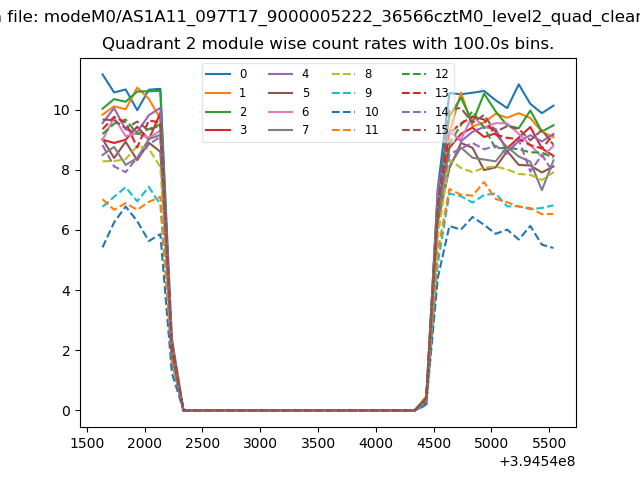 |
 |
| Module-wise count rates for Quadrant D Data is divided into 100 sec bins |
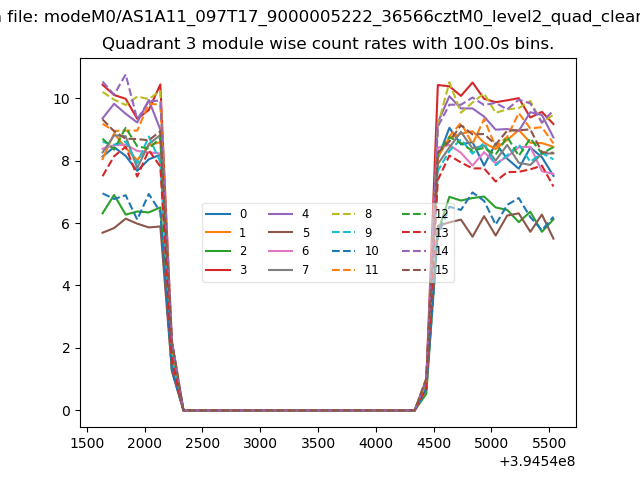 |
 |
| Parameter | Plot |
|---|---|
| CZT HV Monitor |  |
| D_VDD | 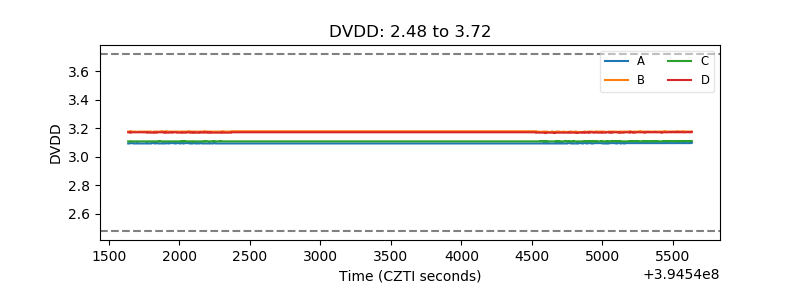 |
| Temperature 1 | 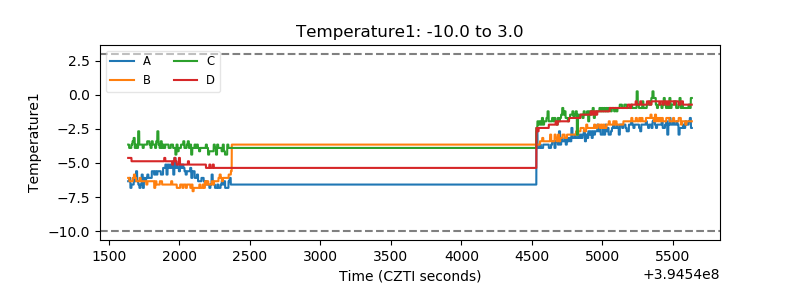 |
| Veto HV Monitor | 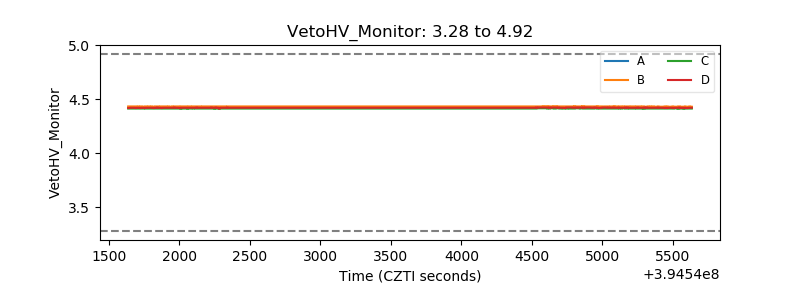 |
| Veto LLD | 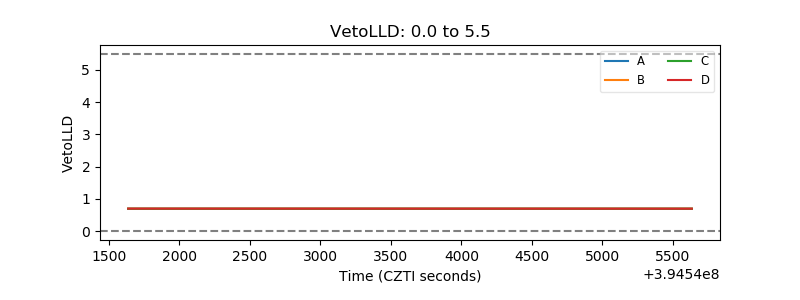 |
| Alpha Counter | 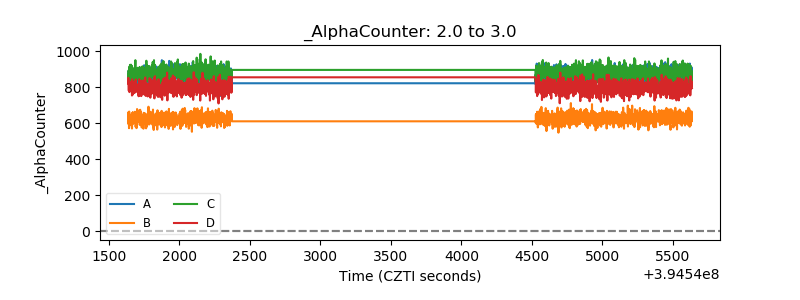 |
| _CPM_Rate | 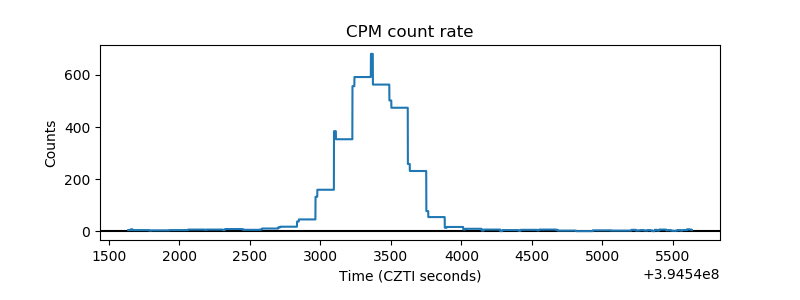 |
| CZT Counter | 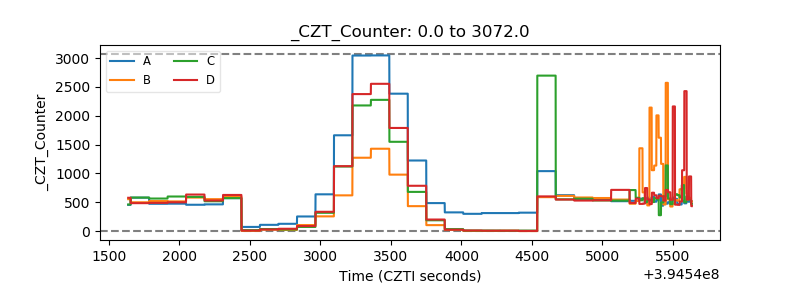 |
| +2.5 Volts monitor |  |
| +5 Volts monitor |  |
| _ROLL_ROT | 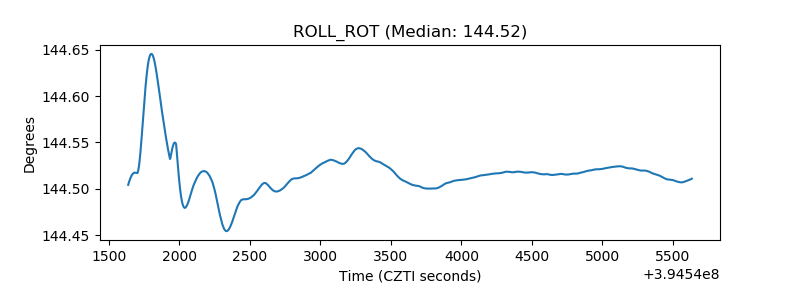 |
| _Roll_DEC | 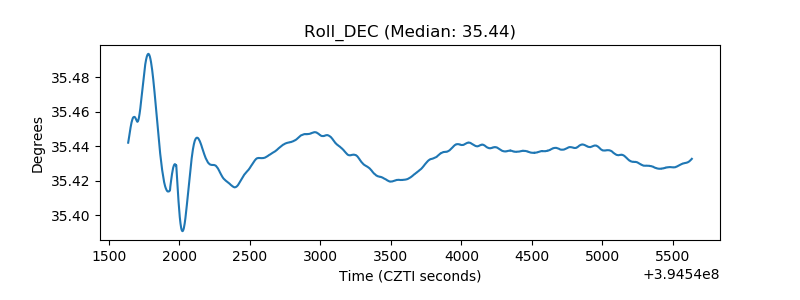 |
| _Roll_RA | 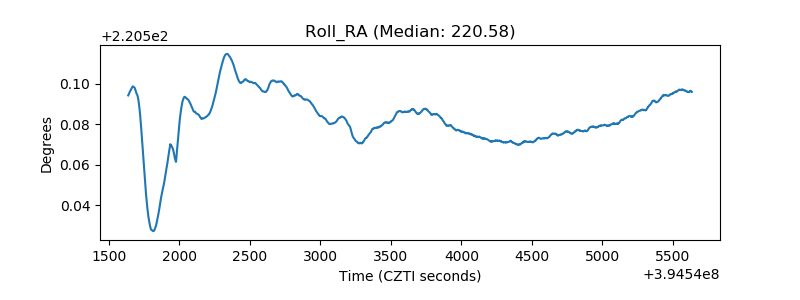 |
| Veto Counter | 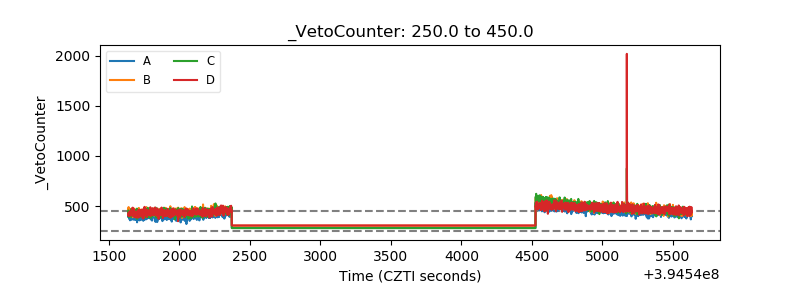 |