| Param | Original file | Final file |
|---|---|---|
| Filename | modeM0/AS1A11_097T17_9000005222_36567cztM0_level2.evt | modeM0/AS1A11_097T17_9000005222_36567cztM0_level2_quad_clean.evt |
| Size (bytes) | 379,056,960 | 84,948,480 |
| Size | 361.5 MB | 81.0 MB |
| Events in quadrant A | 2,429,950 | 573,005 |
| Events in quadrant B | 2,714,292 | 568,388 |
| Events in quadrant C | 2,718,384 | 559,158 |
| Events in quadrant D | 3,288,179 | 532,762 |
| Mode M0 | |||
|---|---|---|---|
| Quadrant | BADHDUFLAG | Total packets | Discarded packets |
| A | 0 | 10088 | 2 |
| B | 0 | 10938 | 1 |
| C | 0 | 10813 | 1 |
| D | 0 | 12928 | 1 |
| Mode M9 | |||
|---|---|---|---|
| Quadrant | BADHDUFLAG | Total packets | Discarded packets |
| A | 0 | 20 | 0 |
| B | 0 | 20 | 0 |
| C | 0 | 20 | 0 |
| D | 0 | 20 | 0 |
| Mode SS | |||
|---|---|---|---|
| Quadrant | BADHDUFLAG | Total packets | Discarded packets |
| A | 0 | 100 | 0 |
| B | 0 | 100 | 0 |
| C | 0 | 100 | 0 |
| D | 0 | 100 | 0 |
| Quadrant | Total seconds | Saturated seconds | Saturation percentage |
|---|---|---|---|
| A | 4829 | 9 | 0.186374% |
| B | 4829 | 57 | 1.180369% |
| C | 4829 | 71 | 1.470284% |
| D | 4829 | 213 | 4.410851% |
Noise dominated data is calculated using 1-second bins in cleaned event files. If a bin has >2000 counts, and if more than 50% of those come from <1% of pixels, then it is considered to be noise-dominated and hence unusable.
| Quadrant | # 1 sec bins | Bins with >0 counts | Bins with >2000 counts | High rate bins dominated by noise | Noise dominated (total time) | Noise dominated (detector-on time) | Marked lightcurve |
|---|---|---|---|---|---|---|---|
| A | 6892 | 4830 | 1 | 1 | 0.01% | 0.02% | 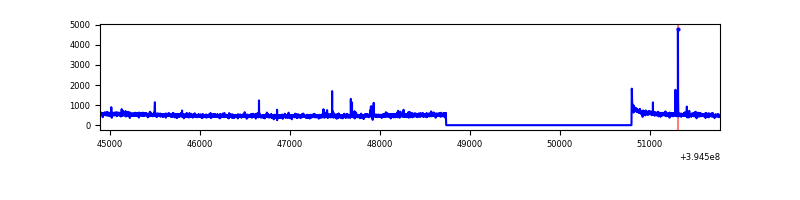 |
| B | 6892 | 4830 | 35 | 35 | 0.51% | 0.72% | 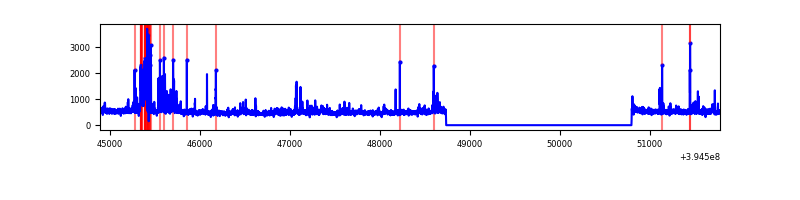 |
| C | 6892 | 4830 | 44 | 44 | 0.64% | 0.91% | 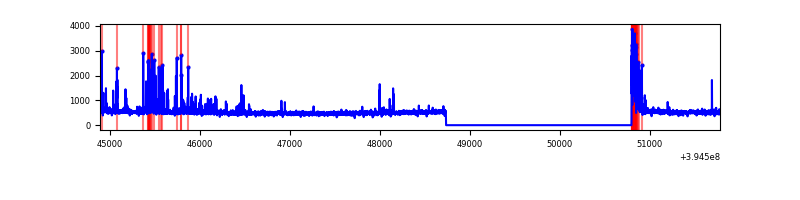 |
| D | 6892 | 4830 | 169 | 169 | 2.45% | 3.50% | 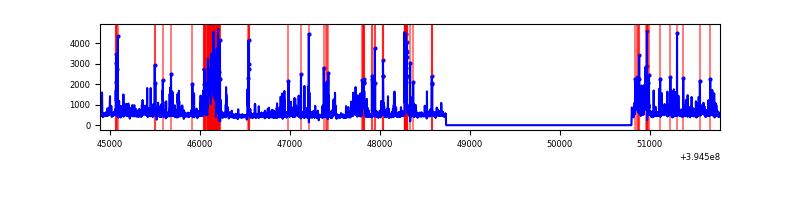 |
Top three noisy pixels from each quadrant. If the there are fewer than three noisy pixels in the level2.evt file, extra rows are filled as -1
| Pixel properties | Quadrant properties | ||||||
|---|---|---|---|---|---|---|---|
| Quadrant | DetID | PixID | Counts | Sigma | Mean | Median | Sigma |
| A | 10 | 83 | 152383 | 1314.86 | 577 | 566 | 115.5 |
| A | 15 | 223 | 25572 | 216.57 | 577 | 566 | 115.5 |
| A | 9 | 143 | 12987 | 107.58 | 577 | 566 | 115.5 |
| B | 5 | 255 | 244509 | 2273.13 | 566 | 553 | 107.3 |
| B | 0 | 229 | 62020 | 572.74 | 566 | 553 | 107.3 |
| B | 5 | 172 | 55903 | 515.74 | 566 | 553 | 107.3 |
| C | 0 | 10 | 213918 | 1642.64 | 560 | 566 | 129.9 |
| C | 15 | 214 | 202274 | 1552.99 | 560 | 566 | 129.9 |
| C | 14 | 254 | 115522 | 885.07 | 560 | 566 | 129.9 |
| D | 10 | 199 | 316253 | 2326.05 | 559 | 546 | 135.7 |
| D | 2 | 250 | 166324 | 1221.41 | 559 | 546 | 135.7 |
| D | 13 | 249 | 148330 | 1088.84 | 559 | 546 | 135.7 |
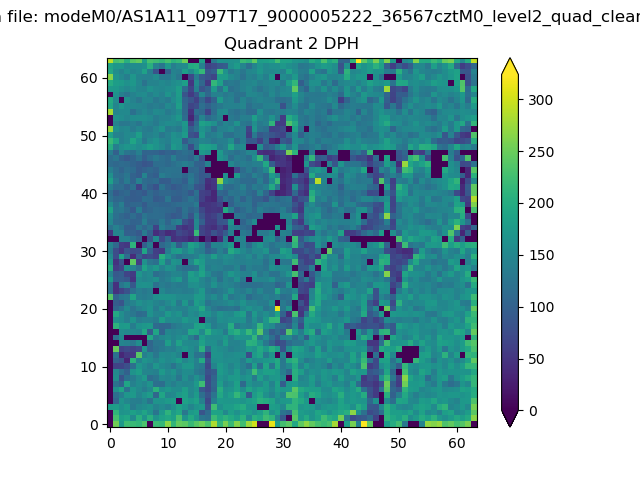
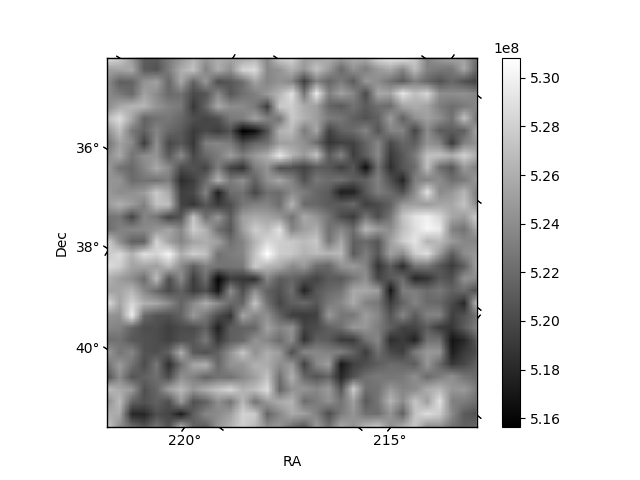
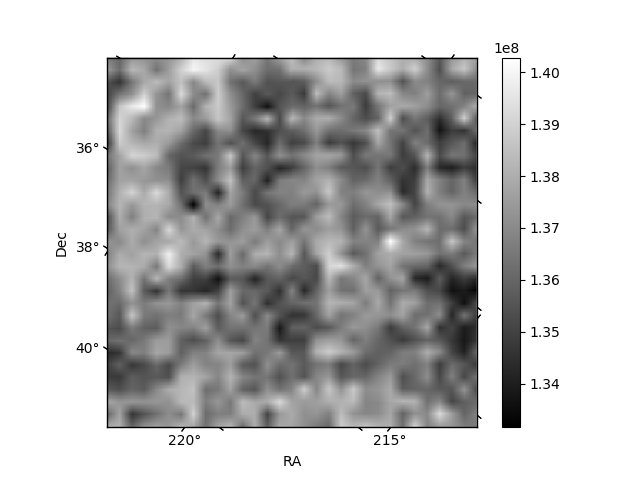
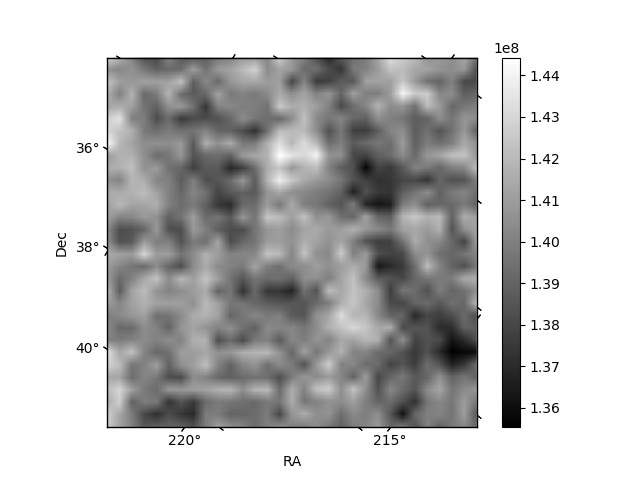
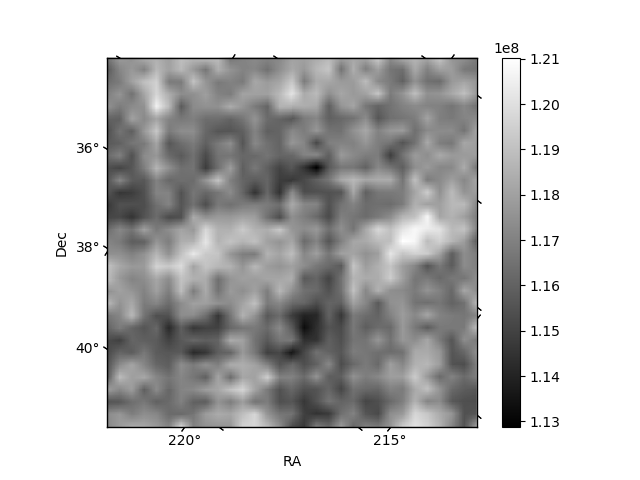
Histogram calculated using DETX and DETY for each event in the final _common_clean file
| Quadrant A | 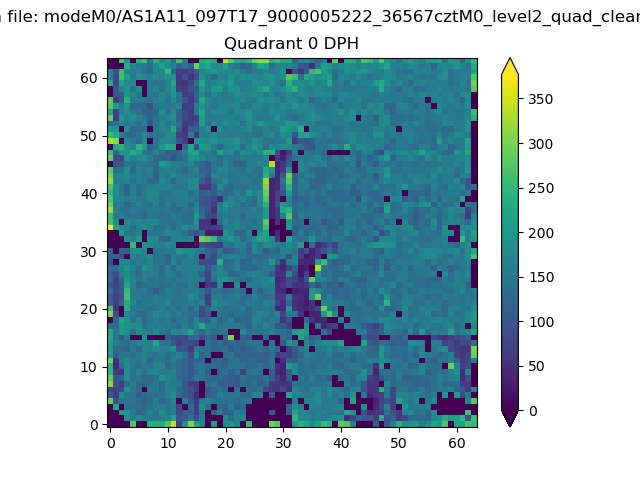 |
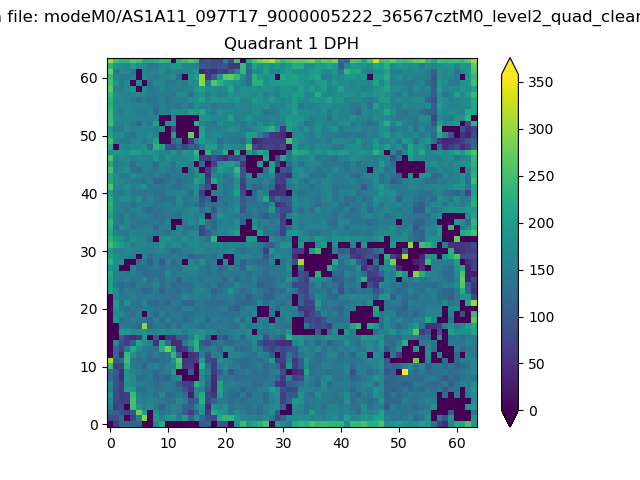 |
Quadrant B |
|---|---|---|---|
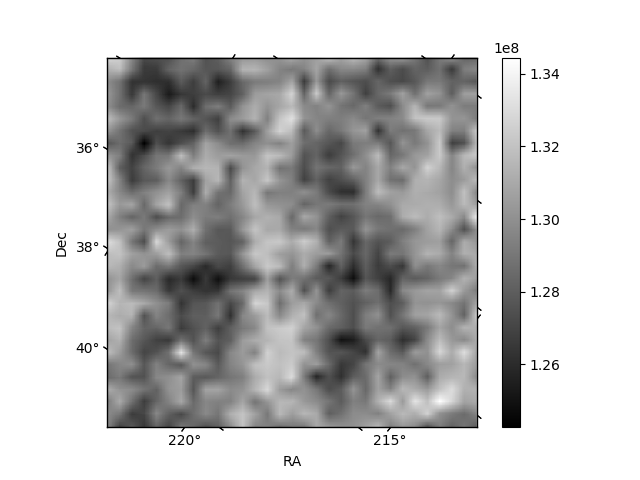
| Quadrant D | 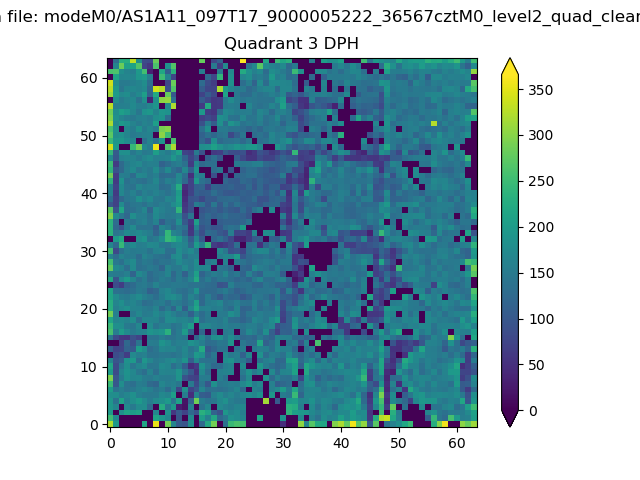 |
 |
Quadrant C |
| Plot type | Count rate plots | Images |
|---|---|---|
| Comparison with Poisson distribution Blue bars denote a histogram of data divided into 1 sec bins. Red curve is a Poisson curve with rate = median count rate of data. |
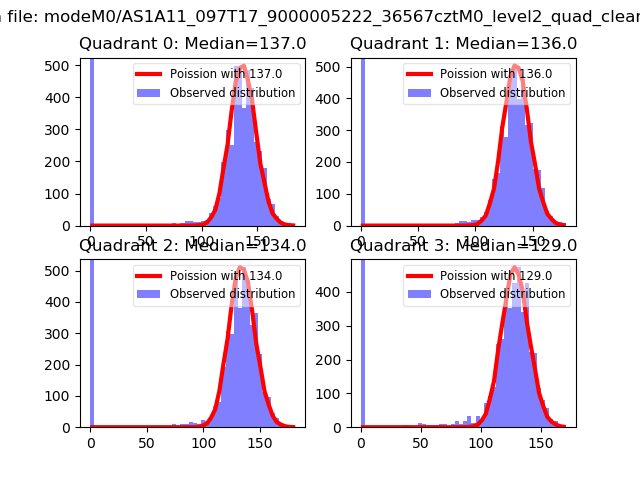 |
 |
| Quadrant-wise count rates Data is divided into 100 sec bins |
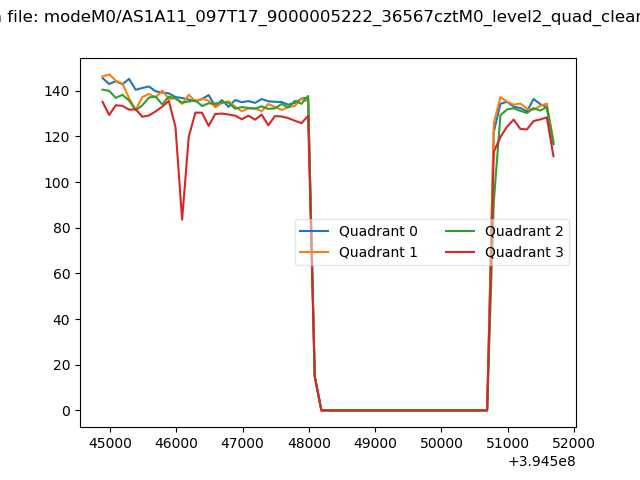 |
|
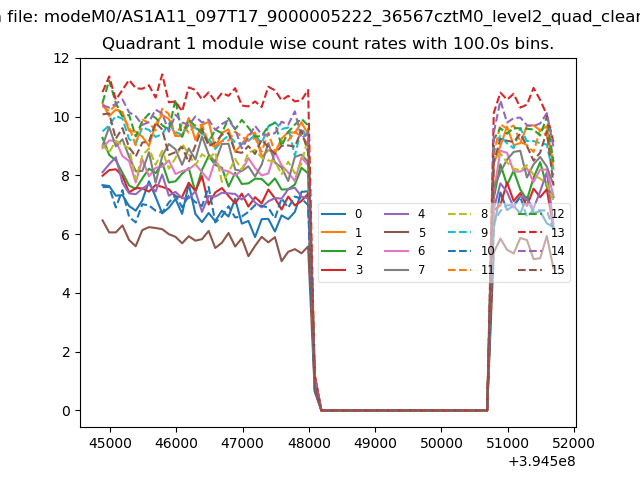
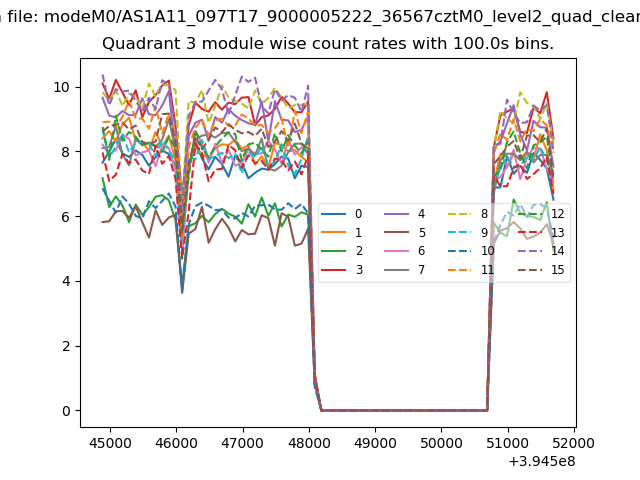
| Module-wise count rates for Quadrant A Data is divided into 100 sec bins |
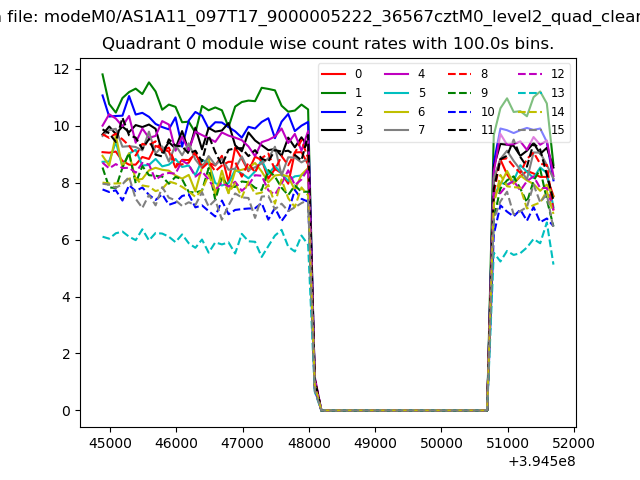 |
 |
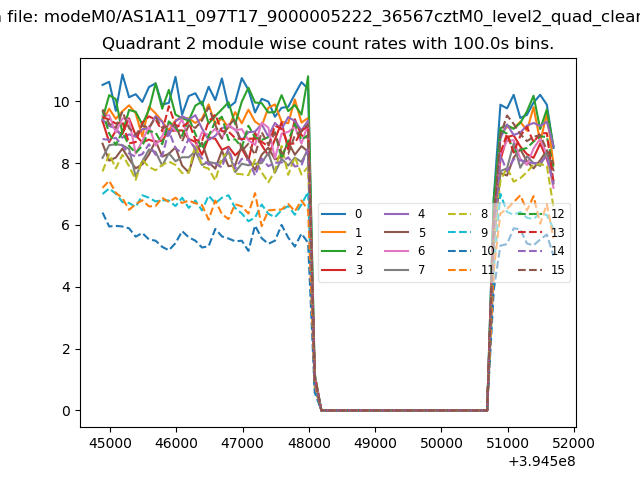
| Module-wise count rates for Quadrant B Data is divided into 100 sec bins |
 |
 |
| Module-wise count rates for Quadrant C Data is divided into 100 sec bins |
 |
 |
| Module-wise count rates for Quadrant D Data is divided into 100 sec bins |
 |
 |
| Parameter | Plot |
|---|---|
| CZT HV Monitor | 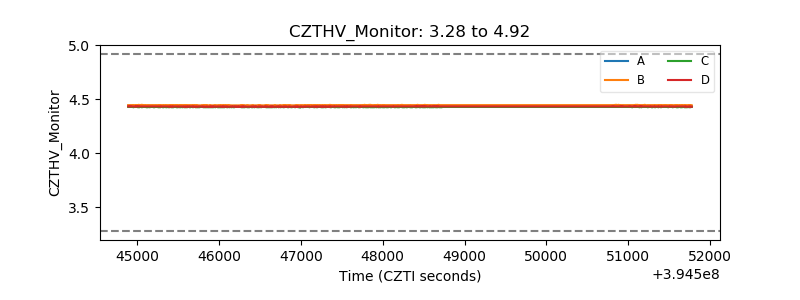 |
| D_VDD | 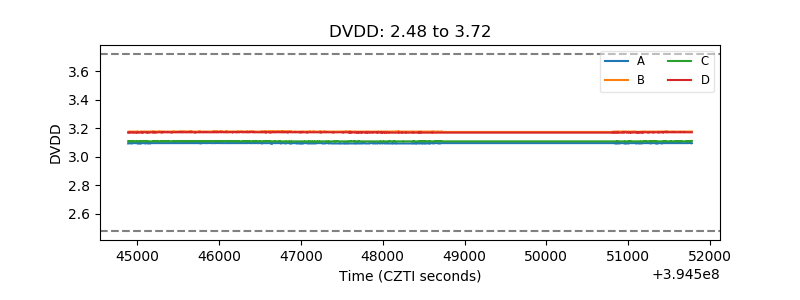 |
| Temperature 1 | 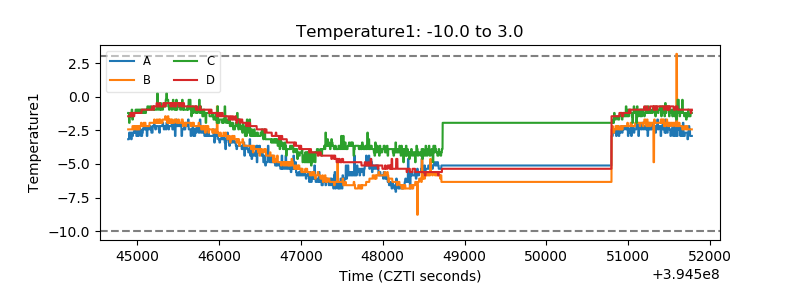 |
| Veto HV Monitor | 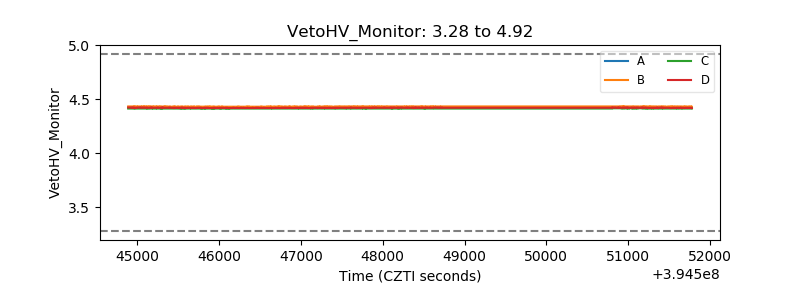 |
| Veto LLD | 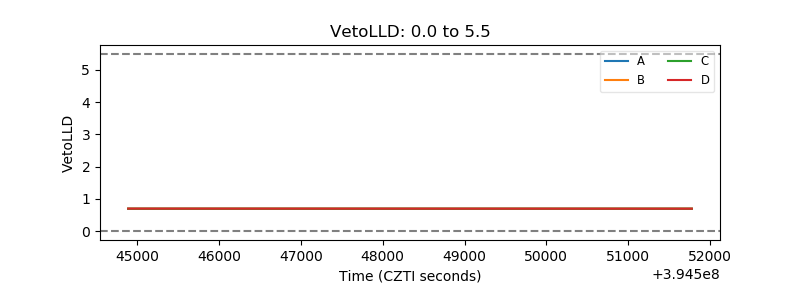 |
| Alpha Counter | 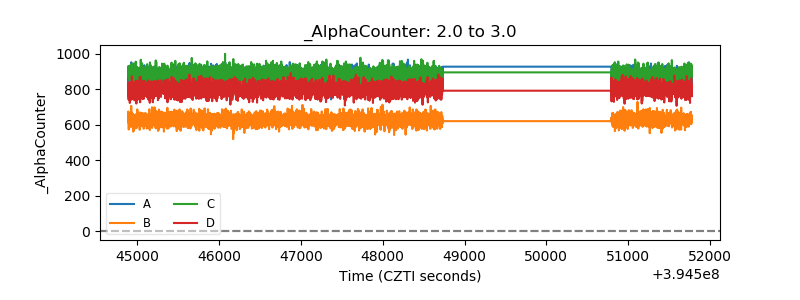 |
| _CPM_Rate | 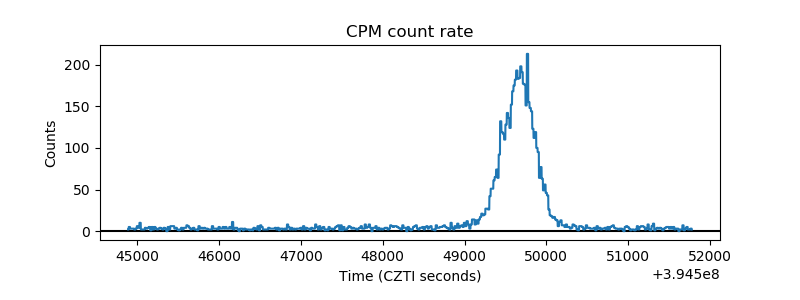 |
| CZT Counter | 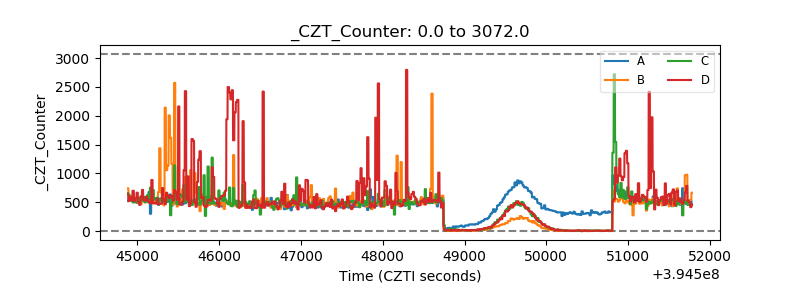 |
| +2.5 Volts monitor | 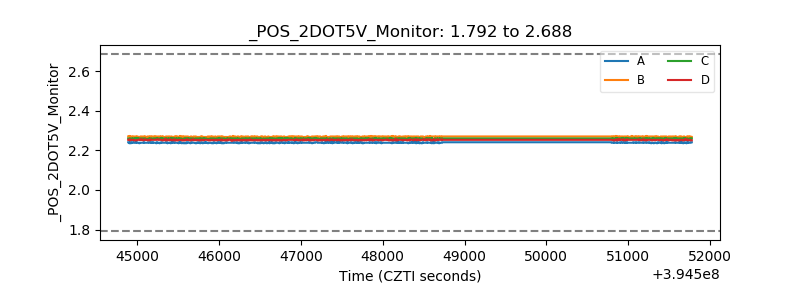 |
| +5 Volts monitor | 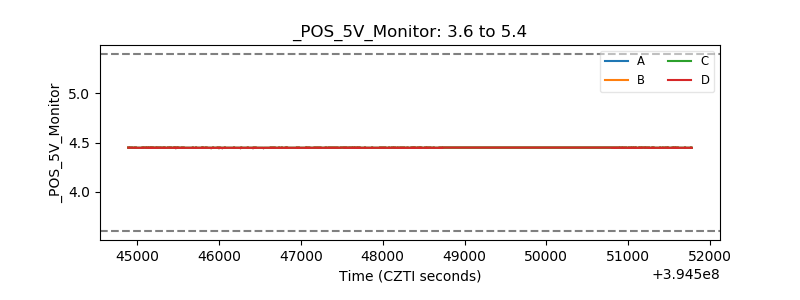 |
| _ROLL_ROT | 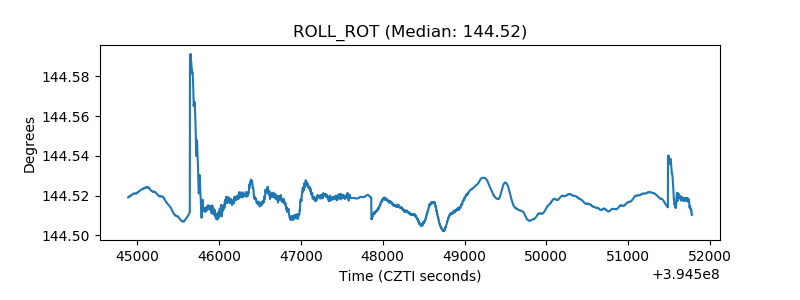 |
| _Roll_DEC |  |
| _Roll_RA | 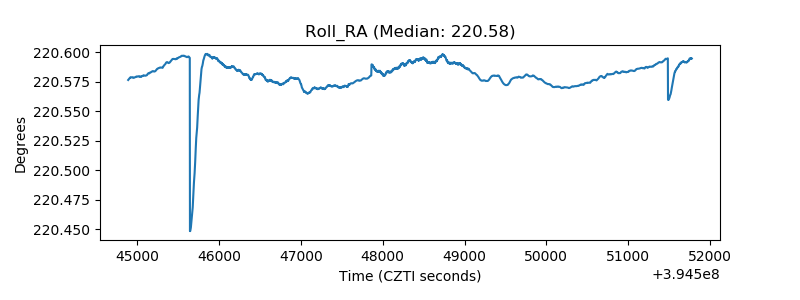 |
| Veto Counter | 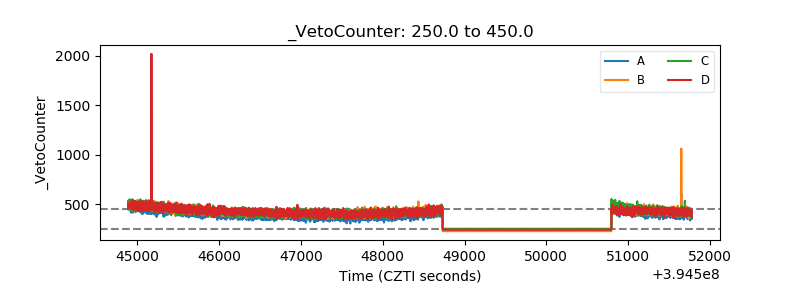 |