| Param | Original file | Final file |
|---|---|---|
| Filename | modeM0/AS1A11_097T17_9000005222_36569cztM0_level2.evt | modeM0/AS1A11_097T17_9000005222_36569cztM0_level2_quad_clean.evt |
| Size (bytes) | 444,323,520 | 69,252,480 |
| Size | 423.7 MB | 66.0 MB |
| Events in quadrant A | 2,799,721 | 437,293 |
| Events in quadrant B | 3,178,452 | 434,713 |
| Events in quadrant C | 3,202,874 | 424,535 |
| Events in quadrant D | 3,899,849 | 413,320 |
| Mode M0 | |||
|---|---|---|---|
| Quadrant | BADHDUFLAG | Total packets | Discarded packets |
| A | 0 | 11874 | 3 |
| B | 0 | 13109 | 2 |
| C | 0 | 12854 | 2 |
| D | 0 | 15288 | 2 |
| Mode M9 | |||
|---|---|---|---|
| Quadrant | BADHDUFLAG | Total packets | Discarded packets |
| A | 0 | 19 | 0 |
| B | 0 | 19 | 0 |
| C | 0 | 19 | 0 |
| D | 0 | 20 | 0 |
| Mode SS | |||
|---|---|---|---|
| Quadrant | BADHDUFLAG | Total packets | Discarded packets |
| A | 0 | 112 | 0 |
| B | 0 | 112 | 0 |
| C | 0 | 112 | 0 |
| D | 0 | 112 | 0 |
| Quadrant | Total seconds | Saturated seconds | Saturation percentage |
|---|---|---|---|
| A | 5531 | 22 | 0.397758% |
| B | 5531 | 27 | 0.488158% |
| C | 5531 | 187 | 3.380944% |
| D | 5531 | 187 | 3.380944% |
Noise dominated data is calculated using 1-second bins in cleaned event files. If a bin has >2000 counts, and if more than 50% of those come from <1% of pixels, then it is considered to be noise-dominated and hence unusable.
| Quadrant | # 1 sec bins | Bins with >0 counts | Bins with >2000 counts | High rate bins dominated by noise | Noise dominated (total time) | Noise dominated (detector-on time) | Marked lightcurve |
|---|---|---|---|---|---|---|---|
| A | 7025 | 5532 | 11 | 11 | 0.16% | 0.20% | 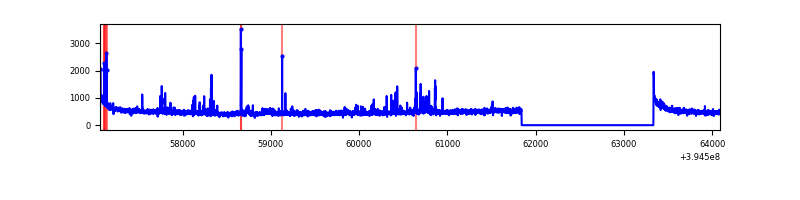 |
| B | 7025 | 5532 | 5 | 5 | 0.07% | 0.09% | 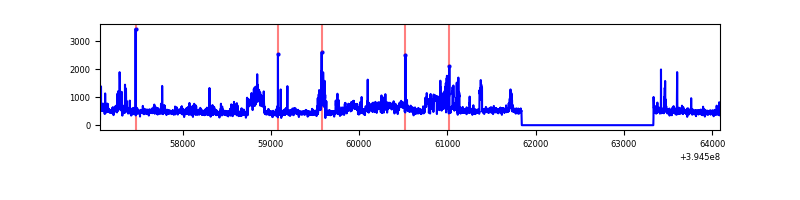 |
| C | 7025 | 5532 | 134 | 134 | 1.91% | 2.42% | 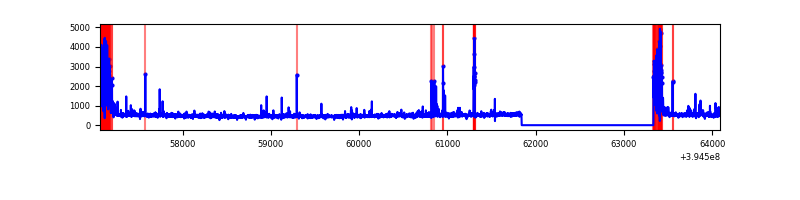 |
| D | 7025 | 5532 | 178 | 178 | 2.53% | 3.22% | 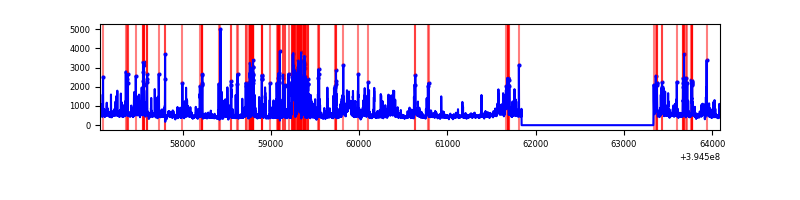 |
Top three noisy pixels from each quadrant. If the there are fewer than three noisy pixels in the level2.evt file, extra rows are filled as -1
| Pixel properties | Quadrant properties | ||||||
|---|---|---|---|---|---|---|---|
| Quadrant | DetID | PixID | Counts | Sigma | Mean | Median | Sigma |
| A | 10 | 83 | 215912 | 1695.08 | 628 | 615 | 127.0 |
| A | 15 | 223 | 121870 | 954.66 | 628 | 615 | 127.0 |
| A | 9 | 143 | 28697 | 221.1 | 628 | 615 | 127.0 |
| B | 5 | 172 | 499638 | 4179.03 | 622 | 606 | 119.4 |
| B | 5 | 255 | 56745 | 470.12 | 622 | 606 | 119.4 |
| B | 0 | 229 | 51091 | 422.77 | 622 | 606 | 119.4 |
| C | 0 | 10 | 506072 | 3576.58 | 605 | 612 | 141.3 |
| C | 15 | 214 | 235019 | 1658.64 | 605 | 612 | 141.3 |
| C | 14 | 254 | 78518 | 551.25 | 605 | 612 | 141.3 |
| D | 12 | 16 | 614581 | 4139.95 | 612 | 596 | 148.3 |
| D | 12 | 6 | 210962 | 1418.45 | 612 | 596 | 148.3 |
| D | 12 | 17 | 159636 | 1072.37 | 612 | 596 | 148.3 |
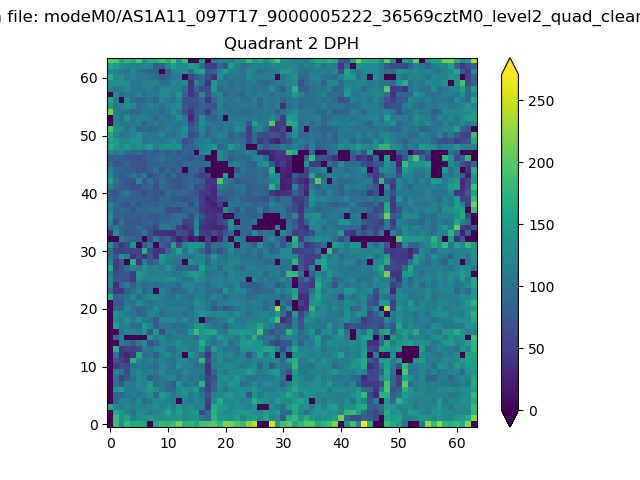
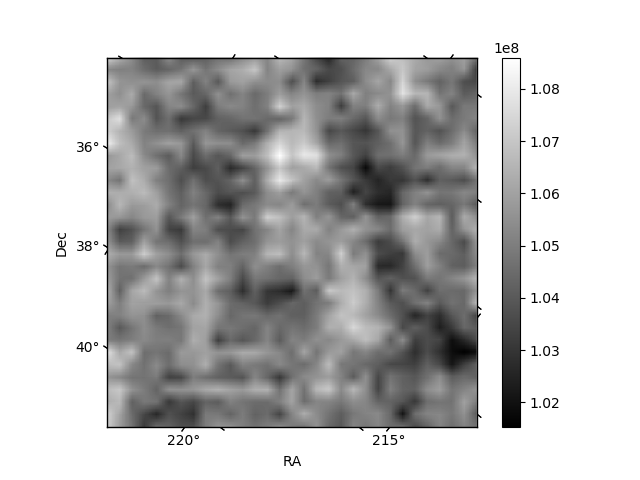
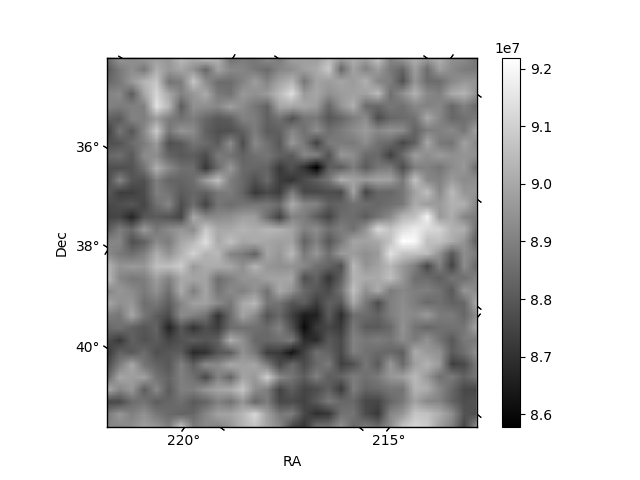
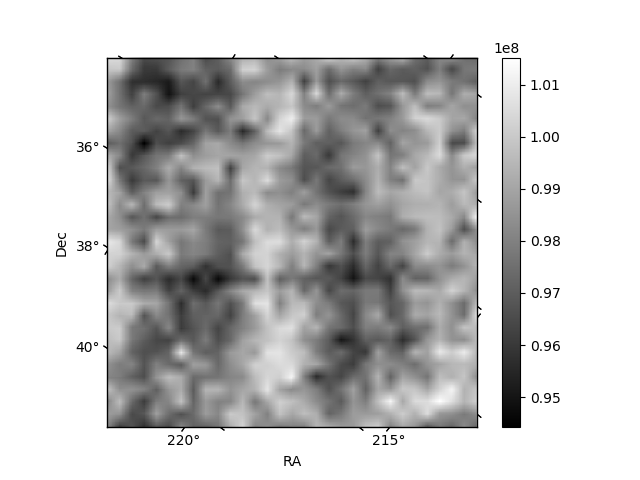
Histogram calculated using DETX and DETY for each event in the final _common_clean file
| Quadrant A | 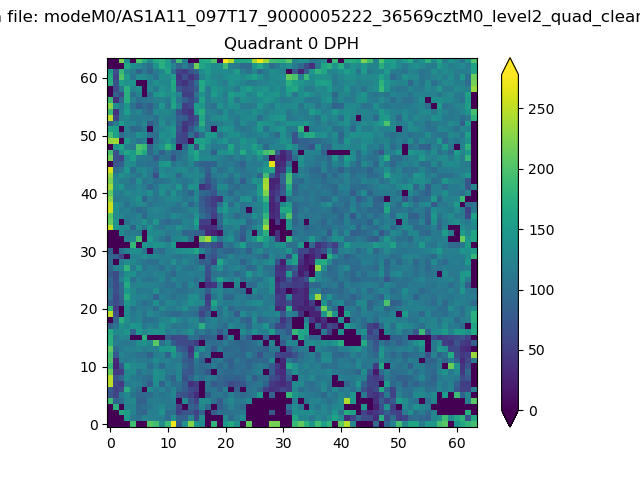 |
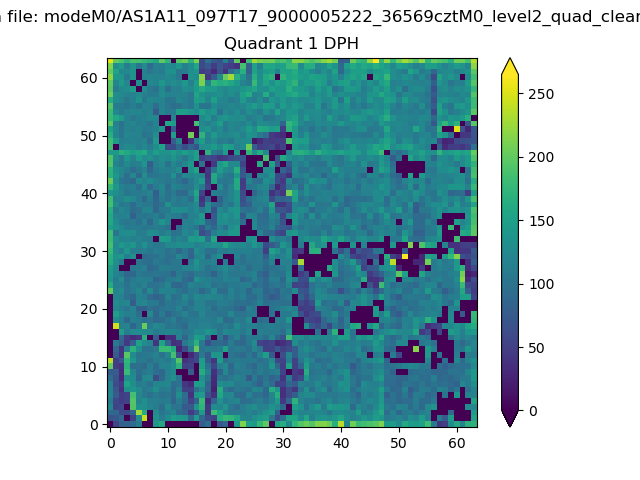 |
Quadrant B |
|---|---|---|---|
| Quadrant D | 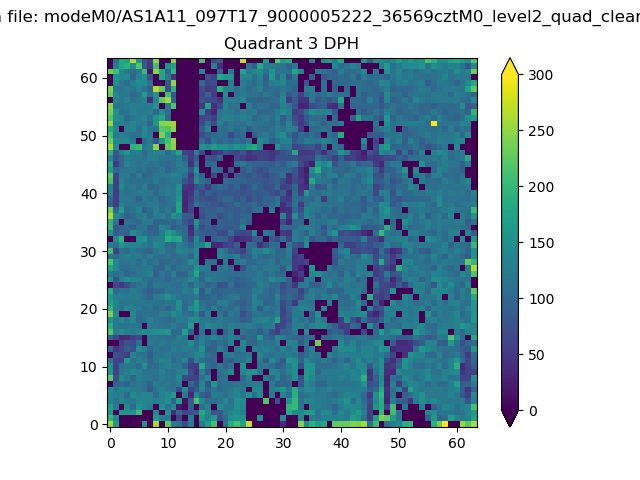 |
 |
Quadrant C |
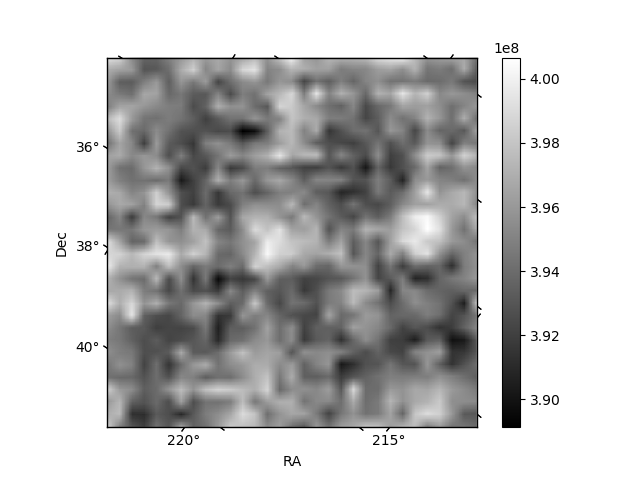
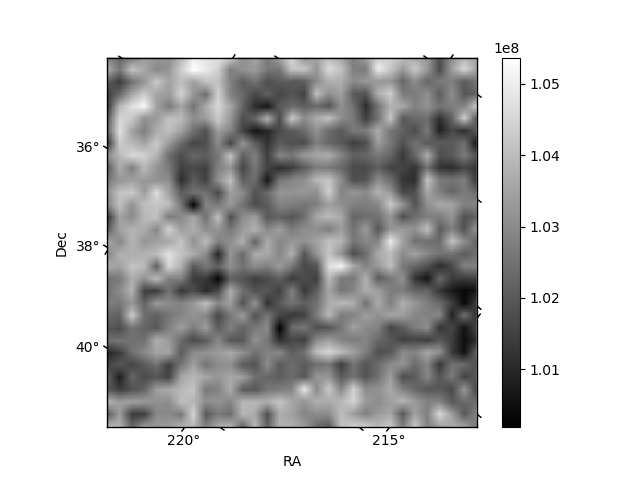
| Plot type | Count rate plots | Images |
|---|---|---|
| Comparison with Poisson distribution Blue bars denote a histogram of data divided into 1 sec bins. Red curve is a Poisson curve with rate = median count rate of data. |
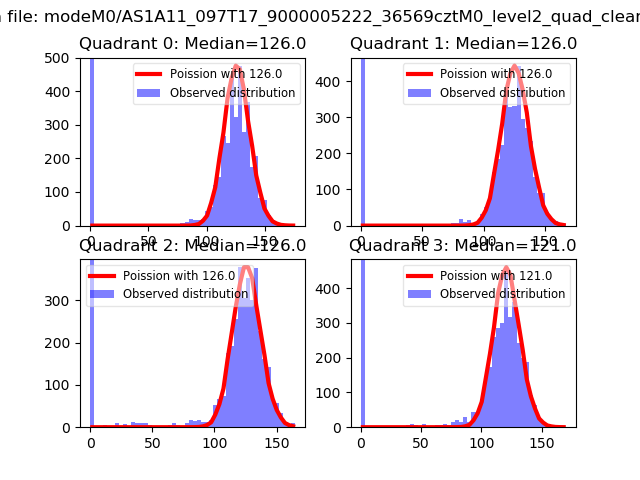 |
 |
| Quadrant-wise count rates Data is divided into 100 sec bins |
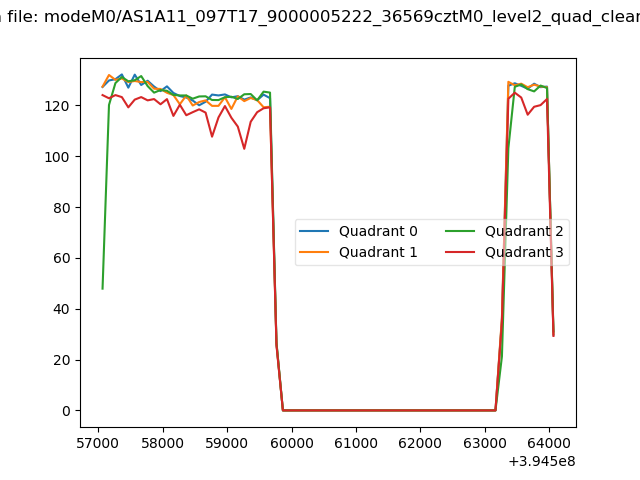 |
|
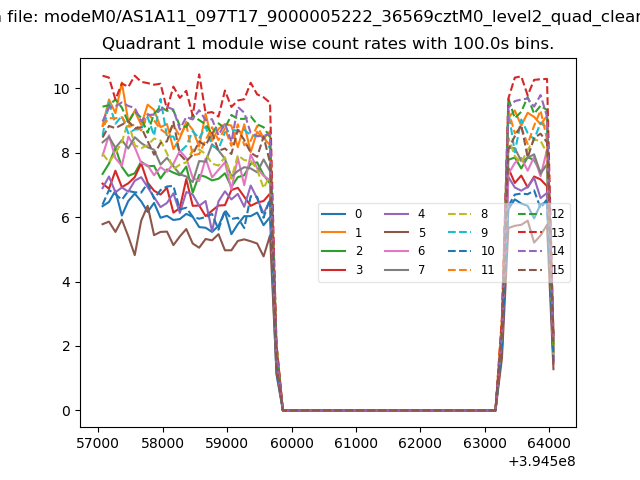
| Module-wise count rates for Quadrant A Data is divided into 100 sec bins |
 |
 |
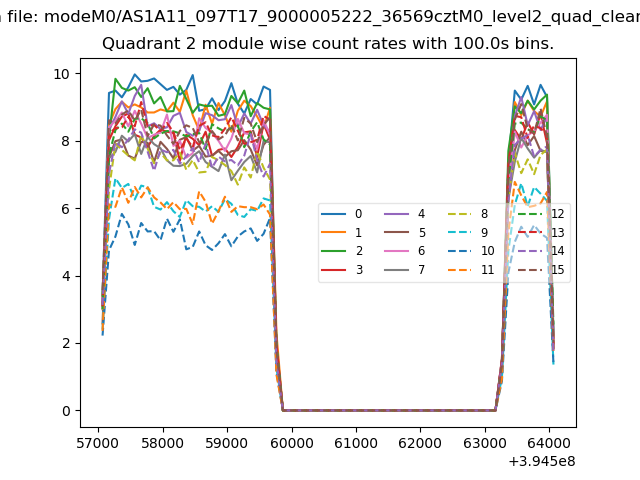
| Module-wise count rates for Quadrant B Data is divided into 100 sec bins |
 |
 |
| Module-wise count rates for Quadrant C Data is divided into 100 sec bins |
 |
 |
| Module-wise count rates for Quadrant D Data is divided into 100 sec bins |
 |
 |
| Parameter | Plot |
|---|---|
| CZT HV Monitor | 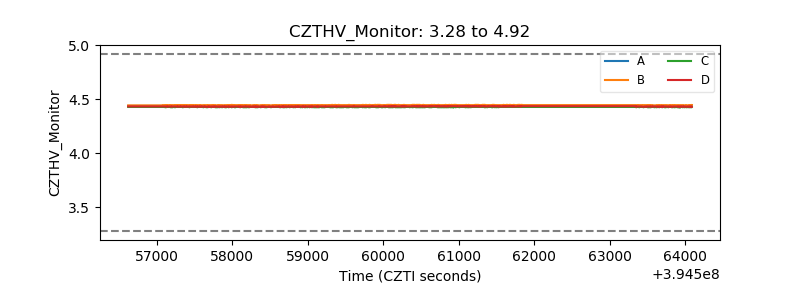 |
| D_VDD | 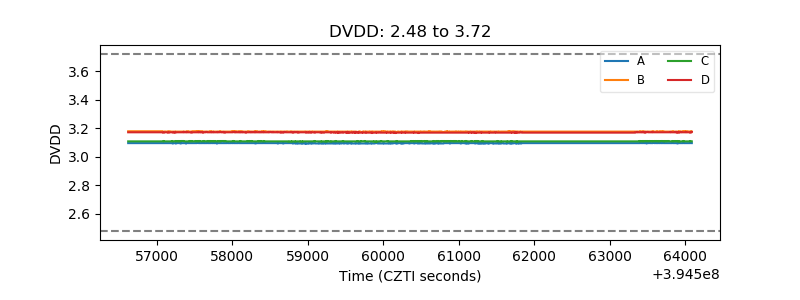 |
| Temperature 1 | 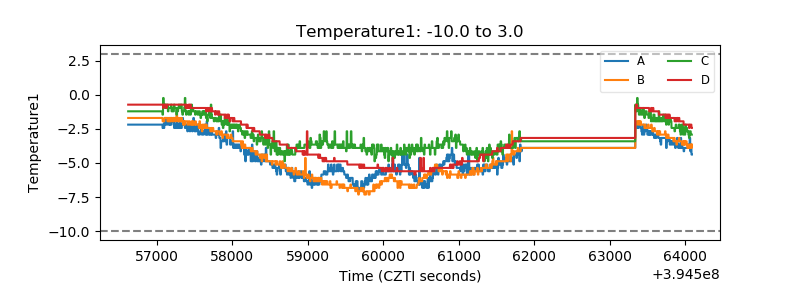 |
| Veto HV Monitor |  |
| Veto LLD | 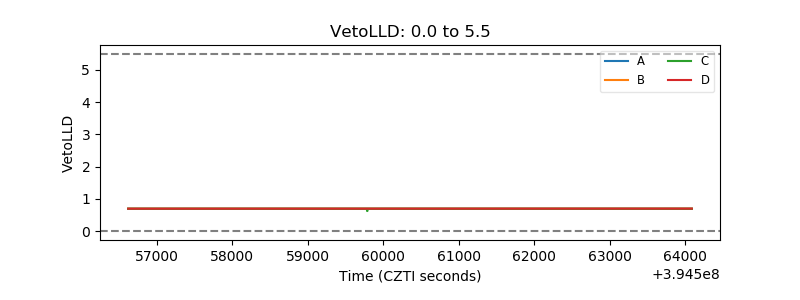 |
| Alpha Counter | 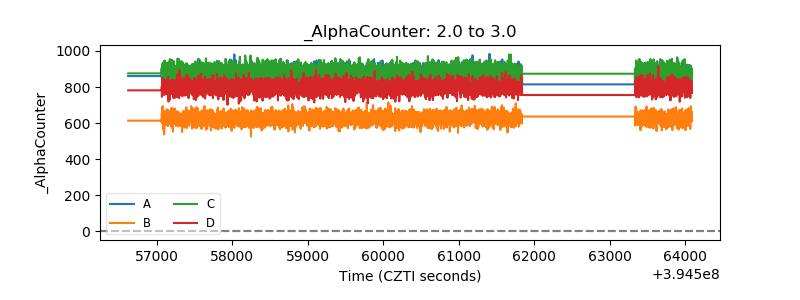 |
| _CPM_Rate | 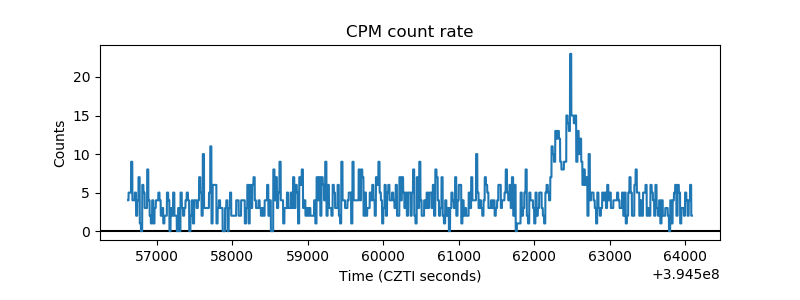 |
| CZT Counter | 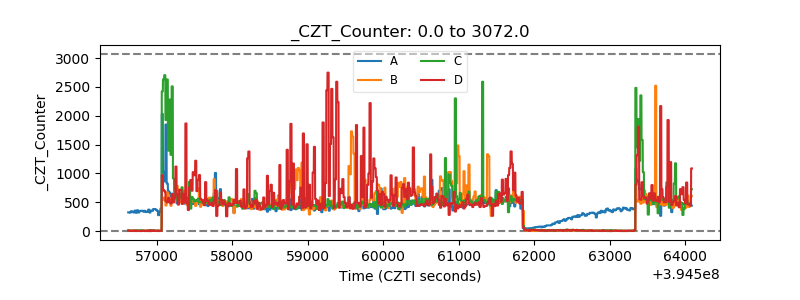 |
| +2.5 Volts monitor |  |
| +5 Volts monitor | 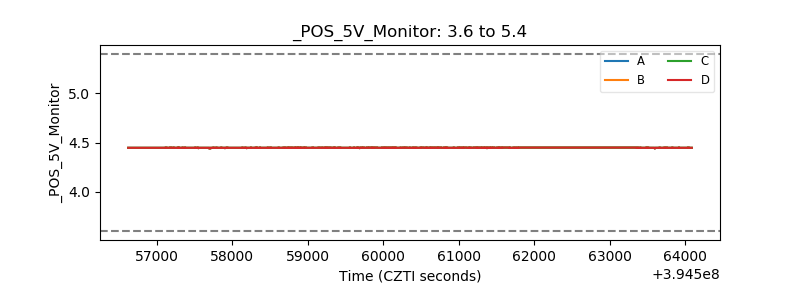 |
| _ROLL_ROT | 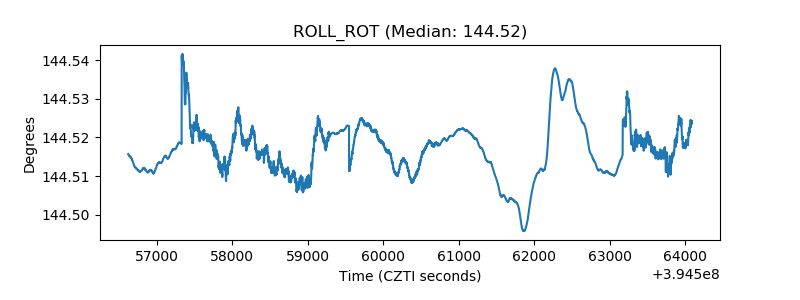 |
| _Roll_DEC | 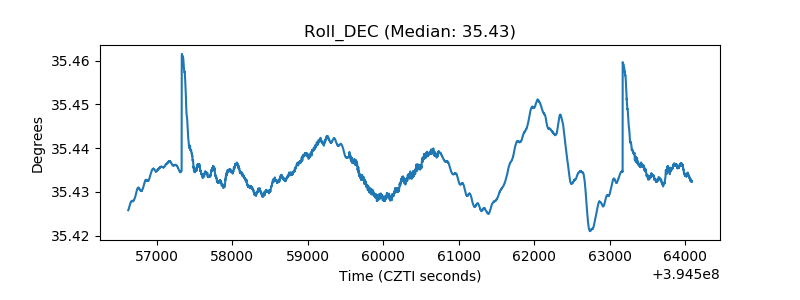 |
| _Roll_RA | 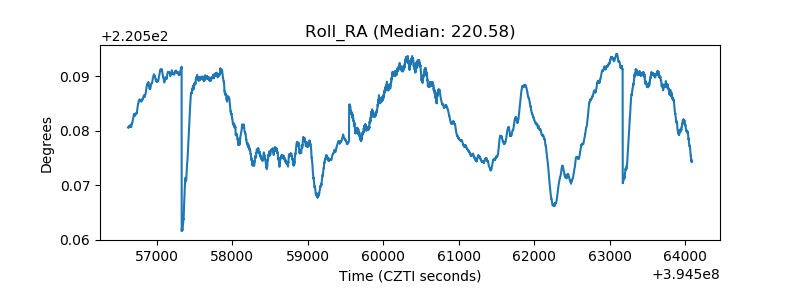 |
| Veto Counter | 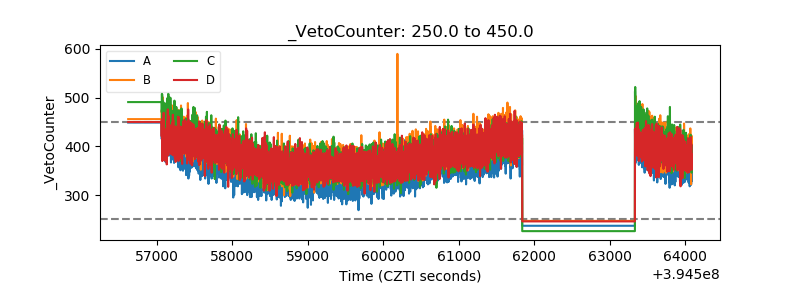 |