| Param | Original file | Final file |
|---|---|---|
| Filename | modeM0/AS1A11_097T17_9000005222_36570cztM0_level2.evt | modeM0/AS1A11_097T17_9000005222_36570cztM0_level2_quad_clean.evt |
| Size (bytes) | 485,533,440 | 72,054,720 |
| Size | 463.0 MB | 68.7 MB |
| Events in quadrant A | 2,992,607 | 452,941 |
| Events in quadrant B | 3,345,923 | 451,561 |
| Events in quadrant C | 3,316,965 | 446,193 |
| Events in quadrant D | 4,654,994 | 424,909 |
| Mode M0 | |||
|---|---|---|---|
| Quadrant | BADHDUFLAG | Total packets | Discarded packets |
| A | 0 | 12634 | 3 |
| B | 0 | 13774 | 2 |
| C | 0 | 13395 | 2 |
| D | 0 | 17882 | 2 |
| Mode M9 | |||
|---|---|---|---|
| Quadrant | BADHDUFLAG | Total packets | Discarded packets |
| A | 0 | 20 | 0 |
| B | 0 | 20 | 0 |
| C | 0 | 20 | 0 |
| D | 0 | 21 | 0 |
| Mode SS | |||
|---|---|---|---|
| Quadrant | BADHDUFLAG | Total packets | Discarded packets |
| A | 0 | 118 | 0 |
| B | 0 | 118 | 0 |
| C | 0 | 118 | 0 |
| D | 0 | 118 | 0 |
| Quadrant | Total seconds | Saturated seconds | Saturation percentage |
|---|---|---|---|
| A | 5811 | 53 | 0.912063% |
| B | 5811 | 63 | 1.084151% |
| C | 5811 | 118 | 2.030632% |
| D | 5811 | 275 | 4.732404% |
Noise dominated data is calculated using 1-second bins in cleaned event files. If a bin has >2000 counts, and if more than 50% of those come from <1% of pixels, then it is considered to be noise-dominated and hence unusable.
| Quadrant | # 1 sec bins | Bins with >0 counts | Bins with >2000 counts | High rate bins dominated by noise | Noise dominated (total time) | Noise dominated (detector-on time) | Marked lightcurve |
|---|---|---|---|---|---|---|---|
| A | 7124 | 5812 | 40 | 40 | 0.56% | 0.69% | 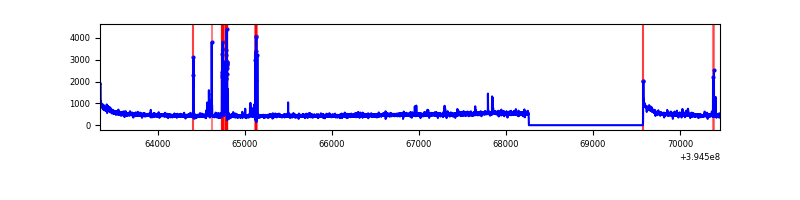 |
| B | 7124 | 5812 | 19 | 19 | 0.27% | 0.33% | 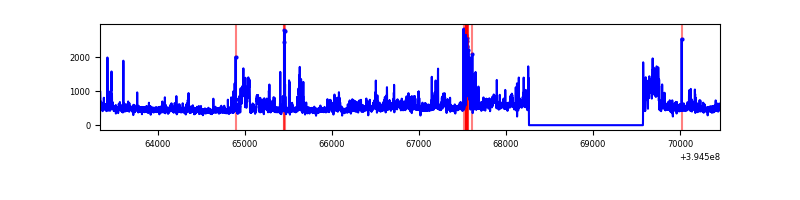 |
| C | 7124 | 5812 | 77 | 77 | 1.08% | 1.32% | 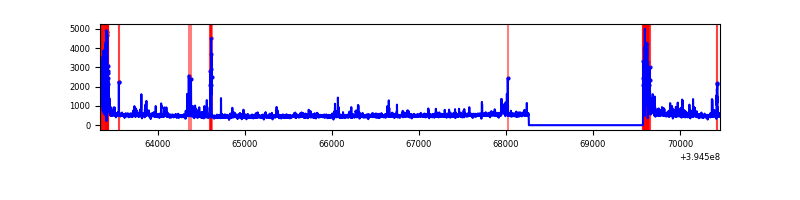 |
| D | 7124 | 5812 | 248 | 248 | 3.48% | 4.27% | 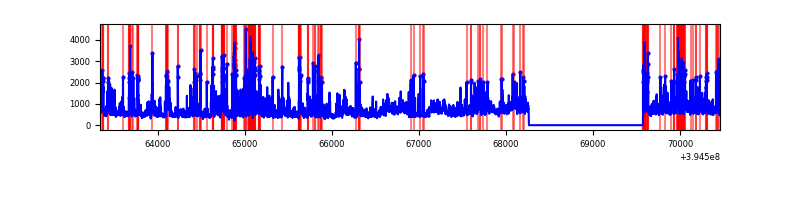 |
Top three noisy pixels from each quadrant. If the there are fewer than three noisy pixels in the level2.evt file, extra rows are filled as -1
| Pixel properties | Quadrant properties | ||||||
|---|---|---|---|---|---|---|---|
| Quadrant | DetID | PixID | Counts | Sigma | Mean | Median | Sigma |
| A | 15 | 223 | 230273 | 1715.73 | 656 | 642 | 133.8 |
| A | 10 | 83 | 220207 | 1640.52 | 656 | 642 | 133.8 |
| A | 13 | 254 | 7584 | 51.87 | 656 | 642 | 133.8 |
| B | 5 | 172 | 210795 | 1678.09 | 649 | 630 | 125.2 |
| B | 4 | 232 | 174143 | 1385.44 | 649 | 630 | 125.2 |
| B | 0 | 189 | 164907 | 1311.69 | 649 | 630 | 125.2 |
| C | 0 | 10 | 420735 | 2822.93 | 639 | 644 | 148.8 |
| C | 15 | 214 | 246530 | 1652.31 | 639 | 644 | 148.8 |
| C | 14 | 254 | 77885 | 519.05 | 639 | 644 | 148.8 |
| D | 12 | 16 | 750474 | 4864.37 | 633 | 616 | 154.2 |
| D | 1 | 20 | 347706 | 2251.59 | 633 | 616 | 154.2 |
| D | 2 | 250 | 303859 | 1967.16 | 633 | 616 | 154.2 |
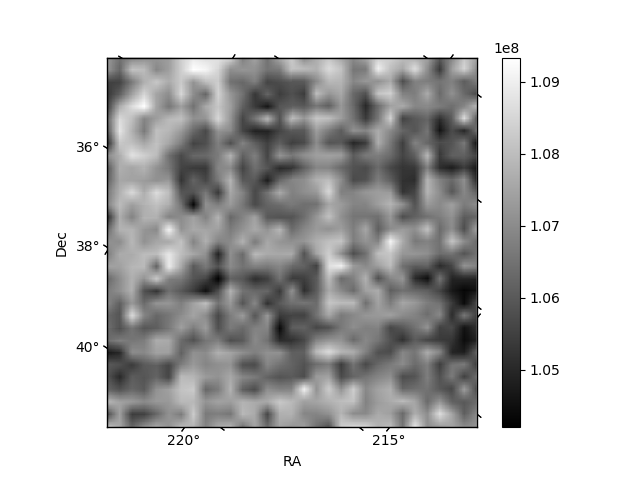
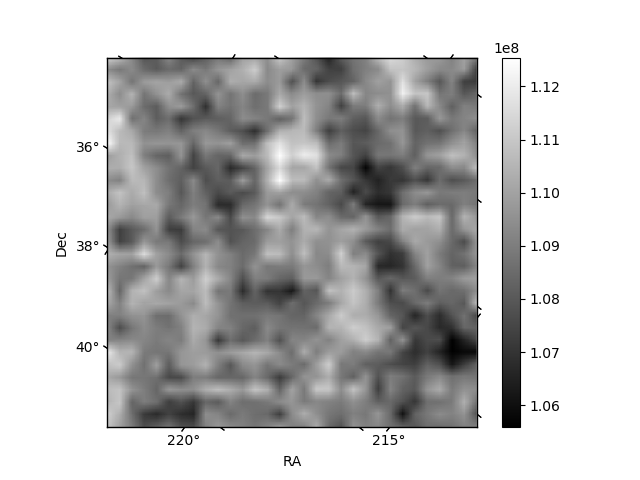
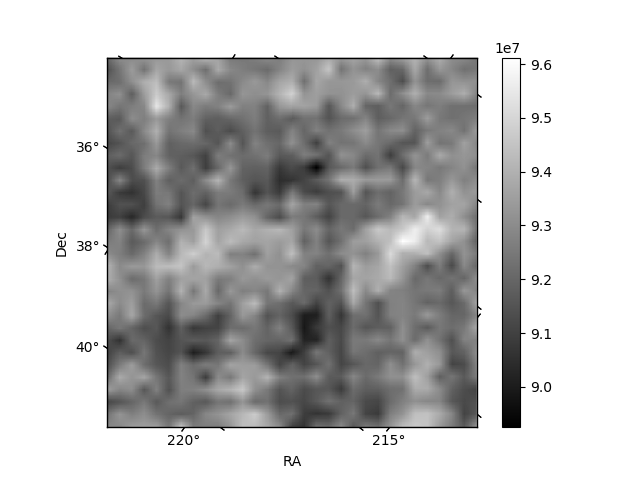
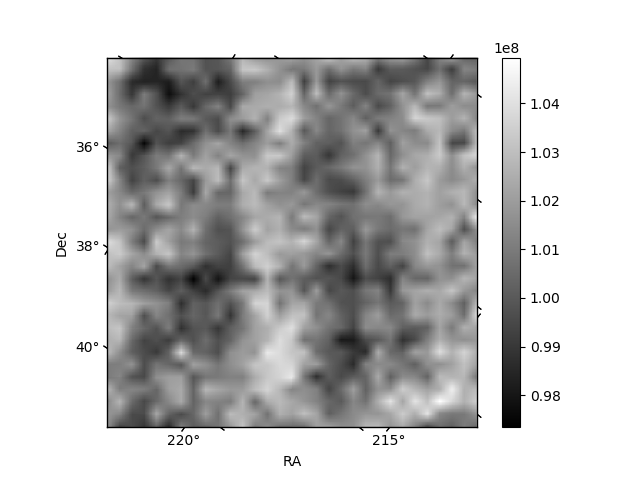
Histogram calculated using DETX and DETY for each event in the final _common_clean file
| Quadrant A | 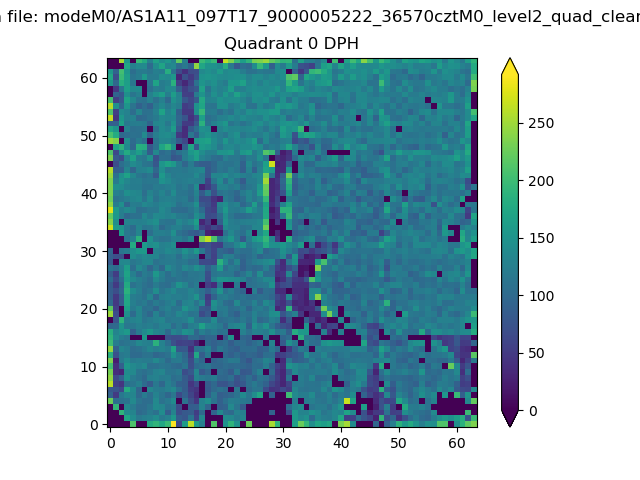 |
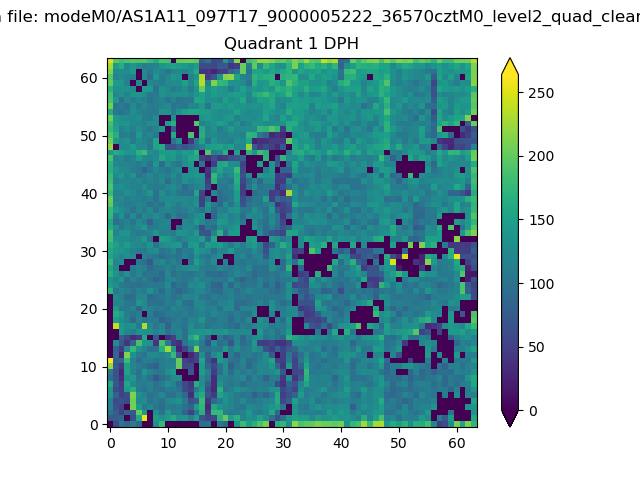 |
Quadrant B |
|---|---|---|---|
| Quadrant D | 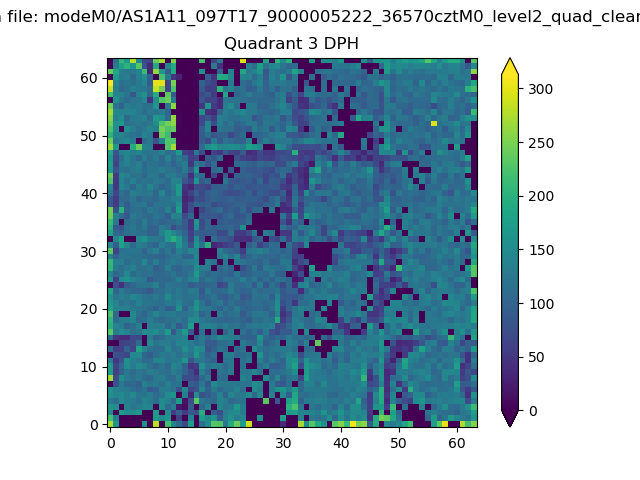 |
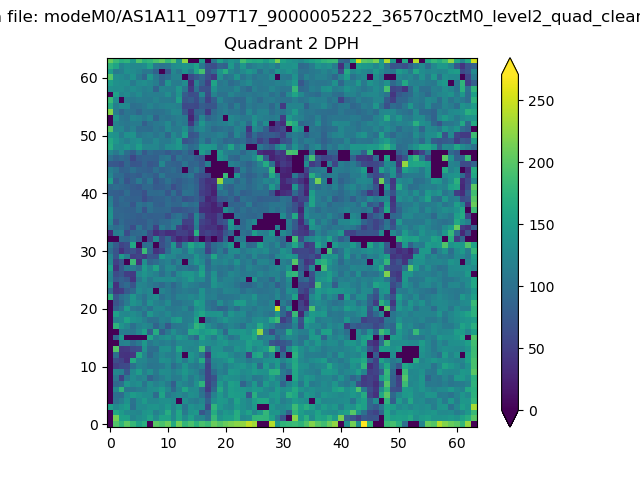 |
Quadrant C |
| Plot type | Count rate plots | Images |
|---|---|---|
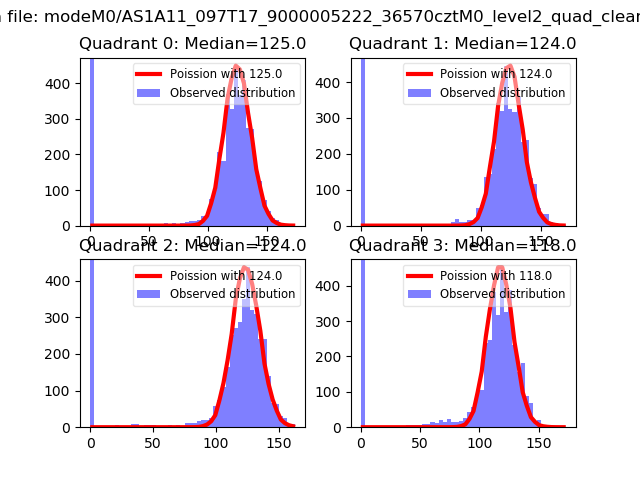
| Comparison with Poisson distribution Blue bars denote a histogram of data divided into 1 sec bins. Red curve is a Poisson curve with rate = median count rate of data. |
 |
 |
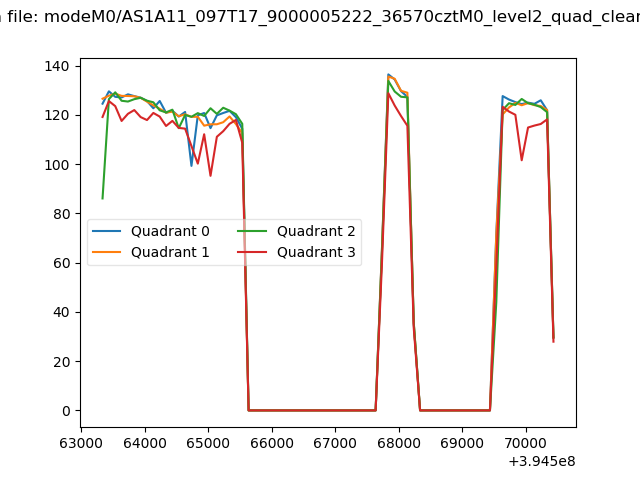
| Quadrant-wise count rates Data is divided into 100 sec bins |
 |
|
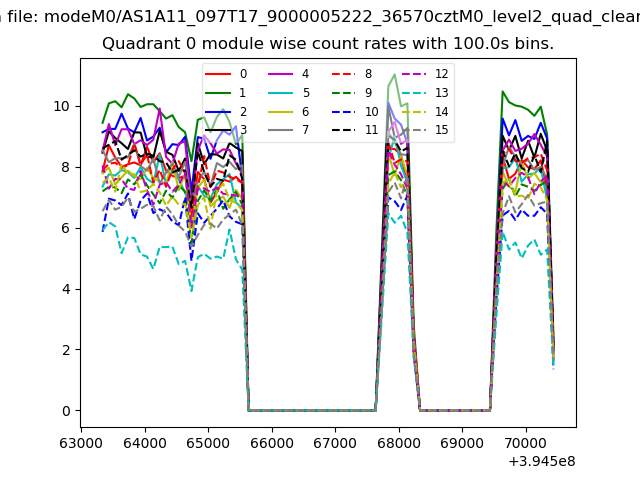
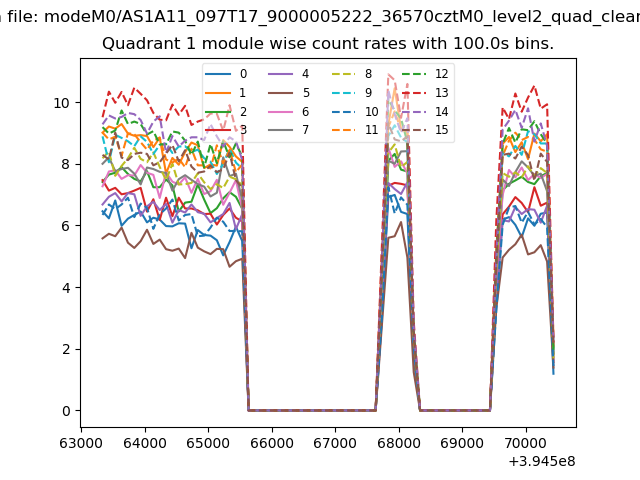
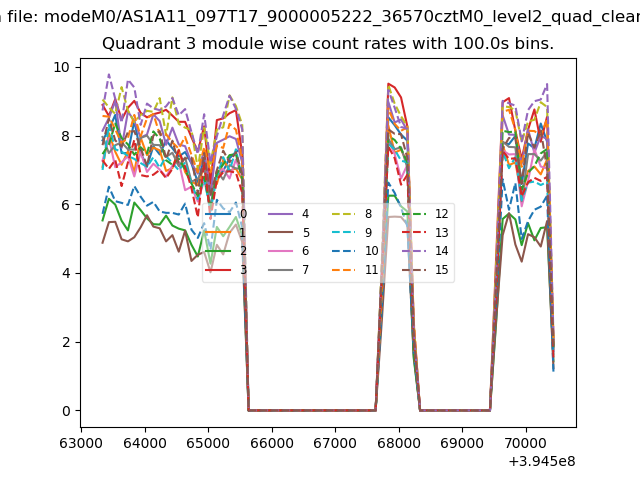
| Module-wise count rates for Quadrant A Data is divided into 100 sec bins |
 |
 |
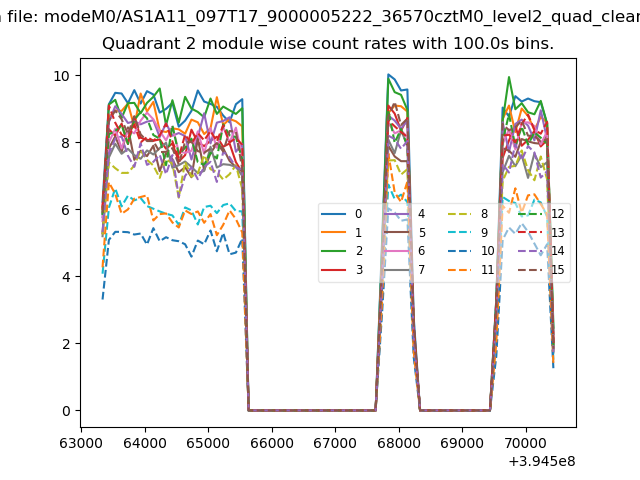
| Module-wise count rates for Quadrant B Data is divided into 100 sec bins |
 |
 |
| Module-wise count rates for Quadrant C Data is divided into 100 sec bins |
 |
 |
| Module-wise count rates for Quadrant D Data is divided into 100 sec bins |
 |
 |
| Parameter | Plot |
|---|---|
| CZT HV Monitor |  |
| D_VDD | 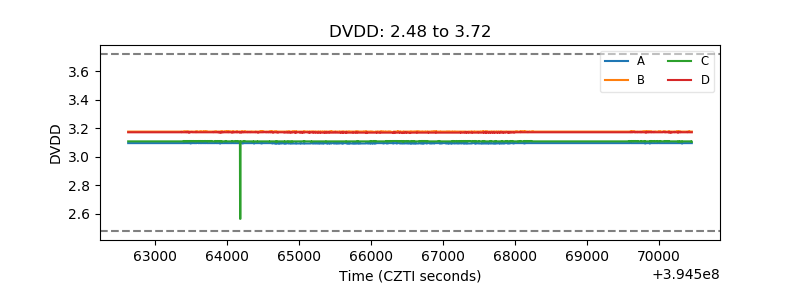 |
| Temperature 1 | 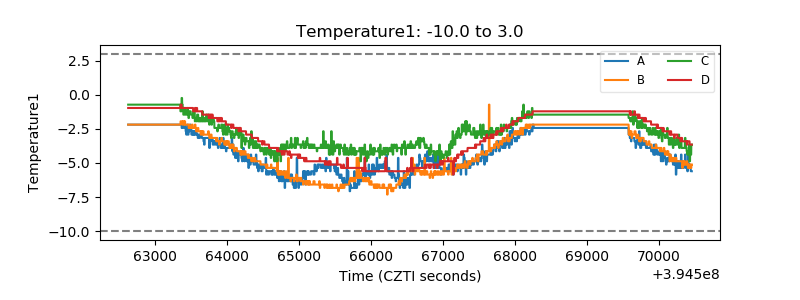 |
| Veto HV Monitor | 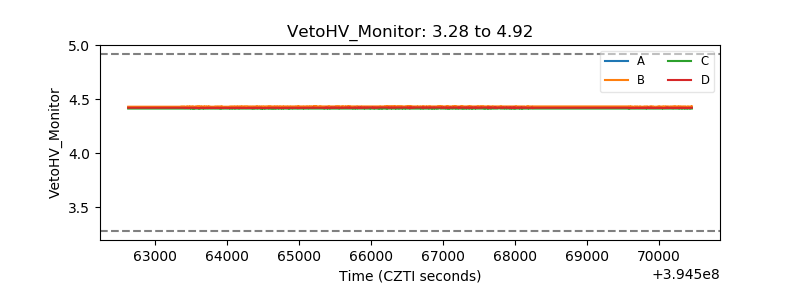 |
| Veto LLD | 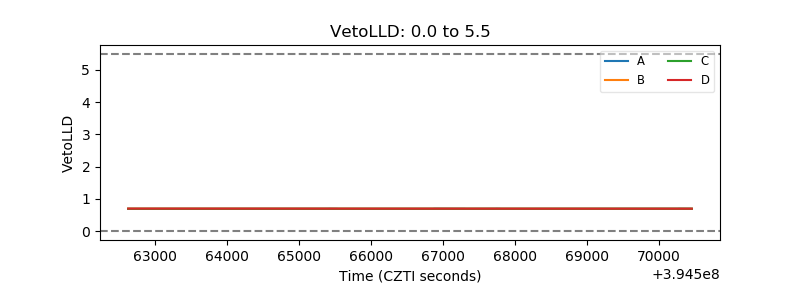 |
| Alpha Counter | 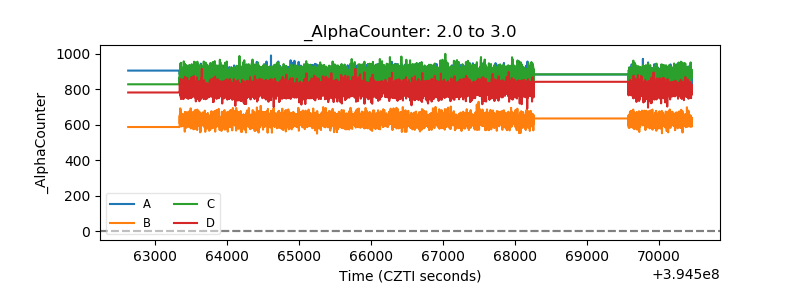 |
| _CPM_Rate | 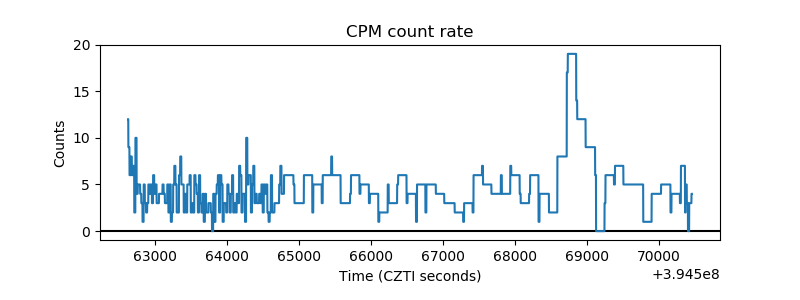 |
| CZT Counter | 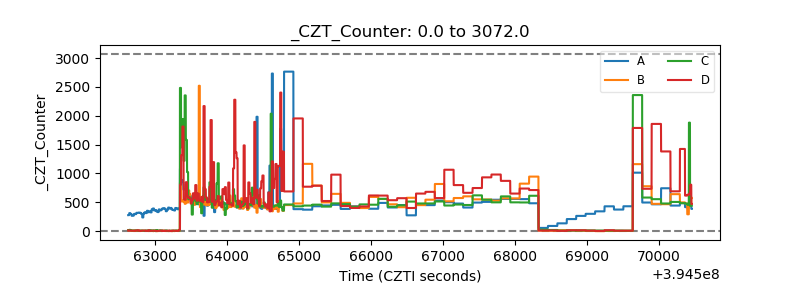 |
| +2.5 Volts monitor | 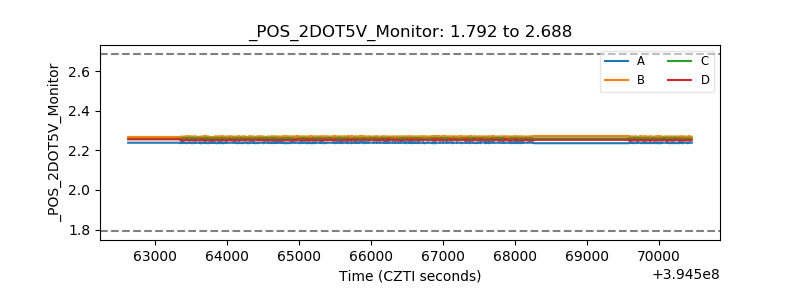 |
| +5 Volts monitor | 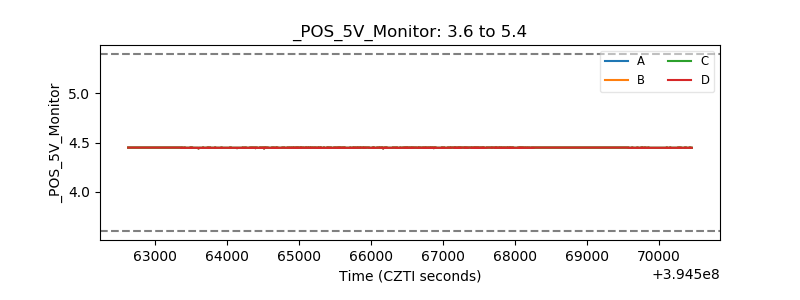 |
| _ROLL_ROT | 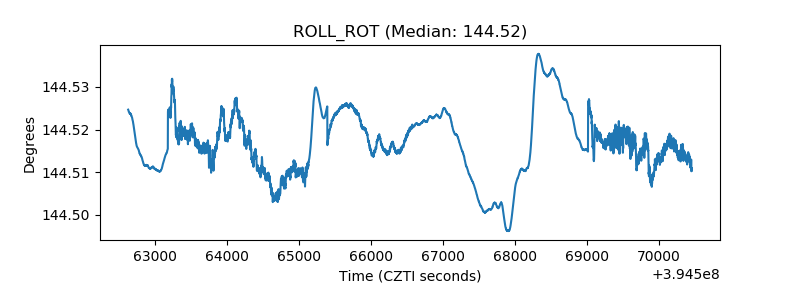 |
| _Roll_DEC |  |
| _Roll_RA | 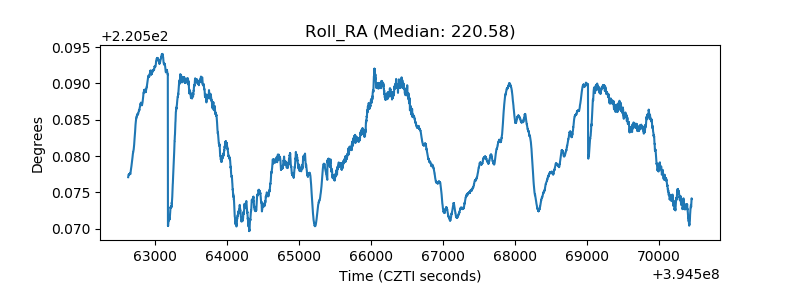 |
| Veto Counter | 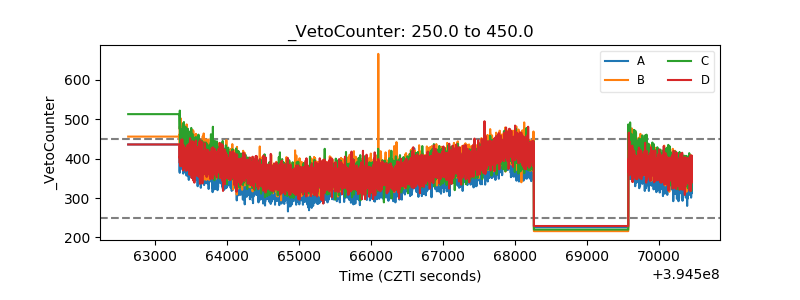 |