| Param | Original file | Final file |
|---|---|---|
| Filename | modeM0/AS1A11_097T17_9000005222_36571cztM0_level2.evt | modeM0/AS1A11_097T17_9000005222_36571cztM0_level2_quad_clean.evt |
| Size (bytes) | 552,395,520 | 75,876,480 |
| Size | 526.8 MB | 72.4 MB |
| Events in quadrant A | 2,920,649 | 488,306 |
| Events in quadrant B | 3,503,119 | 482,617 |
| Events in quadrant C | 3,686,469 | 473,411 |
| Events in quadrant D | 6,208,319 | 429,281 |
| Mode M0 | |||
|---|---|---|---|
| Quadrant | BADHDUFLAG | Total packets | Discarded packets |
| A | 0 | 12678 | 3 |
| B | 0 | 14363 | 2 |
| C | 0 | 14706 | 2 |
| D | 0 | 22632 | 2 |
| Mode M9 | |||
|---|---|---|---|
| Quadrant | BADHDUFLAG | Total packets | Discarded packets |
| A | 0 | 23 | 0 |
| B | 0 | 23 | 0 |
| C | 0 | 23 | 0 |
| D | 0 | 24 | 0 |
| Mode SS | |||
|---|---|---|---|
| Quadrant | BADHDUFLAG | Total packets | Discarded packets |
| A | 0 | 124 | 0 |
| B | 0 | 124 | 0 |
| C | 0 | 124 | 0 |
| D | 0 | 124 | 0 |
| Quadrant | Total seconds | Saturated seconds | Saturation percentage |
|---|---|---|---|
| A | 6064 | 9 | 0.148417% |
| B | 6064 | 45 | 0.742084% |
| C | 6064 | 223 | 3.677441% |
| D | 6064 | 702 | 11.576517% |
Noise dominated data is calculated using 1-second bins in cleaned event files. If a bin has >2000 counts, and if more than 50% of those come from <1% of pixels, then it is considered to be noise-dominated and hence unusable.
| Quadrant | # 1 sec bins | Bins with >0 counts | Bins with >2000 counts | High rate bins dominated by noise | Noise dominated (total time) | Noise dominated (detector-on time) | Marked lightcurve |
|---|---|---|---|---|---|---|---|
| A | 7346 | 6065 | 4 | 4 | 0.05% | 0.07% | 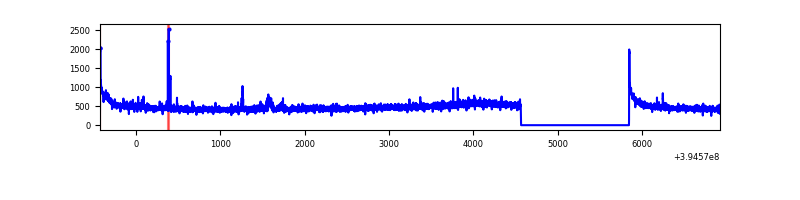 |
| B | 7346 | 6065 | 19 | 19 | 0.26% | 0.31% | 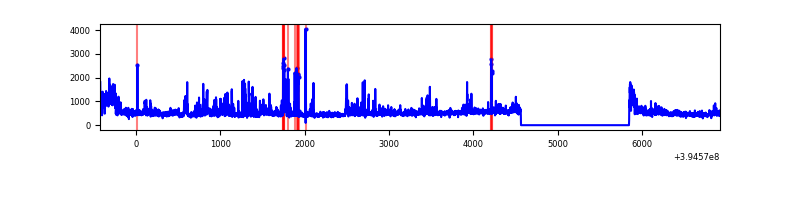 |
| C | 7346 | 6065 | 155 | 155 | 2.11% | 2.56% | 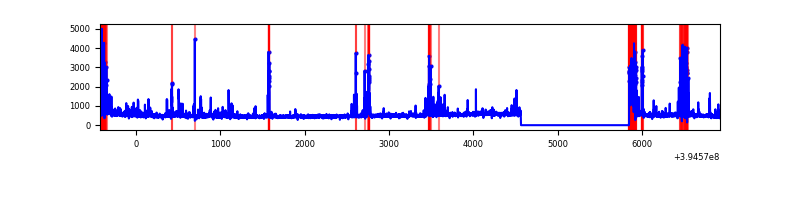 |
| D | 7346 | 6065 | 574 | 574 | 7.81% | 9.46% | 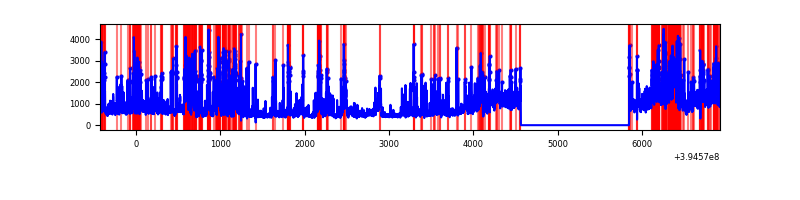 |
Top three noisy pixels from each quadrant. If the there are fewer than three noisy pixels in the level2.evt file, extra rows are filled as -1
| Pixel properties | Quadrant properties | ||||||
|---|---|---|---|---|---|---|---|
| Quadrant | DetID | PixID | Counts | Sigma | Mean | Median | Sigma |
| A | 10 | 83 | 221539 | 1597.37 | 684 | 670 | 138.3 |
| A | 15 | 223 | 49930 | 356.26 | 684 | 670 | 138.3 |
| A | 13 | 254 | 8336 | 55.44 | 684 | 670 | 138.3 |
| B | 5 | 172 | 292897 | 2230.81 | 678 | 658 | 131.0 |
| B | 4 | 232 | 180140 | 1370.08 | 678 | 658 | 131.0 |
| B | 0 | 219 | 102264 | 775.61 | 678 | 658 | 131.0 |
| C | 0 | 10 | 435088 | 2828.52 | 658 | 663 | 153.6 |
| C | 14 | 254 | 337877 | 2195.58 | 658 | 663 | 153.6 |
| C | 15 | 214 | 253804 | 1648.19 | 658 | 663 | 153.6 |
| D | 12 | 16 | 1389467 | 8788.4 | 642 | 624 | 158.0 |
| D | 12 | 235 | 605205 | 3825.7 | 642 | 624 | 158.0 |
| D | 1 | 20 | 564428 | 3567.67 | 642 | 624 | 158.0 |
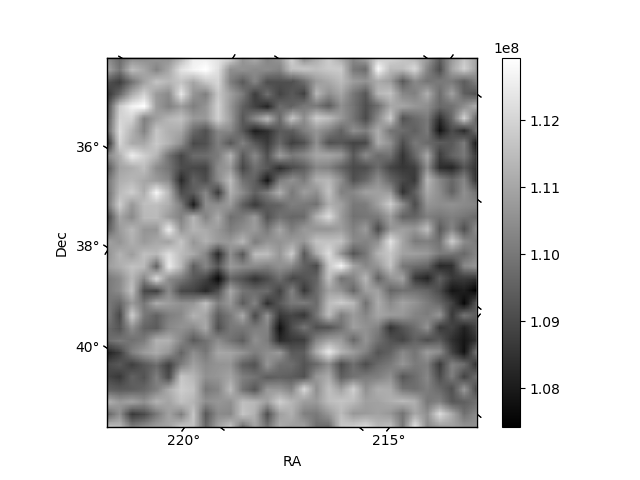
Histogram calculated using DETX and DETY for each event in the final _common_clean file
| Quadrant A |  |
 |
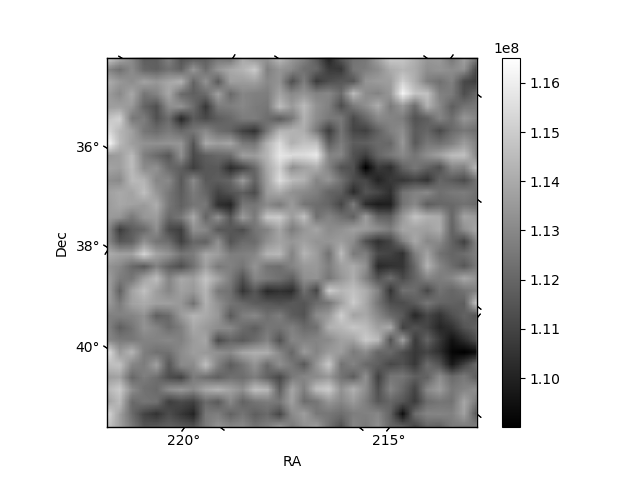
Quadrant B |
|---|---|---|---|
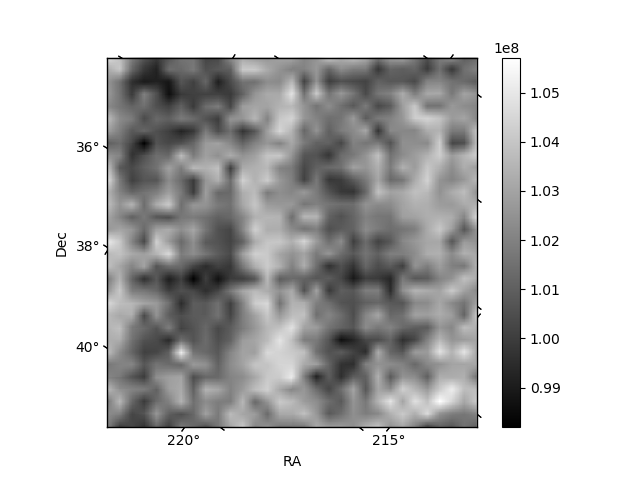
| Quadrant D |  |
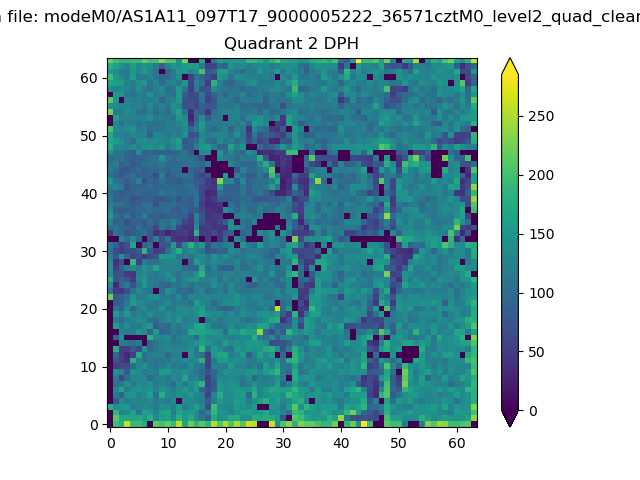 |
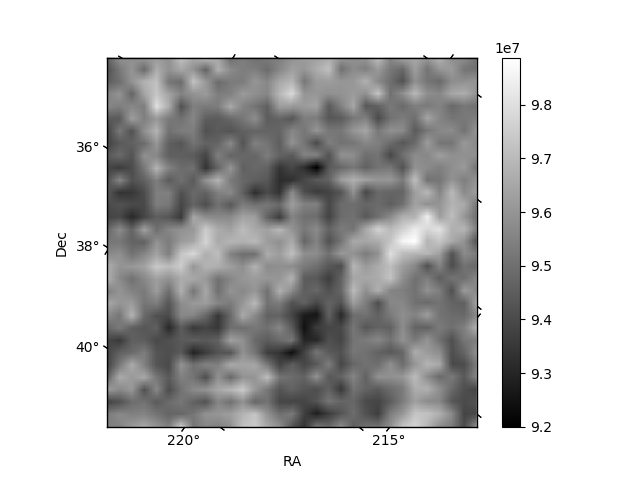
Quadrant C |
| Plot type | Count rate plots | Images |
|---|---|---|
| Comparison with Poisson distribution Blue bars denote a histogram of data divided into 1 sec bins. Red curve is a Poisson curve with rate = median count rate of data. |
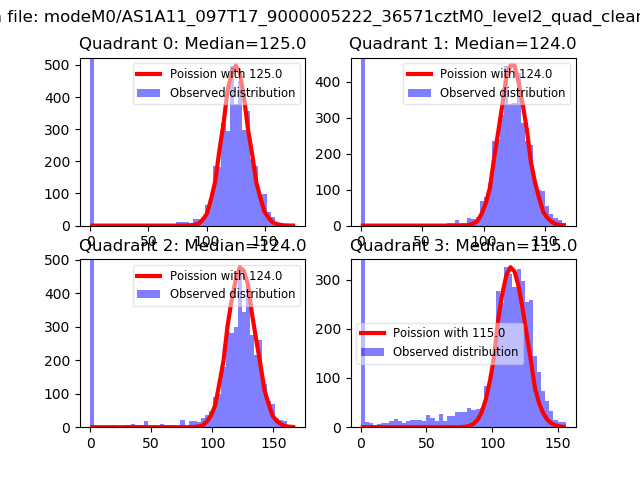 |
 |
| Quadrant-wise count rates Data is divided into 100 sec bins |
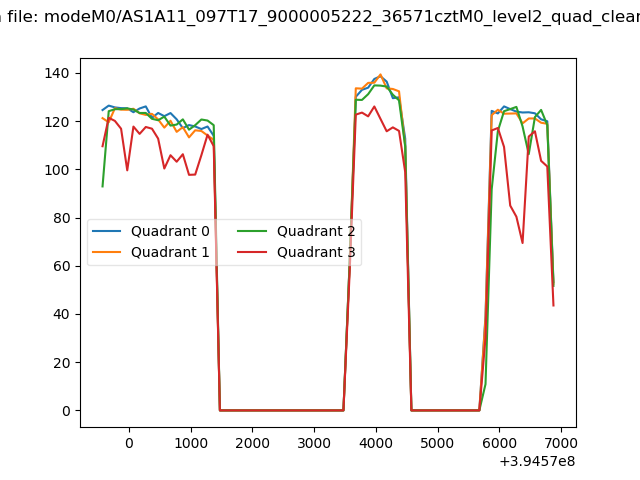 |
|
| Module-wise count rates for Quadrant A Data is divided into 100 sec bins |
 |
 |
| Module-wise count rates for Quadrant B Data is divided into 100 sec bins |
 |
 |
| Module-wise count rates for Quadrant C Data is divided into 100 sec bins |
 |
 |
| Module-wise count rates for Quadrant D Data is divided into 100 sec bins |
 |
 |
| Parameter | Plot |
|---|---|
| CZT HV Monitor |  |
| D_VDD | 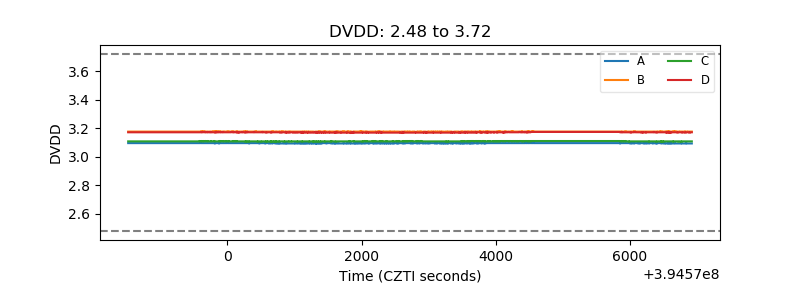 |
| Temperature 1 | 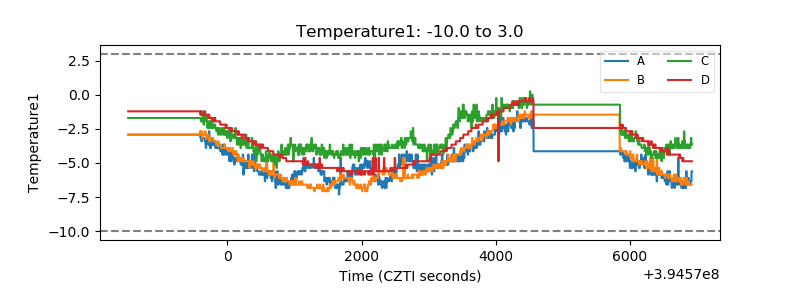 |
| Veto HV Monitor | 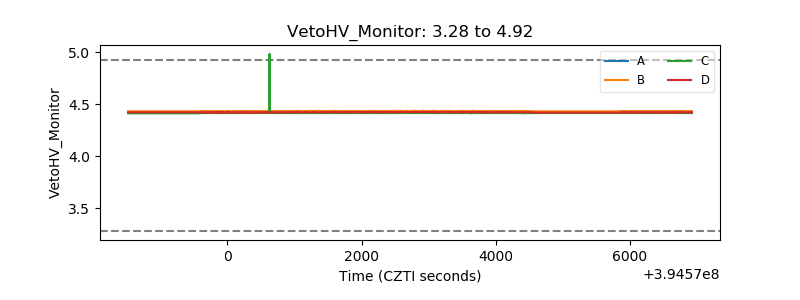 |
| Veto LLD |  |
| Alpha Counter | 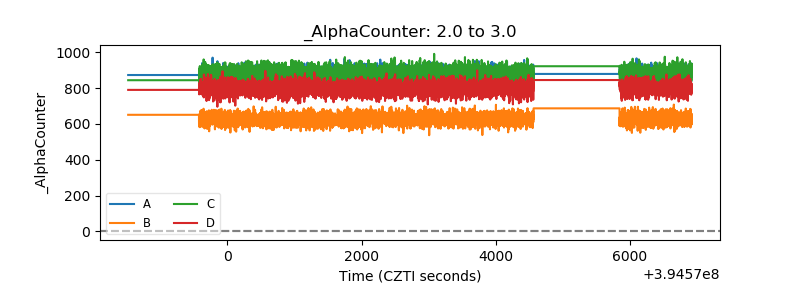 |
| _CPM_Rate | 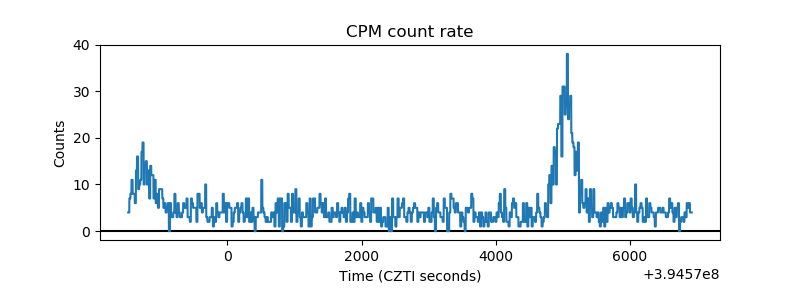 |
| CZT Counter | 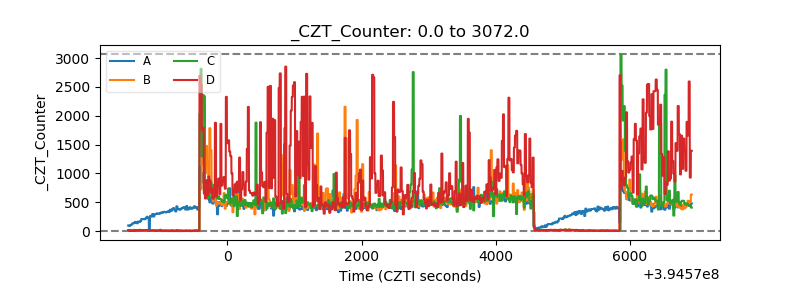 |
| +2.5 Volts monitor | 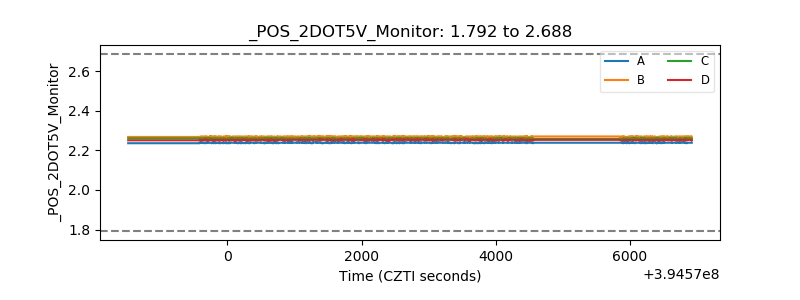 |
| +5 Volts monitor | 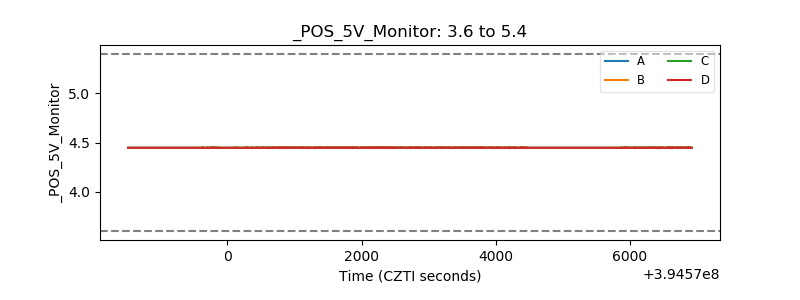 |
| _ROLL_ROT |  |
| _Roll_DEC |  |
| _Roll_RA | 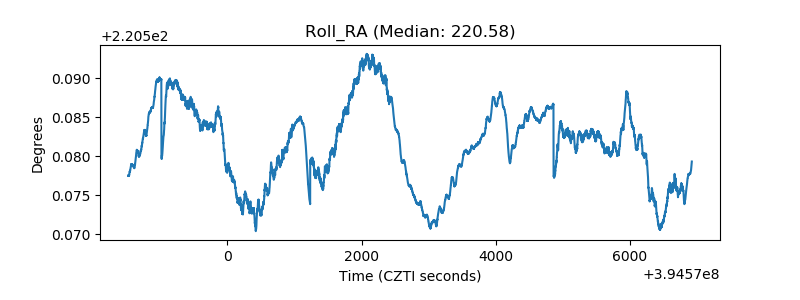 |
| Veto Counter |  |